Visualization of geodata of the network of reference stations in St. Petersburg
Idea
In October 2014, an article about building heat maps was published on Habré. Heat map is the most useful tool when you need to present three-dimensional data on a plane. As part of the work on creating a web interface for servicing the network of reference stations in St. Petersburg, an idea arose to visualize the data obtained by users during geodetic works. I also wanted to find the relationship between the activities of survey organizations and urban planning processes on the territory of St. Petersburg.
About network
The state satellite network of precise positioning of St. Petersburg was created in 2011 and is intended to provide geodetic and engineering and survey work in the city and adjacent areas of the Leningrad Region. The network allows an unlimited number of satellite navigation and geodetic receivers (having the appropriate functionality) to obtain the necessary information to determine the coordinates of the receivers in real time.
Network layout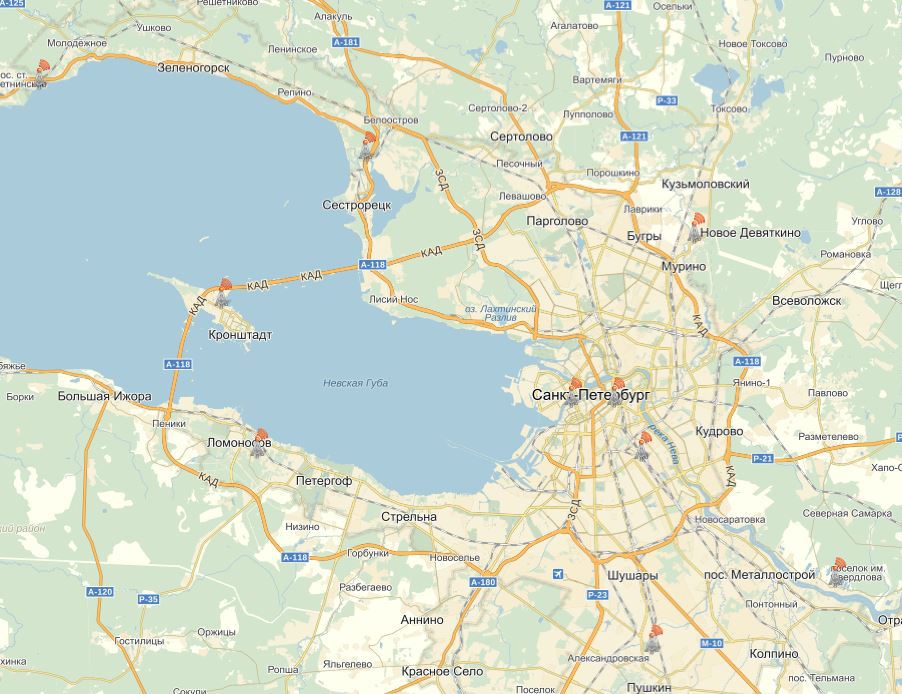
The network consists of 10 base stations located in the city. The coating is optimally formed and takes into account the density of the residential building and its impact on the efficiency of the network. Base stations with a single control center operate on the basis of satellite equipment and software from Leica, which allow receiving and processing signals from the main GNSS (GPS + GLONASS).
Initial data
The network is provided by the Leica GNSS Spider . Survey receiver data connections are logged as:
firm1; 01/06/2015; 13: 50: 55; 01/06/2015; 14: 00: 26; 00: 09: 31; Nearest_site_RTCM_3_MSK78; 60.096936; 30.315031; 46.809
firm2; 01/06/2015; 13: 44: 50; 01/06/2015; 14: 01: 47; 00: 16: 56; Nearest_site_CMR +; 59.928233; 30.622343; 53.039
firm3; 01/06/2015; 14: 00: 16; 01/06/2015; 14: 04: 40; 00: 04: 23; iMAX_CMR; 59.949775; 30.555935; 31.812
etc.
Single connection string pattern is as follows:
organization name; start date; start time; expiration date; end time; duration; type of product"; latitude; longitude; height
Thus, from the log of connections you can isolate an array of geographic coordinates of ground connections within the same city.
')
City landscape
Using the heat map module, a map was constructed, where the color gradation was set by the height:

Given the discreteness of the original data, the landscape of the city is still traced (Pulkovsky heights and growth north of the Neva are particularly noticeable). The absolute heights according to the general plan of St. Petersburg 2005 look like this:
Picture
Work intensity
On the basis of the same data file, a map of the "intensity" of survey work was created. The height is not taken into account, and the color gradation sets the frequency of connections in a particular area:
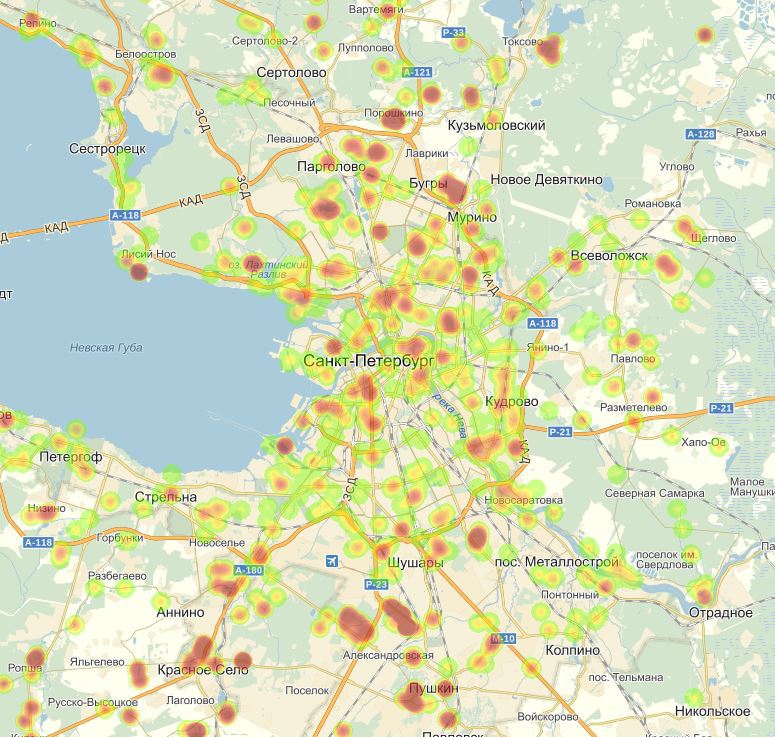
The “points of growth” of St. Petersburg are noticeable on the map - Devyatkino, the city of Yuzhny, Kudrovo, Lakhta, and Krasnoye Selo.
Total
Data visualization is entertaining, especially when it does not require accuracy, and the source data is discrete.
The examples considered do not take into account the temporary data of connections. They are naturally worth displaying dynamically (animation, for example).
Interesting links:
Source: https://habr.com/ru/post/261735/
All Articles