200 million checks per month or architecture and statistics of the CloudStats.me service
Hello!
This is the first post on behalf of our company on Habré and in it we want to tell you a little about the architecture of our cloud monitoring service of servers and web sites CloudStats.me , with which we are currently undergoing acceleration in IIDF in Moscow. We also want to share with you our current statistics and talk about plans for the near future, but first and foremost.
1. System architecture
')
Our platform is aimed at system administrators who do not want to mess around with setting up Nagios or Zabbix for a long time, but just need to keep track of the main parameters of the servers without spending a lot of time and resources on monitoring. We try not to overload the system interface with a number of settings, so everything is built on the KISS principle (keep it simple stupid).
Almost the entire system is written in Ruby on Rails (with the exception of the python agent, which we will soon also replace with the agent on Ruby), using RactiveJS . Front-end works on Tomcat, the load on which is distributed using Haproxy. As a CDN, we use CloudFlare, through which only static JS, CSS, PNG, etc. files pass. Nevertheless, even for such a rather simple and not very large service so far, we already have to apply load balancing on all parts of the platform to avoid overloads.
Service architecture at the end of June:
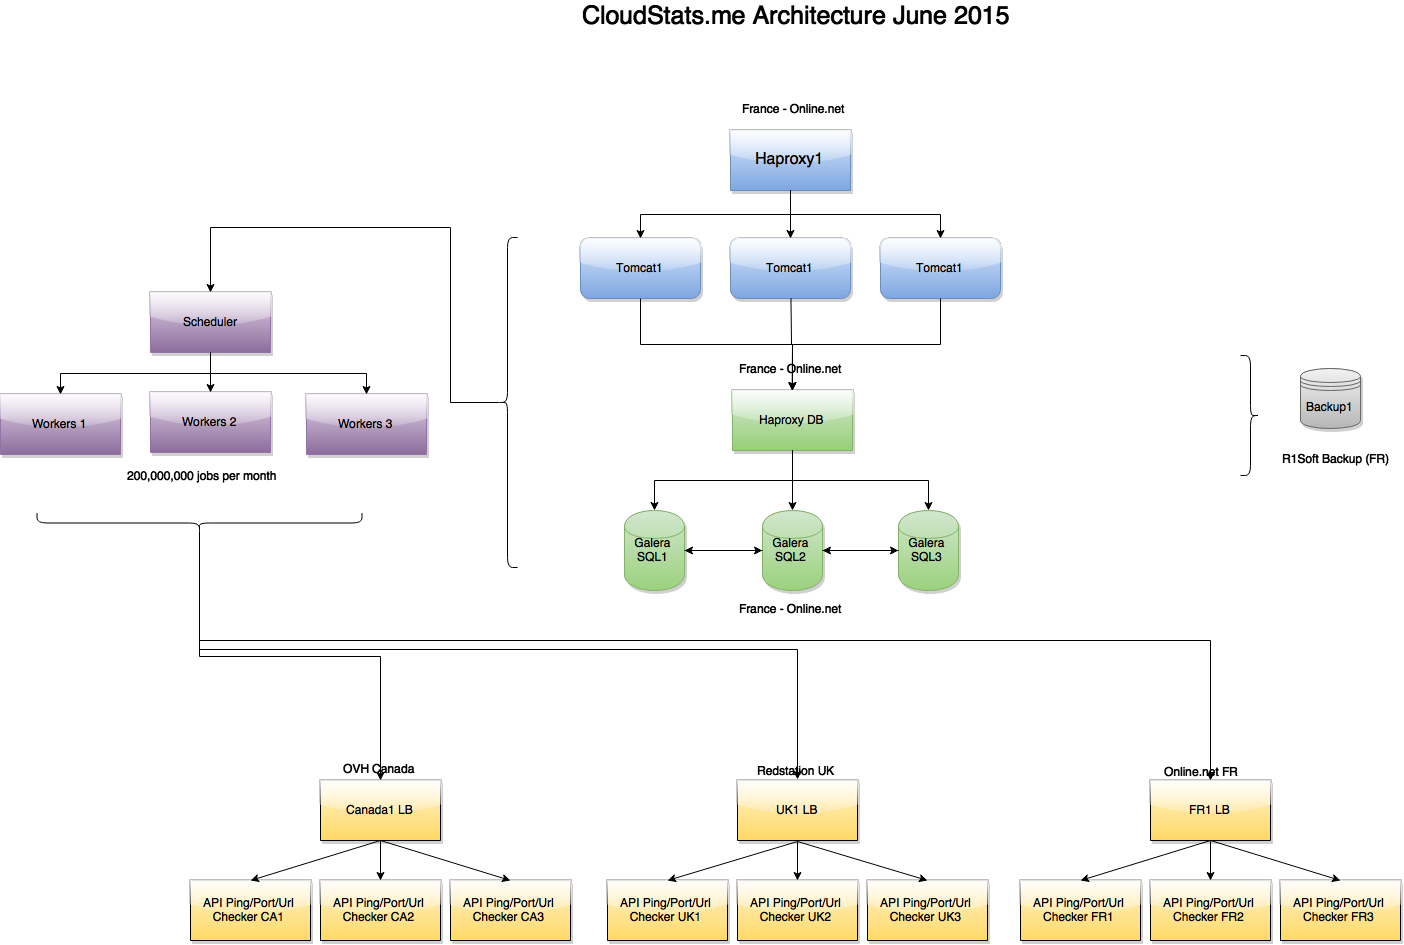
( big picture )
As you can see in the picture, tasks are created by a separate Scheduler node and processed by several Worker nodes, which in turn are connected via API with the Ping / Port / URL check servers located in 3 zones - France, UK, USA. If one of the verification servers returns “Ping Failed” status for any IP, then additional checks are performed in the other two zones in order to exclude false positives. In the future, we plan to bring all this to the front-end so that you can see from which locations your IP is unavailable (for example, in a situation with DDoS or routing issues).
As we wrote earlier , we use the master-master replication cluster of Galera MariaDB and Haproxy in front of it. Haproxy installed on all parts of our architecture, which allows us to both roll out new versions of the product without affecting users, and update the backend system without degrading the service. In the future, we plan to start using partitioning.
2. Infrastructure

From data centers, our choice fell on 3 fairly common DCs, which allow us to keep infrastructure costs under control, and the level of service at the proper level.
We use Online.net for our servers in France, where the main front-end system is located. The choice fell on Online.net, because there is a convenient server control panel that allows you to quickly transfer IP addresses from one server to another, the presence of a remote console iDRAC, as well as the absence of traffic restrictions and protection against DDoS attacks. In Online.net we used about 11 Tb of traffic for June and for this there were no overpayments, which is convenient.
Additional servers producing URL, Ping, and Ports checks are located in OVH Canada and Redstation UK, which gives us the necessary geographical coverage. However, in July we will complete the move to the Microsoft Azure platform, which will give us access to 15 data centers around the world. This will increase the number of locations from which we will perform checks on servers and sites, as well as increase the resiliency of the platform as a whole (we will write about this separately).
At the moment, we already produce about 200 million checks per month, which includes pings of all servers (1352 servers x 2 pings per minute x 60 minutes x 24 hours x 31 days = ~ 120 million “ping jobs” per month), URL checking, as well as port checking, collecting and processing statistics on servers, etc.
3. Some statistics:
At the moment, 1352 servers have been added to our system, on which our agent is installed and which send us their statistics every 4 minutes. In addition, we check each added server using an external ping 2 times per minute.
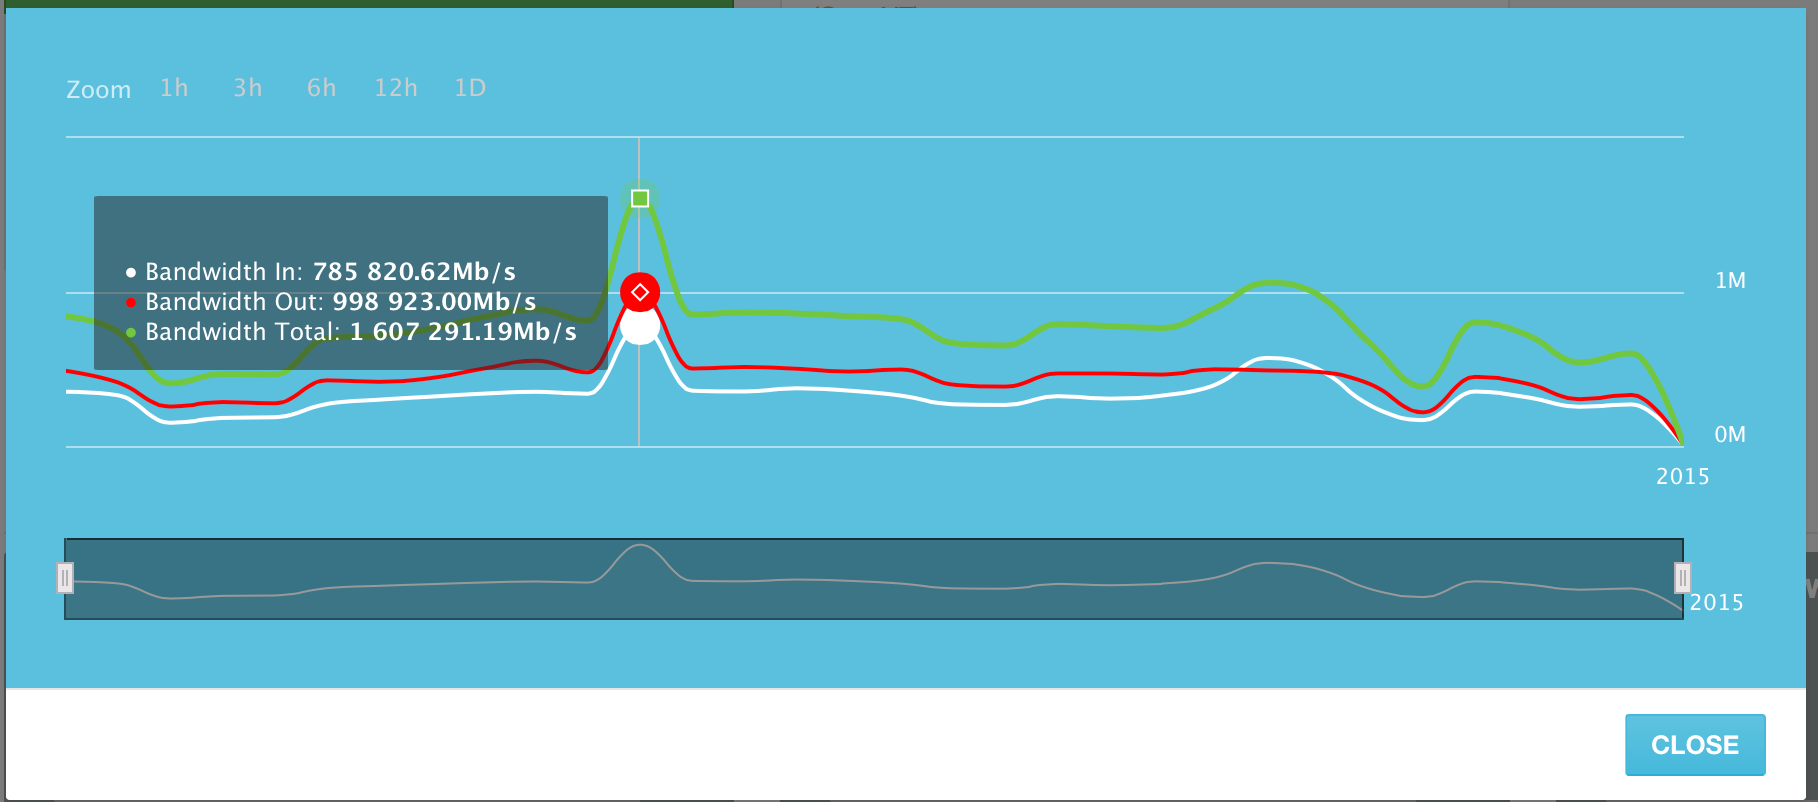
The servers added to the system on the peak day of June 10, 2015 generated up to 1.6 Terabits of traffic per second. (Tb / s). This includes both inbound and outbound traffic. Outgoing traffic is slightly larger than incoming traffic, but this is quite predictable.
Channel use by day for June 2015. The peak day is June 10th.
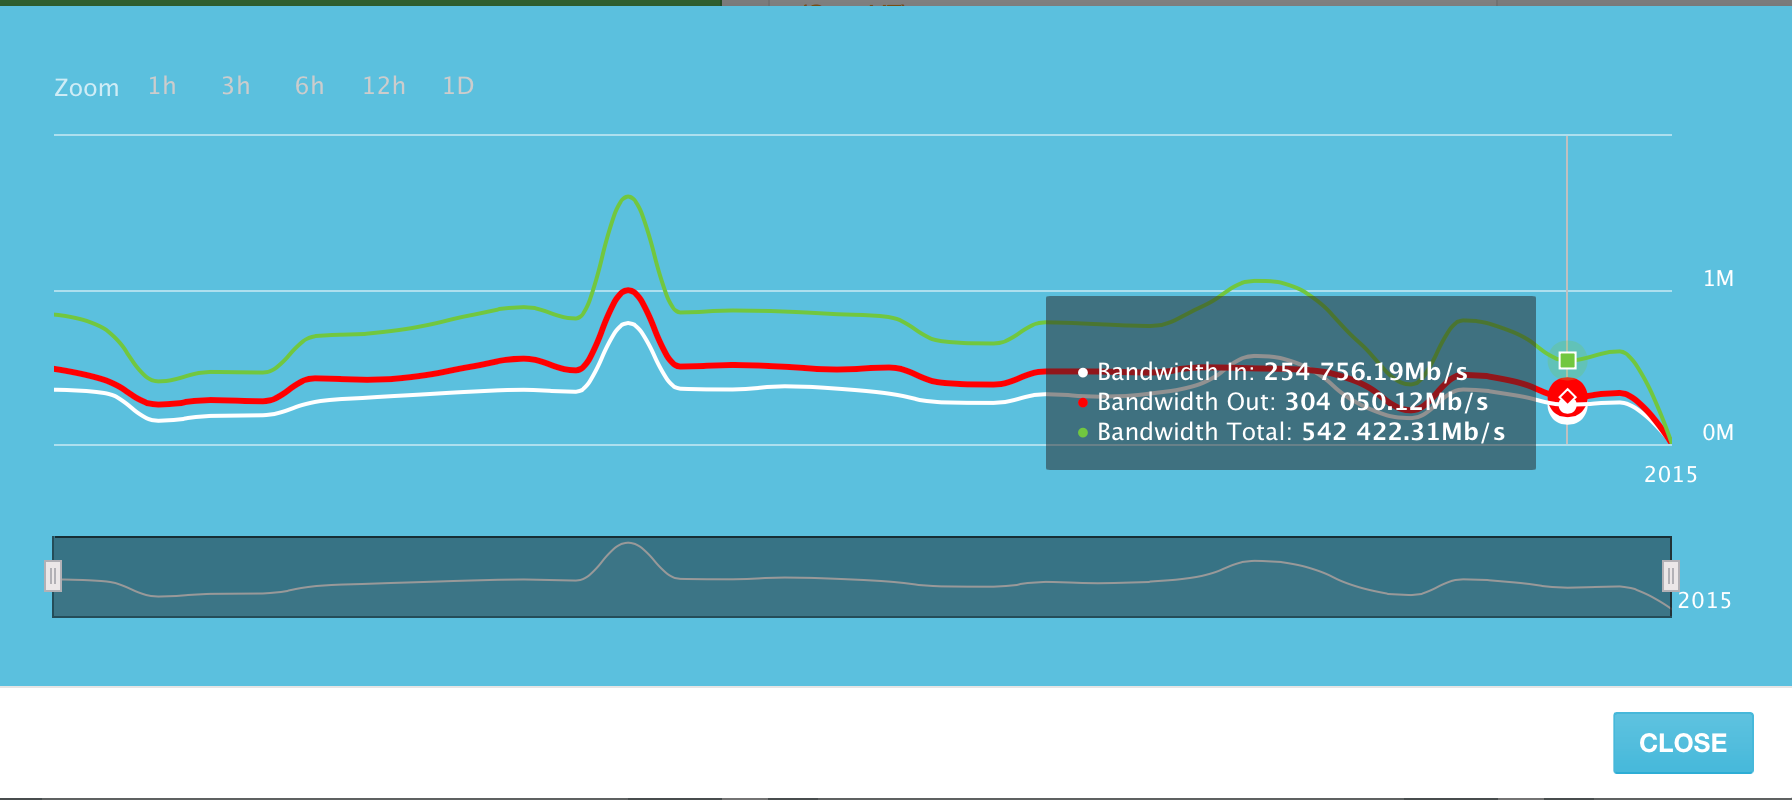
The average channel utilization of all servers in the system is around 500 gigabits per second.
With a small recalculation, these “average” 500 Gigabit of traffic per second result in approximately 5,273 Terabytes of transmitted data per day. And this is the amount of data transmitted only ~ 1300 servers in our system!
Of course, we are still a young monitoring service, but we are making every effort to create a convenient and simple platform that can be used both within the company, and to show customers and give them access.
However, we do not follow the model of competitors and do not create a “domestic New Relic”. On the contrary, we want to create a platform in which there will be not only monitoring of servers, but also security elements - scanning servers and sites for vulnerabilities; ability to manage servers from one platform, as well as backing up data (backups) to cloud storage.
Stay tuned!
This is the first post on behalf of our company on Habré and in it we want to tell you a little about the architecture of our cloud monitoring service of servers and web sites CloudStats.me , with which we are currently undergoing acceleration in IIDF in Moscow. We also want to share with you our current statistics and talk about plans for the near future, but first and foremost.
1. System architecture
')
Our platform is aimed at system administrators who do not want to mess around with setting up Nagios or Zabbix for a long time, but just need to keep track of the main parameters of the servers without spending a lot of time and resources on monitoring. We try not to overload the system interface with a number of settings, so everything is built on the KISS principle (keep it simple stupid).
Almost the entire system is written in Ruby on Rails (with the exception of the python agent, which we will soon also replace with the agent on Ruby), using RactiveJS . Front-end works on Tomcat, the load on which is distributed using Haproxy. As a CDN, we use CloudFlare, through which only static JS, CSS, PNG, etc. files pass. Nevertheless, even for such a rather simple and not very large service so far, we already have to apply load balancing on all parts of the platform to avoid overloads.
Service architecture at the end of June:
( big picture )
As you can see in the picture, tasks are created by a separate Scheduler node and processed by several Worker nodes, which in turn are connected via API with the Ping / Port / URL check servers located in 3 zones - France, UK, USA. If one of the verification servers returns “Ping Failed” status for any IP, then additional checks are performed in the other two zones in order to exclude false positives. In the future, we plan to bring all this to the front-end so that you can see from which locations your IP is unavailable (for example, in a situation with DDoS or routing issues).
As we wrote earlier , we use the master-master replication cluster of Galera MariaDB and Haproxy in front of it. Haproxy installed on all parts of our architecture, which allows us to both roll out new versions of the product without affecting users, and update the backend system without degrading the service. In the future, we plan to start using partitioning.
2. Infrastructure
From data centers, our choice fell on 3 fairly common DCs, which allow us to keep infrastructure costs under control, and the level of service at the proper level.
We use Online.net for our servers in France, where the main front-end system is located. The choice fell on Online.net, because there is a convenient server control panel that allows you to quickly transfer IP addresses from one server to another, the presence of a remote console iDRAC, as well as the absence of traffic restrictions and protection against DDoS attacks. In Online.net we used about 11 Tb of traffic for June and for this there were no overpayments, which is convenient.
Additional servers producing URL, Ping, and Ports checks are located in OVH Canada and Redstation UK, which gives us the necessary geographical coverage. However, in July we will complete the move to the Microsoft Azure platform, which will give us access to 15 data centers around the world. This will increase the number of locations from which we will perform checks on servers and sites, as well as increase the resiliency of the platform as a whole (we will write about this separately).
At the moment, we already produce about 200 million checks per month, which includes pings of all servers (1352 servers x 2 pings per minute x 60 minutes x 24 hours x 31 days = ~ 120 million “ping jobs” per month), URL checking, as well as port checking, collecting and processing statistics on servers, etc.
3. Some statistics:
At the moment, 1352 servers have been added to our system, on which our agent is installed and which send us their statistics every 4 minutes. In addition, we check each added server using an external ping 2 times per minute.
The servers added to the system on the peak day of June 10, 2015 generated up to 1.6 Terabits of traffic per second. (Tb / s). This includes both inbound and outbound traffic. Outgoing traffic is slightly larger than incoming traffic, but this is quite predictable.
Channel use by day for June 2015. The peak day is June 10th.
The average channel utilization of all servers in the system is around 500 gigabits per second.
With a small recalculation, these “average” 500 Gigabit of traffic per second result in approximately 5,273 Terabytes of transmitted data per day. And this is the amount of data transmitted only ~ 1300 servers in our system!
Of course, we are still a young monitoring service, but we are making every effort to create a convenient and simple platform that can be used both within the company, and to show customers and give them access.
However, we do not follow the model of competitors and do not create a “domestic New Relic”. On the contrary, we want to create a platform in which there will be not only monitoring of servers, but also security elements - scanning servers and sites for vulnerabilities; ability to manage servers from one platform, as well as backing up data (backups) to cloud storage.
Stay tuned!
Source: https://habr.com/ru/post/261497/
All Articles