Tame JMeter
 Today I want to talk about a wonderful tool, whose name is in the title of the article. Of course, my goal is not to write a detailed Apache JMeter tutorial. In my article, I just want to fix a number, in my opinion, not obvious moments that I had to face in my daily work. I hope that my article will be useful (I’m just warning you that there will be a lot of pictures).
Of course, I'm not the first to write about JMeter on Habré , but in almost all previous articles, the emphasis is on load testing. Although this is the main use of JMeter, but only his capabilities are not limited to them. Let's just see what protocols this product can work with:
- Web - HTTP, HTTPS
- SOAP / REST
- FTP
- Database via JDBC
- Ldap
- Message-oriented middleware (MOM) via JMS
- Mail - SMTP (S), POP3 (S) and IMAP (S)
- MongoDB (NoSQL)
- Native commands or shell scripts
- Tcp
Thus, if you are faced with some kind of automation task and everything you need is listed in this list, you should definitely consider using JMeter before plunging into programming on your favorite Perl, Python or Java. Perhaps this approach will save a lot of time.
Installation
It's simple:
')
- Install Java (if not already installed)
- We extort and unpack the fresh build JMeter
- Set the JMETER_BIN environment variable to the directory with JMeter executables (Windows only)
- Run jmeter.bat or jmeter.sh (depending on the operating system) from the bin directory
The only problem I encountered on Windows is that the value of the JMETER_BIN variable must end with a forward or backslash. Details can be found in the running script. Reading the instructions will also not be superfluous.
Script entry
This is perhaps the most spectacular JMeter feature. It has already been described earlier , but I will repeat it, since in that article we talked about a slightly outdated version. JMeter can be run in proxy mode, so that all HTTP traffic passes through it. All interaction details will be automatically recorded in the selected Thread Group or Recording Controller . To add new nodes to the tree, simply click on the right mouse button and select the required type from the drop-down menu:
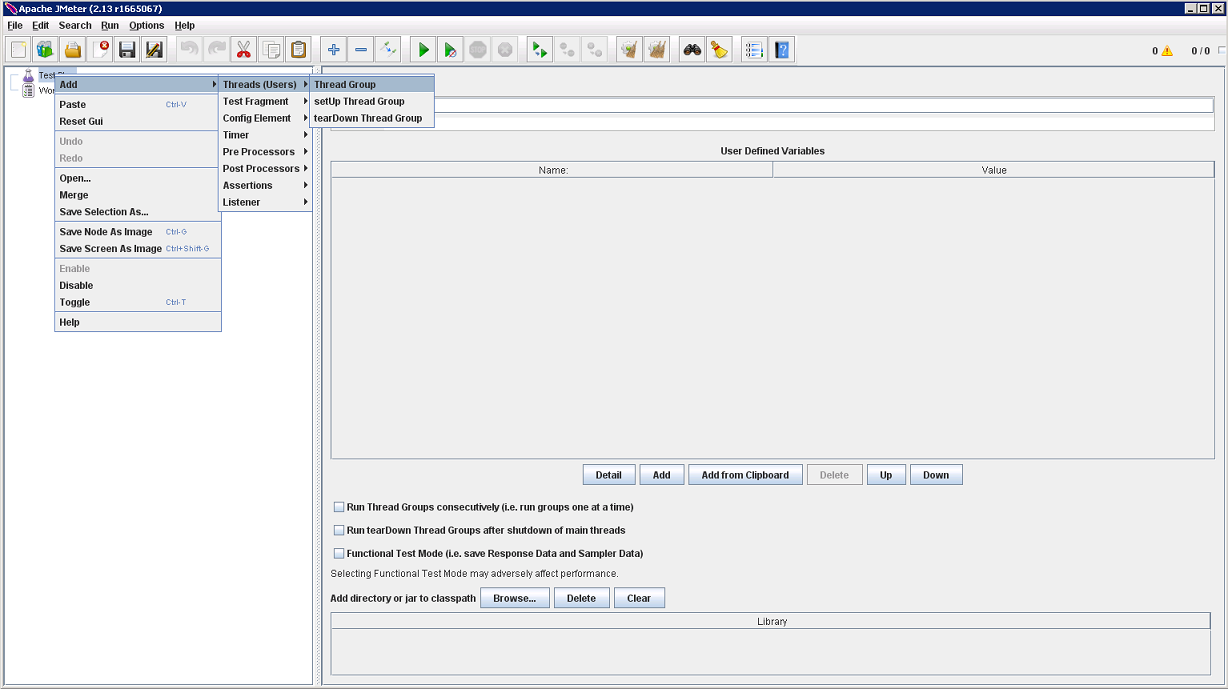
Thread Group , which controls such settings as the number of threads used for testing and the number of requests in the test, is in the Treads (Users) category, and the HTTP (S) Test Script Recorder in Non-Test Elements itself .
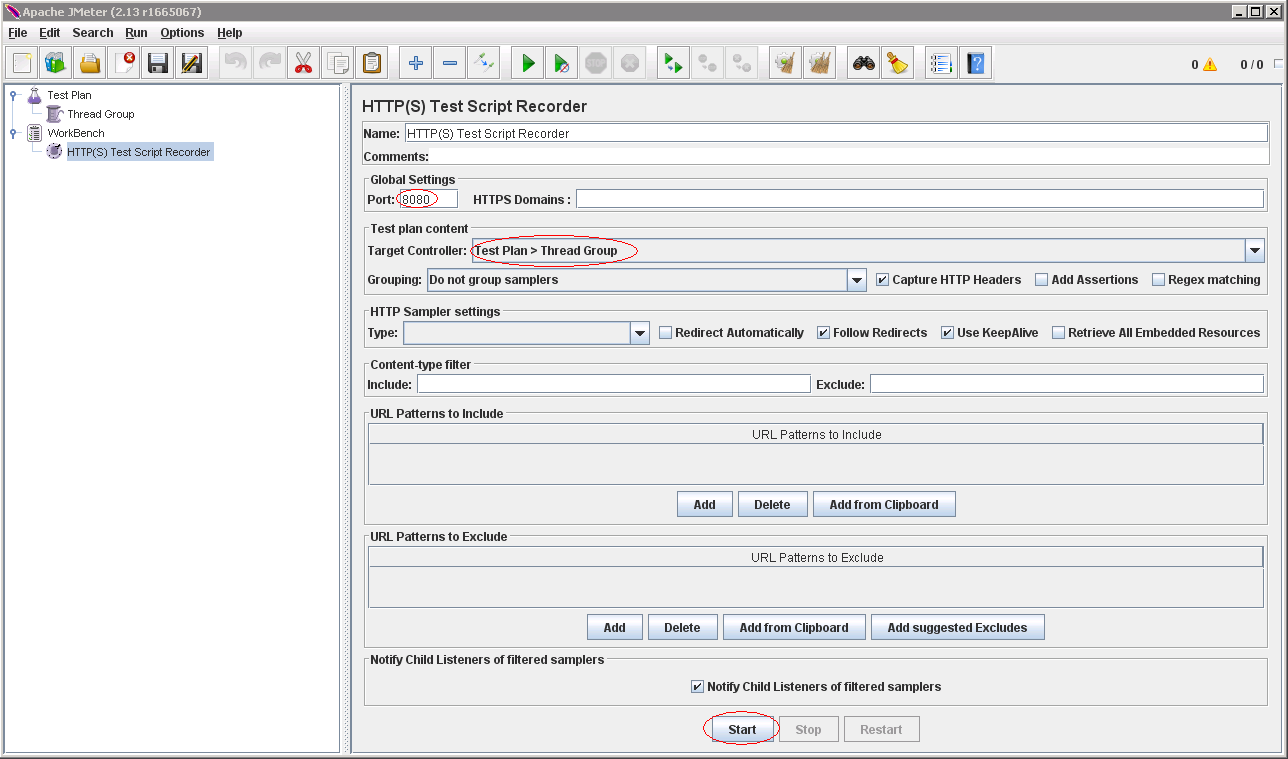
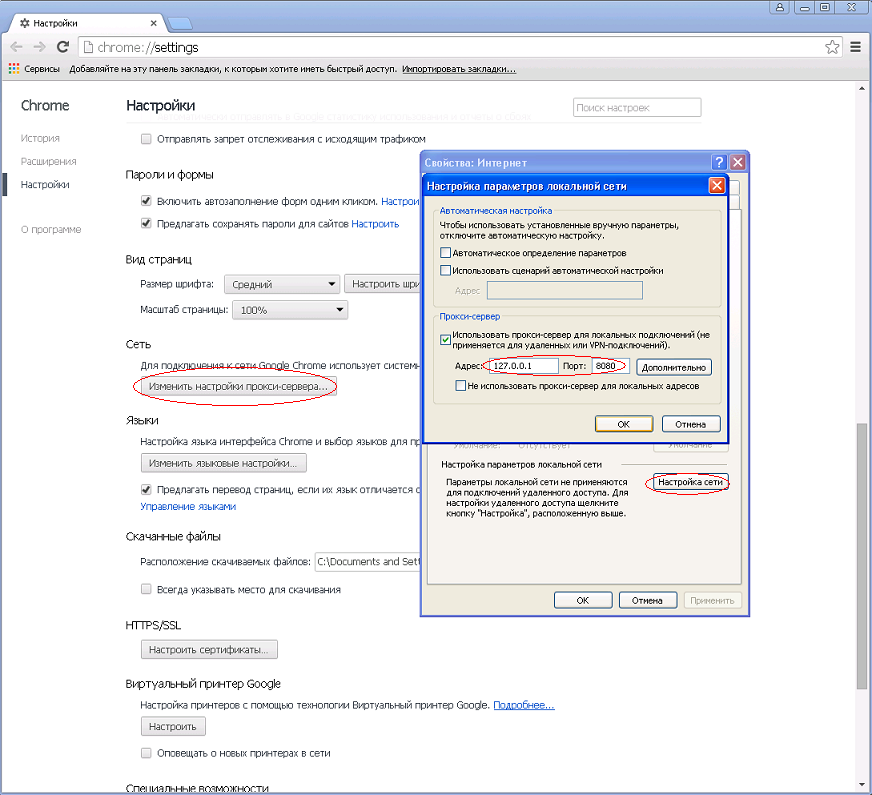
I highlighted the settings on which you should pay attention. The port may have to be changed if something is already raised on the 8080. In complex cases, the HTTP Cookie Manager and the HTTP Authorization Manager will have to be added to the Test Plan . After clicking the Start button, go to the settings of your favorite browser:
Interaction with Yandex, suddenly, turns out to be very difficult:
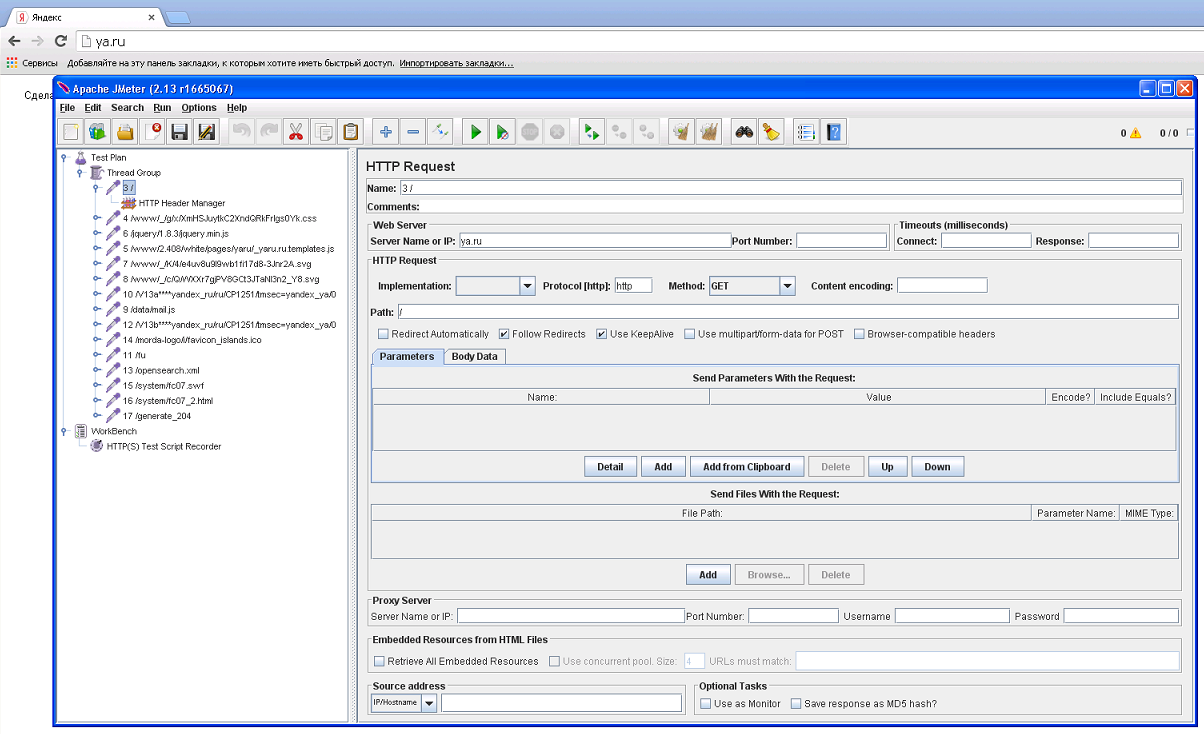
Received requests ( HTTP Request ) along with their settings ( HTTP Header Manager ) can be transferred to any place of the script using your favorite Copy & Paste commands (Drag & Drop also works). Even if you are firmly convinced of what is happening on your site, the Script Recorder can be very useful in order to learn the details. In addition, automatic generation of scripts is much more fun than driving them with your hands. The process of writing scripts is described in more detail in this manual .
Variables
For something serious enough, we will need the possibility of parameterization. For example, suppose that we need to set timeouts during which JMeter will wait for a server response. It would be too tiring to drive them back into each HTTP Request , with any change. At the same time, we define the HTTP Proxy settings (if used):

In the Password field, the value of $ {user_pass} is scored, here you have to take my word for it. The settings themselves are conveniently kept in the User Defined Variables (this element can be found in the Config Element category):
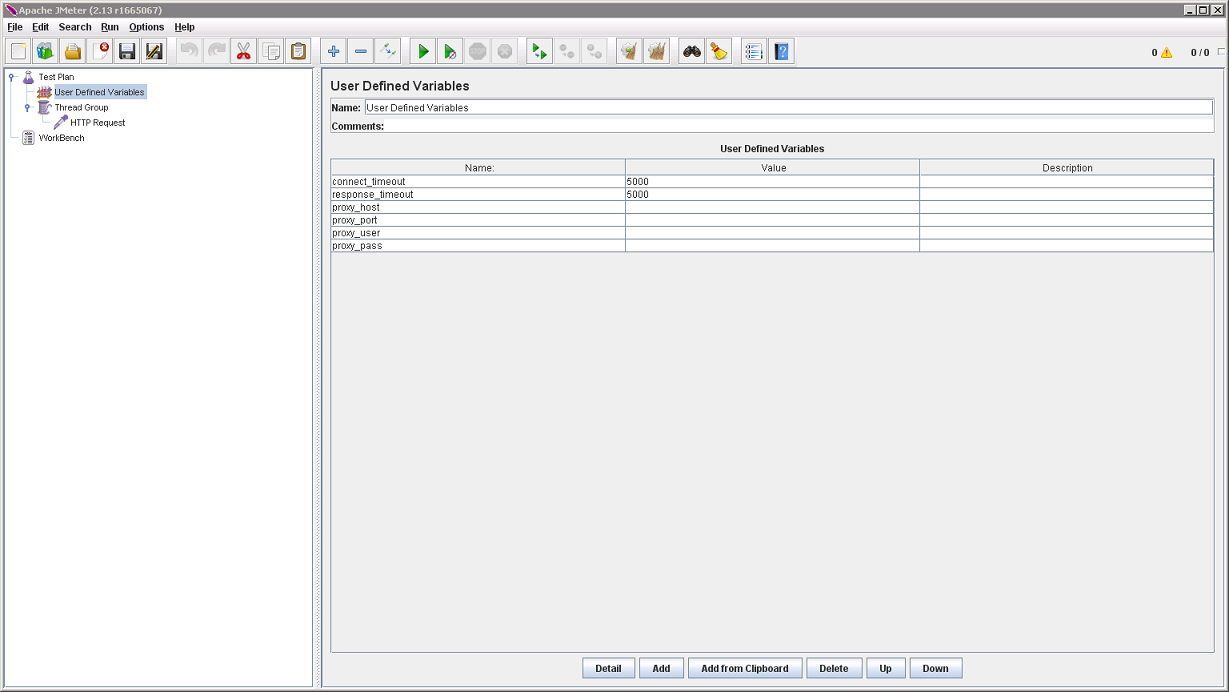
Empty variable values are not a problem. Blank lines will be inserted into the corresponding settings, as required, in case HTTP Proxy is not used. You can go even further and really place all HTTP settings in one place:
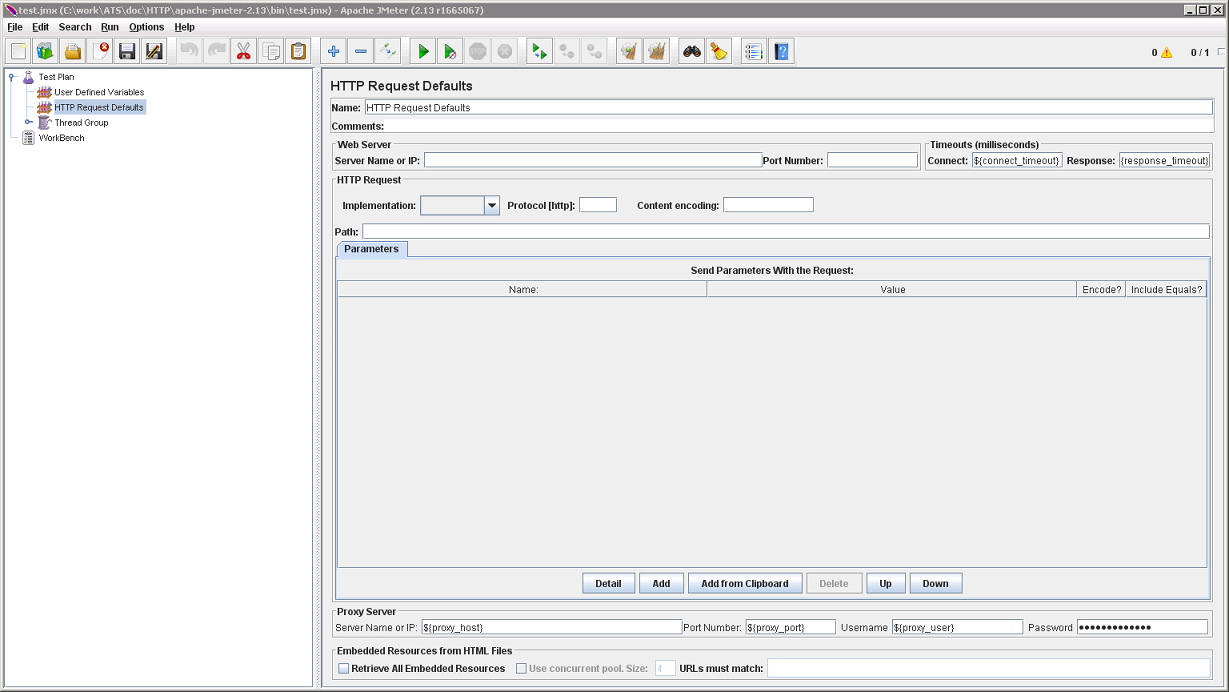
The HTTP Request Defaults element, as well as the User Defined Variables, is located in the Config Element category.
Debugging
Now, it would be nice to see what happens when the script is executed. Different type of visualizers are placed in the category Listener . We will need to View Results Tree . Add it and run the script with the Run / Start command (Ctrl + R). You can see that the server’s response is also difficult:

This picture is observed if the address redirects us to another page and one problem may be related to this. If we try to analyze the server response (as I will show below), only the last answer (the page on which the redirect occurred) will be available to us. If we are also interested in the answer from the previous page, automatic redirect will have to be disabled. The Follow Redirects setting of the HTTP Request element is responsible for this. Having analyzed the answer, we can get the address of the landing page and perform a second request manually.
There is one more element that is extremely useful for debugging scripts. It is in the Sampler category and is called Debug Sampler . Each time a control reaches it, it displays the current values of all variables. Add it to the Thread Group and run the script again (in order to clear the output of the previous launch, it is convenient to use the key combination Ctrl + E):
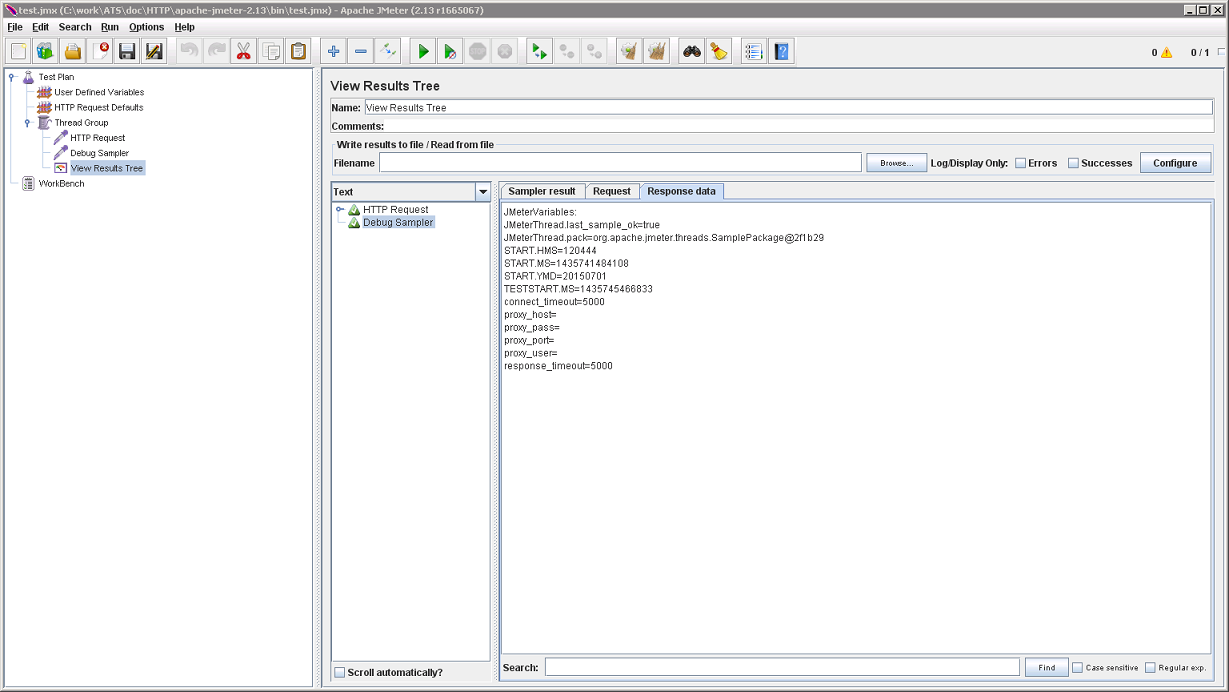
All variables at a glance. Conveniently.
JDBC Request
This Sampler gives us access to any database that supports the JDBC protocol. To begin with, we will add to the Test Plan a configuration item with the settings for connecting to the database server ( JDBC Connection Configuration ):
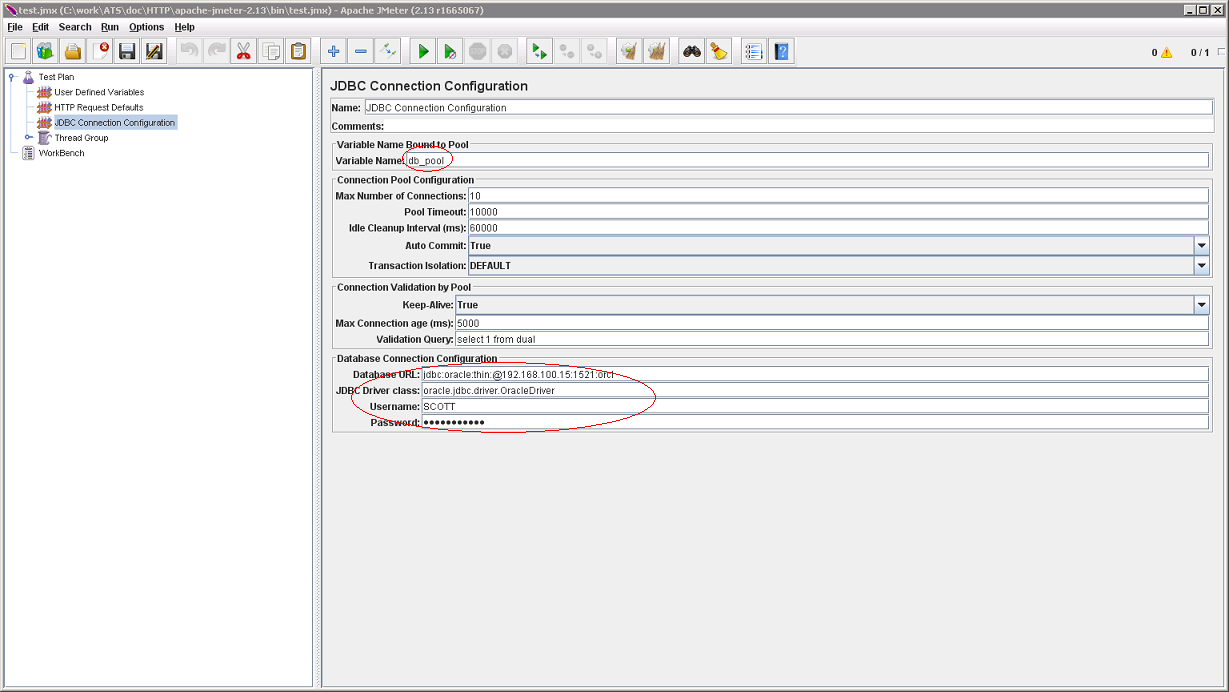
In addition to the actual settings for connecting to the database, it is important to fill in the Variable Name field here. This name will be used in the JDBC Request ( Sampler ) to access the session pool:
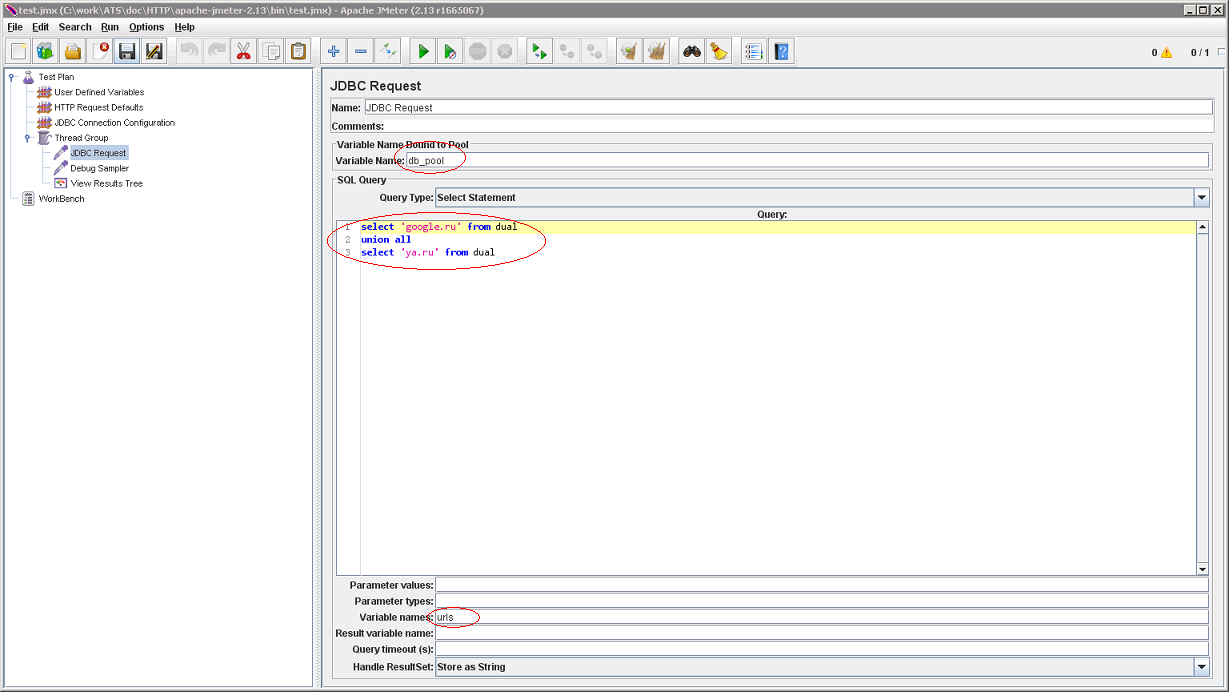
If you are interested in select results, you will have to fill in Variable Names . JMeter itself cannot parse SQL queries for column names. You can list column names separated by commas and skip columns without giving them a name. We insert the Debug Sampler and see what happens:

We see that the documentation does not lie. The variables urls_1 and urls_2 appeared (the number of lines, as promised, in urls_ # ). In this place, it is necessary to be careful. Records are not selected one by one, but all at once and after reading> 1000 lines you can easily get too much memory. Now, it would be nice to bypass the addresses obtained in the loop:

Yes, just like that. We set the urls variables from 0 to $ {urls_ #} and put the current value in the url . ForEach Controller itself can be found in the Logic Controller category. Inside it, create a parameterized HTTP Request . We start, we look:
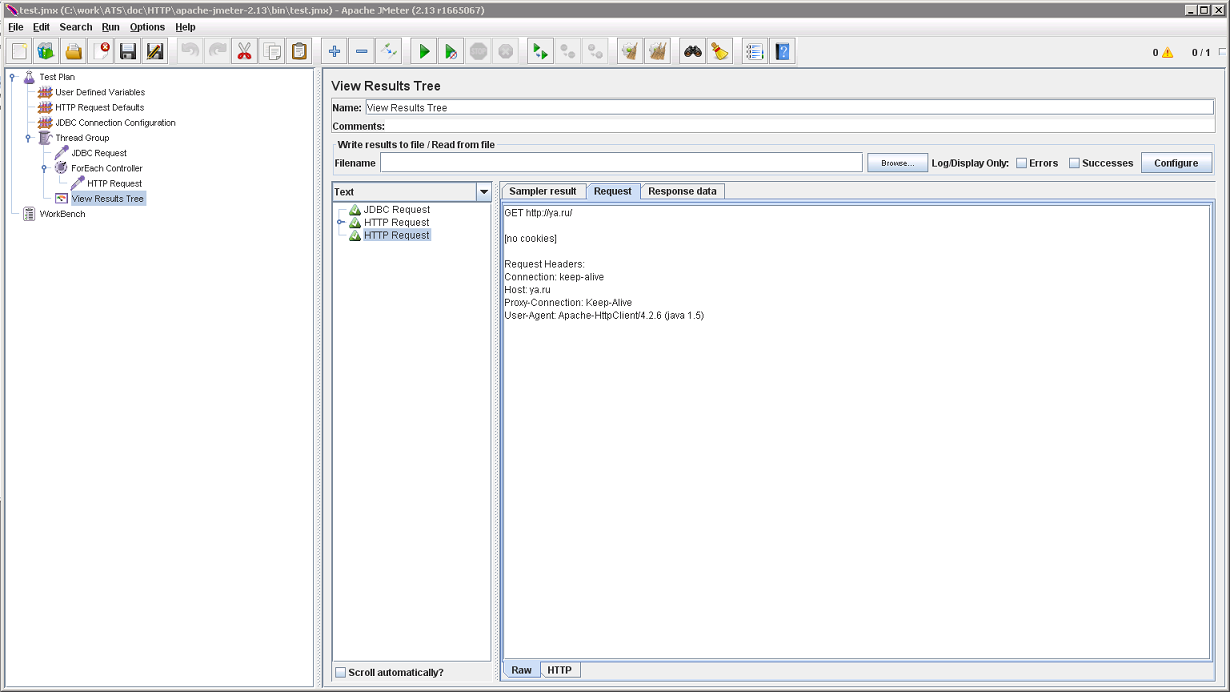
Everything is working.
Regular expressions
Now, I would like to analyze the results of calls to Web servers. For this, we have all the power of regular expressions . Regular Expression Extractor can be found in Post Processors . Add it to the HTTP Request and configure:
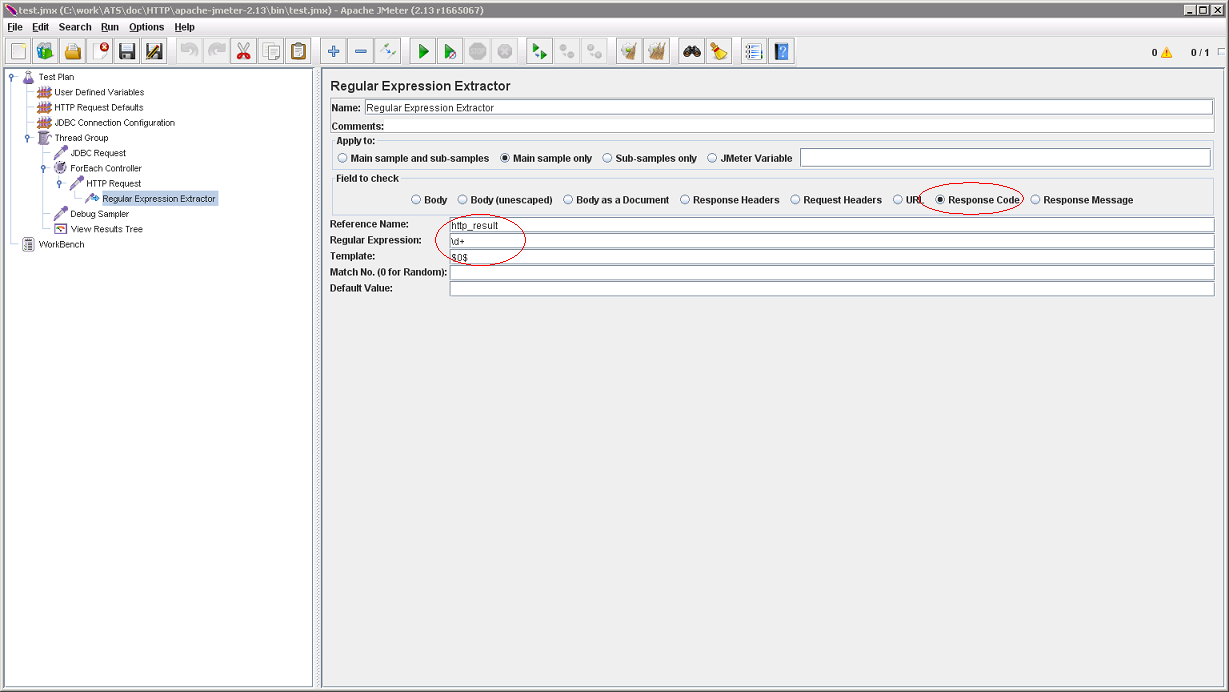
Here, we are only interested in the HTTP response code (but, as the illustration shows, the content of the response can also be processed). We will extract the string of numbers ( Regular Expression ) and place the result of applying the Template in the http_result ( Reference Name ) variable:
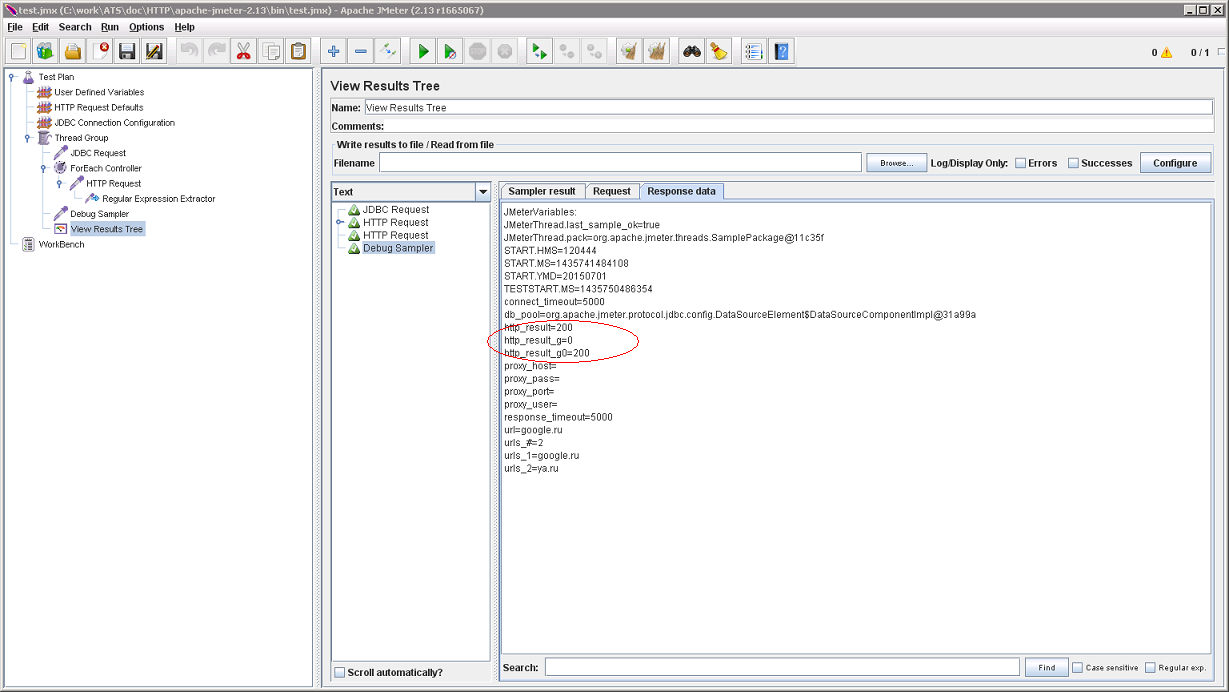
As expected, we get 200. At the same time, you can see how the capture into variables is performed by a regular expression.
Something is inside
Now, let's say that we are interested in the time during which the HTTP request was executed. And it interests us not just for statistics, but we want to somehow use it in the script (for example, add it to the database). This task will help to cope with BeanShell . Specifically, we use its Pre - and PostProcessor s.

In the first we will get the timestamp:
Long t = ctx.getPreviousResult().currentTimeInMillis(); vars.put("timestamp", t.toString()); And in the second, to receive with it a time delay:
Long d = ctx.getPreviousResult().currentTimeInMillis() - Long.parseLong(vars.get("timestamp")); vars.put("delay", d.toString()); In general, it also works:
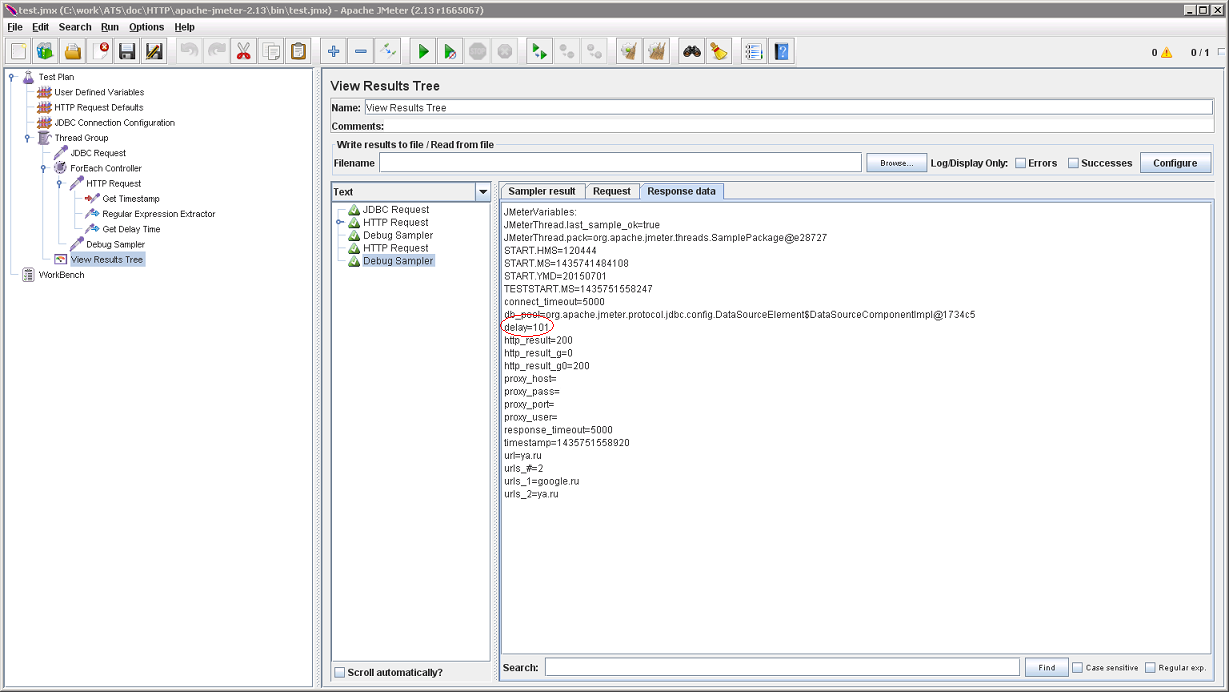
But an important remark should be made here. Since, at the moment, I am not engaged in stress testing, the performance of this design is not very important to me. If in your case this is not the case, you should read the next article .
Launch
If it were not for this opportunity, it would not be worthwhile to start this whole conversation. In the case of load testing, the script can be run from the GUI, no problem. But if we are interested in automation, you must be able to run it silently (for example, by cron ). Of course, this possibility also exists:
./jmeter.sh -n -t test.jmx -l test.log Save the script to a file with jmx extension (inside this is XML) and run this command. The script works out without launching the GUI and at the same time writes the results of its work to the log. Everything is simple and convenient.
Source: https://habr.com/ru/post/261483/
All Articles