Retina authentication methods
The first scanners of the retina appeared in the 80s of the last century. They are widely used in access control systems for highly sensitive objects, since they have one of the lowest percentages of denied access to registered users and there is practically no erroneous access authorization, but despite this, retinal scanners are not widely available from - for the high cost and complexity of the optical scanning system. And until recently, everything remained the same, although the algorithms continued to evolve.
To date, the technology of 3d printing has greatly reduced the price of retinal scanners. Andrew Bastavrus together with his team printed on the 3d printer a nozzle for a smartphone that allows you to observe the retina through the camera of the phone.
This article is devoted to the description of algorithms for matching signs of the retina and is a continuation of the article on segmentation of blood vessels.
')
An overview of biometric identification / authentication methods is provided here .
One of the most important problems when using the retina for recognition of personality is the movement of the head or the eye during scanning. Because of these movements, displacement, rotation and scaling may occur relative to the sample from the database (Fig. 1).
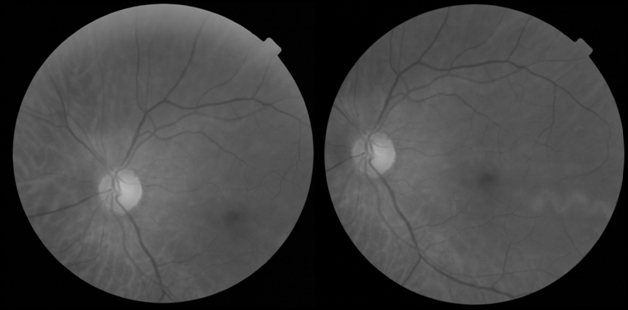
Fig. 1. Result of head and eye movement when scanning the retina.
The effect of zooming on the comparison of the retinas is not as critical as the effect of other parameters, since the position of the head and the eye is more or less fixed along the axis corresponding to the scale. In the case when scaling is still there, it is so small that it has almost no effect on the comparison of retinas. Thus, the main requirement for the algorithm is the resistance to rotation and displacement of the retina.
Retinal authentication algorithms can be divided into two types: those that use segmentation algorithms (algorithm based on phase correlation method; algorithm based on searching for branching points) and those that extract signs directly from the retina image (algorithm, using the corners of Harris).
The essence of the algorithm is that using the phase correlation method, the displacement and rotation of one image relative to another is estimated. After that, the images are aligned and the similarity index is calculated.
In the implementation, the phase correlation method works with binary images, however, it can also be used for images in 8-bit color space.
Let be and
and  - images, one of which is shifted to
  in relation to another, and
  and
and  - their Fourier transforms, then:
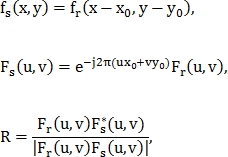
Where - cross spectrum;
 - complex conjugate
Calculating the inverse Fourier transform of the cross-spectrum, we obtain the momentum function:

Finding the maximum of this function, we find the desired offset.
Now find the angle of rotation with offset using polar coordinates:
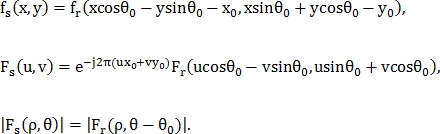
Next, the phase correlation method is applied, as in the previous case. It can be noted that such a modification of the phase correlation allows you to find the scale of the parameter
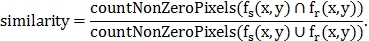
This technique does not always show good results in practice due to the presence of small noises and the fact that some of the vessels may be present on one image and absent on the other. To eliminate this, several iterations of this algorithm are used, including changing the order in which images are supplied to a function and the order in which offset and rotation are removed. At each iteration, the images are aligned, after which their similarity index is calculated, then the maximum similarity index is found, which will be the final result of the comparison.
The similarity index is calculated as follows:
This algorithm, unlike the previous one, does not require segmentation of the vessels, since it can determine the signs not only on the binary image.
At the beginning, the images are aligned using the phase correlation method described in the previous section. Then the images look for the corners of Harris (Fig. 2).
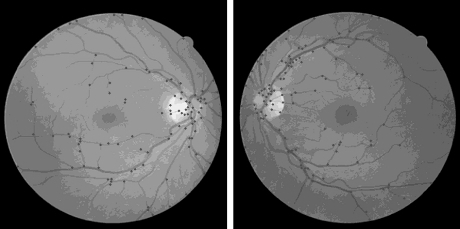
Fig. 2. Search result for Harris angles on retina images.
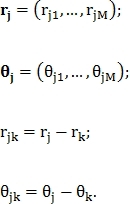
Let M + 1 point be found, then for each j-th point its Cartesian coordinates converted to polar
  and the feature vector is determined
  Where
Where
Model of similarity between unknown vector and feature vector
  size N at j is defined as follows:
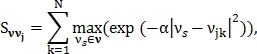
Where - constant, which is determined before the search for the corners of Harris.
Function describes the proximity and similarity of a vector to all signs of j.
Let the vector Is the feature vector of the first image, where K – 1, and vector
  Is the feature vector of the second image, where
  size J – 1, then the figure of similarity of these images is calculated as follows:
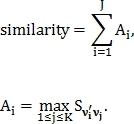
The normalization factor for similarity is
Coefficient in the original article it is proposed to determine by the following criterion: if the difference between the histograms of images is less than a predetermined value, then = 0.25, otherwise = 1.
This algorithm, like the previous one, looks for branching points in the blood vessel system. At the same time, it is more specialized in searching for bifurcation and intersection points (Fig. 3) and is much more resistant to noise, but it can only work on binary images.
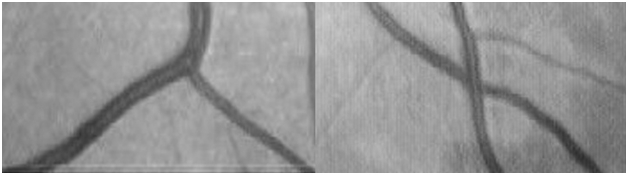
Fig. 3. Types of signs (on the left - the bifurcation point, on the right - the intersection point).
To search for points, as in Fig. 3, segmented vessels are compressed to a thickness of one pixel. Thus, it is possible to classify each point of the vessels by the number of neighbors S:
First, a pixel that is part of the vessel is searched from top to bottom, from left to right. It is assumed that each pixel of the vessel can have no more than two adjacent pixels of the vessels (previous and next), in order to avoid ambiguity in subsequent calculations.
Next, 4 neighboring pixels of the found point are analyzed, which have not yet been considered. This leads to 16 possible configurations (Fig. 4). If the pixel in the middle of the window does not have gray neighbors, as shown in fig. 4 (a), then it is discarded and another pixel of blood vessels is searched. In other cases, it is either the end point or internal (not including bifurcation points and intersections).
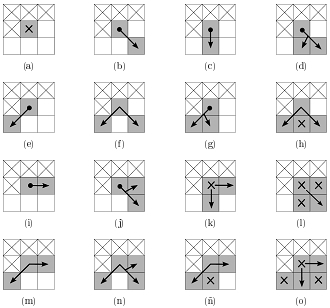
Fig. 4. 16 possible configurations of four neighboring pixels (white dots - background, gray - vessels). The top 3 pixels and one on the left have already been analyzed, therefore ignored. Gray pixels with a cross inside are also ignored. The points with the arrow inside are the points that can become the next central pixel. Pixels with a black dot inside are the end points.
At each step, the gray neighbor of the last pixel is marked as passed and selected by the next central pixel in the 3 x 3 window. The choice of such neighbor is determined by the following criterion: the best neighbor is the one with the largest number of unlabeled gray neighbors. Such a heuristic is due to the idea of maintaining a single-pixel thickness in the middle of the vessel, where a greater number of neighbors are gray.
From the above algorithm it follows that it leads to the separation of the vessels. Also, vessels can be separated at the stage of segmentation. Therefore it is necessary to connect them back.
To restore the connection between two nearby endpoints, the corners are defined and  as in fig. 5, and if they are less than a predetermined angle
  then the end points are combined.
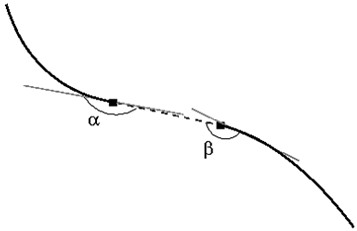
Fig. 5. Combining end points after compression.
To restore the bifurcation and intersection points (Fig. 6) for each end point, its direction is calculated, after which the fixed-length segment is expanded. If this extension intersects with another segment, then a bifurcation point or intersection is found.
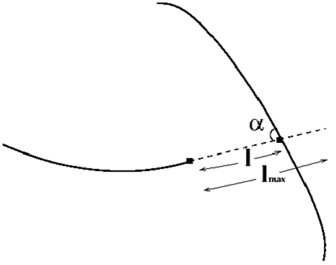
Fig. 6. Restoring the bifurcation point.
The intersection point is two bifurcation points, therefore, to simplify the task, you can only search for bifurcation points. To remove spurious surges caused by intersection points, you can discard points that are too close to another point found.
To find the points of intersection, additional analysis is needed (Fig. 7).
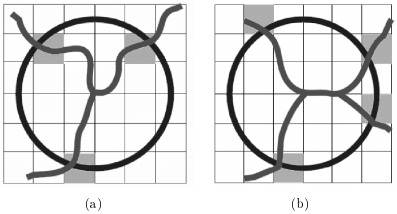
Fig. 7. Classification of branch points by the number of intersections of vessels with a circle. (a) Bifurcation point. (b) Point of intersection.
As seen in fig. 7 (b), depending on the length of the radius, the circle centered at the branching point may intersect with the blood vessels in either three or four points. Therefore, the branch point may not be correctly classified. To get rid of this problem, use the voting system shown in Fig. eight.
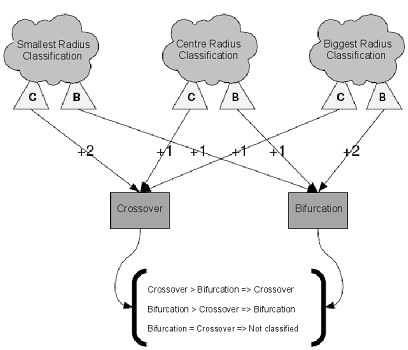
Fig. 8. Scheme for the classification of bifurcation points and intersections.
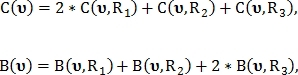
In this voting system, the branch point classified for three different radii
  by the number of intersections of a circle with blood vessels. Radii are defined as:
  Where
Where  and
and  take fixed values. This calculates two values.
  and
and  signifying the number of votes for that point was classified as an intersection point and as a bifurcation point, respectively:
Where and
and  - binary values indicating whether a point is identified using radius
  as a point of intersection or as a point of bifurcation, respectively.
If then point type not determined. If the values differ from each other, then
  point classified as an intersection point, otherwise as a bifurcation point.
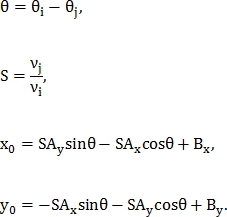
After the points are found, it is necessary to find a similarity transformation. This conversion is described by 4 parameters. - axis offset
  and
and  , scale and rotation respectively.
The transformation itself is defined as:
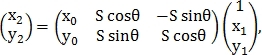
Where - coordinates of the point on the first image
 - on the second image
To find the similarity transformation, pairs of control points are used. For example, points define vector
 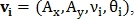 Where
Where  - coordinates of the beginning of the vector,
  - vector length and
  - vector direction. In the same way is determined by the vector
 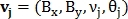 for points
  An example is shown in Fig. 9.
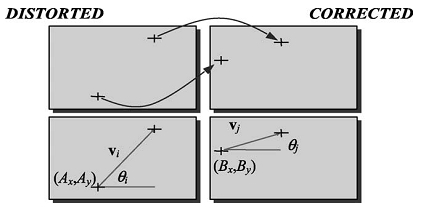
Fig. 9. An example of two pairs of control points.
Similarity transformation parameters are found from the following equalities:
Let the number of points found on the first image be M, and on the second N, then the number of pairs of control points in the first image is and on the second
  So we get
 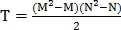 possible transformations, among which the correct one selects the one in which the number of matched points is greatest.
Since the value of the parameter S is close to unity, then T can be reduced by discarding pairs of points that do not satisfy the following inequality:
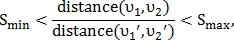
Where Is the minimum threshold for the parameter
 Is the maximum threshold for the parameter
 - a pair of control points from
 - a pair of control points from
After applying one of the possible alignment options for points and
and  the similarity index is calculated:
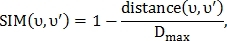
Where - threshold maximum distance between points.
If that
that 
In some cases, both points may have a good point like value . It happens when
  and
and  are close to each other. To determine the most appropriate pair, the probability of similarity is calculated:
Where

If a that
that 
To find the number of matching points, a matrix Q of size M x N is constructed so that the i-th row and j-th column contains
Then in the matrix Q a maximal nonzero element is sought. Let this element be contained in line and
  mth column then dots
  and
and  defined as matched, and row and column is reset. Then again the maximum element is searched. The search for such maxima is repeated until all the elements of the matrix Q are zero. At the output of the algorithm, we obtain the number of matched points C.
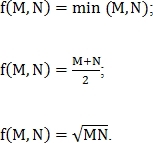
The metric of similarity of two retinas can be determined in several ways:
Where - the parameter that is entered to adjust the effect of the number of matched points;
f is selected by one of the following options:
Metrics normalized in one of two ways:
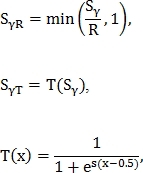
Where and  - some constants.
The method based on searching for branch points can be complicated by adding additional features, such as angles, as in Fig. ten.

Fig. 10. Angles formed by branching points as additional features.
You can also use the gamma code. As is known, modulo-2 addition is an absolutely strong cipher when the key length is equal to the text length, and since the number of bifurcation points and intersections does not exceed about 100, but still greater than the length of regular passwords, a combination of password hashes can be used as a key. This eliminates the need to store in the retina database and password hashes. It is necessary to store only the coordinates, encrypted with an absolutely strong cipher.
Retina authentication does show accurate results. The algorithm, based on the phase correlation method, did not make a single error when testing on the VARIA database. The algorithm was also tested on the unallocated MESSIDOR base in order to test the algorithm for false positives. All pairs of similar retinas found by the algorithm were checked manually. They really are the same. Comparing the blood vessels of two retinas from the VARIA base takes an average of 1.2 seconds on two cores of the Pentium Dual-CoreT4500 processor with a frequency of 2.30 GHz. The execution time of the algorithm turned out to be quite large for identification, but it is acceptable for authentication.
An attempt was also made to implement an algorithm that uses Harris angles, but failed to obtain satisfactory results. As in the previous algorithm, a problem arose in eliminating rotation and displacement using the phase correlation method. The second problem is related to the flaws in the Harris angle search algorithm. With the same threshold for screening points, the number of points found may be either too large or too small.
Future plans are to develop an algorithm based on the search for branch points. It requires much less computational resources in comparison with the algorithm based on the phase correlation method. In addition, there are opportunities for its complexity in order to minimize the likelihood of hacking the system.
Another interesting direction in further research is the development of automatic systems for the early diagnosis of diseases such as glaucoma, diabetes, atherosclerosis, and many others.
ps for a few requests I post a link to a project on a githaba.
To date, the technology of 3d printing has greatly reduced the price of retinal scanners. Andrew Bastavrus together with his team printed on the 3d printer a nozzle for a smartphone that allows you to observe the retina through the camera of the phone.
This article is devoted to the description of algorithms for matching signs of the retina and is a continuation of the article on segmentation of blood vessels.
')
An overview of biometric identification / authentication methods is provided here .
Ways to compare signs of retina
One of the most important problems when using the retina for recognition of personality is the movement of the head or the eye during scanning. Because of these movements, displacement, rotation and scaling may occur relative to the sample from the database (Fig. 1).
Fig. 1. Result of head and eye movement when scanning the retina.
The effect of zooming on the comparison of the retinas is not as critical as the effect of other parameters, since the position of the head and the eye is more or less fixed along the axis corresponding to the scale. In the case when scaling is still there, it is so small that it has almost no effect on the comparison of retinas. Thus, the main requirement for the algorithm is the resistance to rotation and displacement of the retina.
Retinal authentication algorithms can be divided into two types: those that use segmentation algorithms (algorithm based on phase correlation method; algorithm based on searching for branching points) and those that extract signs directly from the retina image (algorithm, using the corners of Harris).
1. Algorithm based on the phase correlation method
The essence of the algorithm is that using the phase correlation method, the displacement and rotation of one image relative to another is estimated. After that, the images are aligned and the similarity index is calculated.
In the implementation, the phase correlation method works with binary images, however, it can also be used for images in 8-bit color space.
Let be
and - images, one of which is shifted to in relation to another, and and - their Fourier transforms, then:Where
- cross spectrum; - complex conjugate Calculating the inverse Fourier transform of the cross-spectrum, we obtain the momentum function:
Finding the maximum of this function, we find the desired offset.
Now find the angle of rotation
with offset using polar coordinates:Next, the phase correlation method is applied, as in the previous case. It can be noted that such a modification of the phase correlation allows you to find the scale of the parameter
This technique does not always show good results in practice due to the presence of small noises and the fact that some of the vessels may be present on one image and absent on the other. To eliminate this, several iterations of this algorithm are used, including changing the order in which images are supplied to a function and the order in which offset and rotation are removed. At each iteration, the images are aligned, after which their similarity index is calculated, then the maximum similarity index is found, which will be the final result of the comparison.
The similarity index is calculated as follows:
2. Algorithm using Harris angles
This algorithm, unlike the previous one, does not require segmentation of the vessels, since it can determine the signs not only on the binary image.
At the beginning, the images are aligned using the phase correlation method described in the previous section. Then the images look for the corners of Harris (Fig. 2).
Fig. 2. Search result for Harris angles on retina images.
Let M + 1 point be found, then for each j-th point its Cartesian coordinates
converted to polar and the feature vector is determined WhereModel of similarity between unknown vector
and feature vector size N at j is defined as follows:Where
- constant, which is determined before the search for the corners of Harris.Function
describes the proximity and similarity of a vector to all signs of j.Let the vector
Is the feature vector of the first image, where K – 1, and vector Is the feature vector of the second image, where size J – 1, then the figure of similarity of these images is calculated as follows:The normalization factor for similarity is
Coefficient
in the original article it is proposed to determine by the following criterion: if the difference between the histograms of images is less than a predetermined value, then = 0.25, otherwise = 1.3. Algorithm based on searching for branch points
This algorithm, like the previous one, looks for branching points in the blood vessel system. At the same time, it is more specialized in searching for bifurcation and intersection points (Fig. 3) and is much more resistant to noise, but it can only work on binary images.
Fig. 3. Types of signs (on the left - the bifurcation point, on the right - the intersection point).
To search for points, as in Fig. 3, segmented vessels are compressed to a thickness of one pixel. Thus, it is possible to classify each point of the vessels by the number of neighbors S:
- if S = 1, then this is the end point;
- if S = 2, then this is an interior point;
- if S = 3, then this is a bifurcation point;
- if S = 4, then this is the intersection point.
3.1. Vessel compression algorithm to the thickness of one pixel and the classification of branching points
First, a pixel that is part of the vessel is searched from top to bottom, from left to right. It is assumed that each pixel of the vessel can have no more than two adjacent pixels of the vessels (previous and next), in order to avoid ambiguity in subsequent calculations.
Next, 4 neighboring pixels of the found point are analyzed, which have not yet been considered. This leads to 16 possible configurations (Fig. 4). If the pixel in the middle of the window does not have gray neighbors, as shown in fig. 4 (a), then it is discarded and another pixel of blood vessels is searched. In other cases, it is either the end point or internal (not including bifurcation points and intersections).
Fig. 4. 16 possible configurations of four neighboring pixels (white dots - background, gray - vessels). The top 3 pixels and one on the left have already been analyzed, therefore ignored. Gray pixels with a cross inside are also ignored. The points with the arrow inside are the points that can become the next central pixel. Pixels with a black dot inside are the end points.
At each step, the gray neighbor of the last pixel is marked as passed and selected by the next central pixel in the 3 x 3 window. The choice of such neighbor is determined by the following criterion: the best neighbor is the one with the largest number of unlabeled gray neighbors. Such a heuristic is due to the idea of maintaining a single-pixel thickness in the middle of the vessel, where a greater number of neighbors are gray.
From the above algorithm it follows that it leads to the separation of the vessels. Also, vessels can be separated at the stage of segmentation. Therefore it is necessary to connect them back.
To restore the connection between two nearby endpoints, the corners are defined
and as in fig. 5, and if they are less than a predetermined angle then the end points are combined.Fig. 5. Combining end points after compression.
To restore the bifurcation and intersection points (Fig. 6) for each end point, its direction is calculated, after which the fixed-length segment is expanded.
If this extension intersects with another segment, then a bifurcation point or intersection is found.Fig. 6. Restoring the bifurcation point.
The intersection point is two bifurcation points, therefore, to simplify the task, you can only search for bifurcation points. To remove spurious surges caused by intersection points, you can discard points that are too close to another point found.
To find the points of intersection, additional analysis is needed (Fig. 7).
Fig. 7. Classification of branch points by the number of intersections of vessels with a circle. (a) Bifurcation point. (b) Point of intersection.
As seen in fig. 7 (b), depending on the length of the radius, the circle centered at the branching point may intersect with the blood vessels in either three or four points. Therefore, the branch point may not be correctly classified. To get rid of this problem, use the voting system shown in Fig. eight.
Fig. 8. Scheme for the classification of bifurcation points and intersections.
In this voting system, the branch point
classified for three different radii by the number of intersections of a circle with blood vessels. Radii are defined as: Where and take fixed values. This calculates two values. and signifying the number of votes for that point was classified as an intersection point and as a bifurcation point, respectively:Where
and - binary values indicating whether a point is identified using radius as a point of intersection or as a point of bifurcation, respectively.If
then point type not determined. If the values differ from each other, then point classified as an intersection point, otherwise as a bifurcation point.3.2. Search for similarity transformation and definition of similarity metrics
After the points are found, it is necessary to find a similarity transformation. This conversion is described by 4 parameters.
- axis offset and , scale and rotation respectively.The transformation itself is defined as:
Where
- coordinates of the point on the first image - on the second image To find the similarity transformation, pairs of control points are used. For example, points
define vector Where - coordinates of the beginning of the vector, - vector length and - vector direction. In the same way is determined by the vector for points An example is shown in Fig. 9.Fig. 9. An example of two pairs of control points.
Similarity transformation parameters are found from the following equalities:
Let the number of points found on the first image be M, and on the second N, then the number of pairs of control points in the first image is
and on the second So we get possible transformations, among which the correct one selects the one in which the number of matched points is greatest.Since the value of the parameter S is close to unity, then T can be reduced by discarding pairs of points that do not satisfy the following inequality:
Where
Is the minimum threshold for the parameter Is the maximum threshold for the parameter - a pair of control points from - a pair of control points from After applying one of the possible alignment options for points
and the similarity index is calculated:Where
- threshold maximum distance between points.If
that In some cases, both points
may have a good point like value . It happens when and are close to each other. To determine the most appropriate pair, the probability of similarity is calculated:Where
If a
that To find the number of matching points, a matrix Q of size M x N is constructed so that the i-th row and j-th column contains
Then in the matrix Q a maximal nonzero element is sought. Let this element be contained in
line and mth column then dots and defined as matched, and row and column is reset. Then again the maximum element is searched. The search for such maxima is repeated until all the elements of the matrix Q are zero. At the output of the algorithm, we obtain the number of matched points C.The metric of similarity of two retinas can be determined in several ways:
Where
- the parameter that is entered to adjust the effect of the number of matched points;f is selected by one of the following options:
Metrics
normalized in one of two ways:Where
and - some constants.3.3. Additional algorithm complications
The method based on searching for branch points can be complicated by adding additional features, such as angles, as in Fig. ten.
Fig. 10. Angles formed by branching points as additional features.
You can also use the gamma code. As is known, modulo-2 addition is an absolutely strong cipher when the key length is equal to the text length, and since the number of bifurcation points and intersections does not exceed about 100, but still greater than the length of regular passwords, a combination of password hashes can be used as a key. This eliminates the need to store in the retina database and password hashes. It is necessary to store only the coordinates, encrypted with an absolutely strong cipher.
Conclusion
Retina authentication does show accurate results. The algorithm, based on the phase correlation method, did not make a single error when testing on the VARIA database. The algorithm was also tested on the unallocated MESSIDOR base in order to test the algorithm for false positives. All pairs of similar retinas found by the algorithm were checked manually. They really are the same. Comparing the blood vessels of two retinas from the VARIA base takes an average of 1.2 seconds on two cores of the Pentium Dual-CoreT4500 processor with a frequency of 2.30 GHz. The execution time of the algorithm turned out to be quite large for identification, but it is acceptable for authentication.
An attempt was also made to implement an algorithm that uses Harris angles, but failed to obtain satisfactory results. As in the previous algorithm, a problem arose in eliminating rotation and displacement using the phase correlation method. The second problem is related to the flaws in the Harris angle search algorithm. With the same threshold for screening points, the number of points found may be either too large or too small.
Future plans are to develop an algorithm based on the search for branch points. It requires much less computational resources in comparison with the algorithm based on the phase correlation method. In addition, there are opportunities for its complexity in order to minimize the likelihood of hacking the system.
Another interesting direction in further research is the development of automatic systems for the early diagnosis of diseases such as glaucoma, diabetes, atherosclerosis, and many others.
List of used sources and literature
- Reddy BS and Chatterji BN An FFT-Based Technique for Translation, Rotation, and Scale-Invariant Image Registration // IEEE Transactions on Image Processing. 1996. Vol. 5. No. 8. pp. 1266-1271.
- Human recognition based on retinal images and / / A. Dehghani [et al.] // EURASIP Journal on Image and Video Processing. 2013
- Hortas MO Automatic pattern for personal authentication using the retinal vessel as biometric pattern. PhD Thesis. Universidade da Coruña. La Coruña. 2009
- Varia database
- MESSIDOR database
ps for a few requests I post a link to a project on a githaba.
Source: https://habr.com/ru/post/261309/
All Articles