Hardcore old school: QEMU and reverse floppy image

On the eve of the “ face-to-face ” NeoQUEST-2015, which will take place tomorrow, July 2, at 11:00, in St. Petersburg, we are publishing a write-up of the last unsorted job of the online stage!
We remind you that the entrance to the event is free, and we are waiting for everyone who is interested in information security! NeoQUEST is a chance to learn something new, improve your “hacker” skills, communicate with colleagues, watch the decisive competition of the best hackers, and just have a great time!
You can read more about the venue and topics of the NeoQUEST-2015 reports here and there .
')
The task of the online stage, left “for dessert”, was quite old-school: it is enough that it was a dump of all the long-forgotten floppy disk! How the participants of the quest had to tinker with the reverse and with QEMU - under the cut!
What to do with the source data for the task?
In a task, the task.bin file acts as the source data. According to the legend, this should be an image of a boot floppy. Let's try to feed it to the file utility.

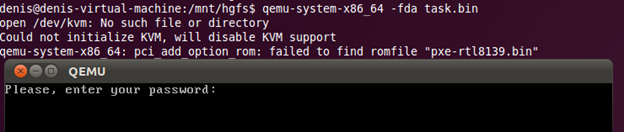
The assumption was true, it is a floppy disk. Well, let's try to boot from it. As a virtual machine, we use QEMU. Will execute
qemu –fda task.bin and ...
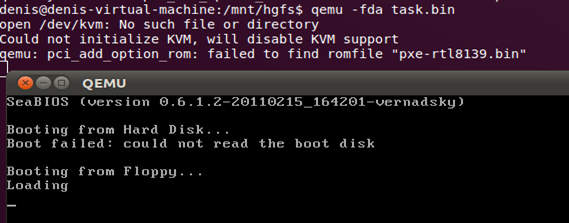
… and nothing. For some reason, it failed to load - QEMU wrote “Loading” and hung. First, let's try to see what happens inside the virtual machine by connecting gdb to it as a debugger. To connect gdb, it is important to know the operating mode of the virtual machine, since this affects the format of the data transferred from the application to the debugger.
Virtual machine: a view from the inside
Go to the QEMU window and press Ctrl + Alt + 2 to open the command console. Perform the “info registers” in it and scroll up with the Ctrl + Up combination.
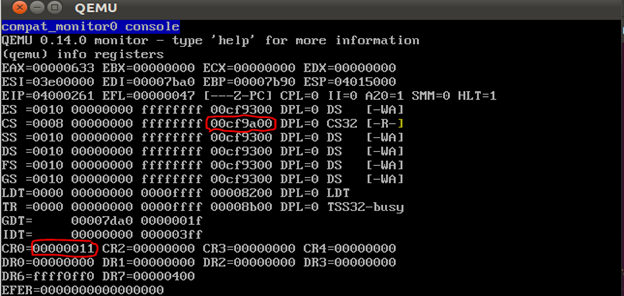
The picture above outlines the fields you should pay attention to - CR0 and the attributes of the descriptor pointed to by CS. From the values of CR0 and CS.ATTR, it follows that the protected mode is turned on without virtual memory and a 32-bit code is executed. For us, this means that in gdb you need to switch the mode with the command
set architecture i386 In case gdb is 32bit, this architecture is set by default.
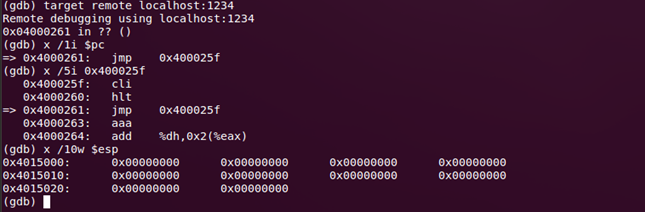
Run QEMU with the “–s” option (this option allows you to connect a debugger) and enable gdb by running the command “target remote localhost: 1234”. Let's output several instructions around EIP, and see that the virtual machine is in HALT, with zeroes on the stack. It is completely incomprehensible where we got here? It seems to have to disassemble.
Disassembling and debugging code
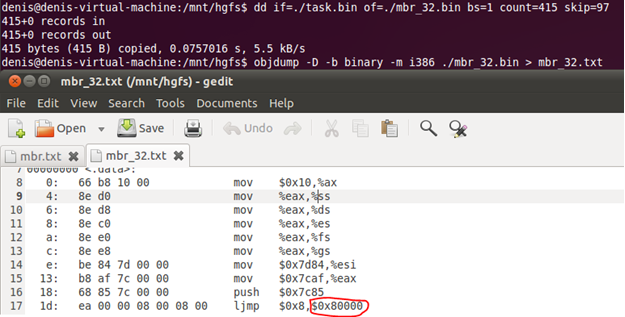
Let's try to figure out where the jump takes place in HALT, consistently disassembling and debugging the code! Let's start with the first sector of the floppy disk. When booting from floppy in legacy mode (and otherwise, it probably won't work), the BIOS reads the first sector and loads it at 0x7c00. Most often, the task of the code from the first sector is to load the “continuation” from the disk and switch to protected mode. Let's see what the code is there, using the dd and objdump utilities.
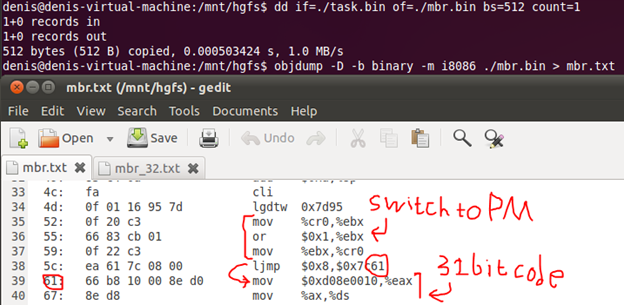
After a little flipping through the code from the beginning, you can notice the transition to protected mode. The ljmp instruction here is used to change the code selector, the transition address is 0x7c61. Since I did not specify a base equal to 0x7c00 when disassembling, in my listing 0x7c61 corresponds to 0x61.
This is usually done in order to start executing 32bit code. Additionally, you can verify this by finding the gdt structure, whose address is in the gdtr register, whose value lies at 0x7d95 and is loaded with the lgdtw instruction at 0x7c4d (0x4d in our listing).
In gdt, you need to look at the type of the descriptor with an offset of 8; this is the first argument to the ljmp instruction. This means that the code at the address 0x7c61 is 32bit, and therefore, it is necessary to disassemble the objdump with other parameters. Select the code of interest from the task.bin by offset 0x61 and disassemble it as 32bit.
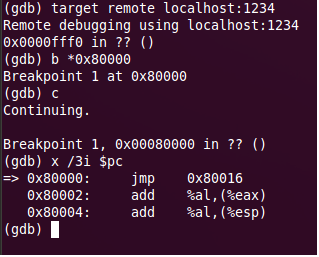
In the resulting code, new values are loaded into the selectors, and a jump occurs to the address 0x80000. We will start the virtual machine and set breakpoint to this address. To do this, QEMU starts with the command
qemu –s –S –fda task.bin gdb connects the way it was done before. Set breakpoint to address - “b * 0x80000” in gdb, continue - “c”. After the breakpoint has been triggered, we will display several instructions.
Perform the first jmp with the “si” command and again display the code for execution.
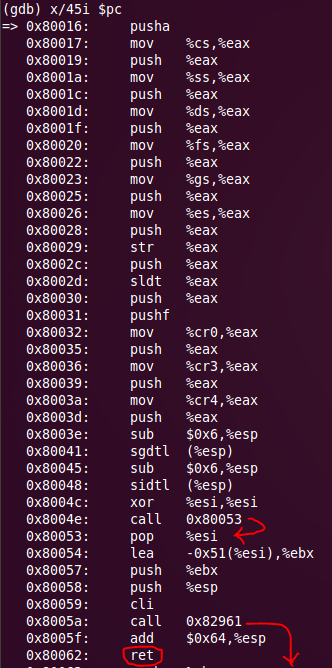
The code before the first ret is not rich in branching, and there is only one call in which something can occur. Let's take 4K of memory at 0x82961, and see what code is executed there. A memory dump can be obtained from gdb with the following command:

Disassemble the resulting dump command
objdump –D –b binary –m i386 ./eip_dump.bin > eip.txt The function at 0x82961 contains quite a lot of calls, but is itself a sequential piece of code with one ret at the end. We are interested in where we get to halt, and since there is no halt in the visible code, we set breakpoints on all the call'y and ret at the end of the function.
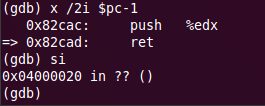
Here is a list of addresses of interest: 0x82970, 0x82aef, 0x82A5B, 0x82A7D, 0x82A91, 0x82AB0, 0x82AEF, 0x82B10, 0x82B32, 0x82B46, 0x82B65, 0x82C53, 0x82CAD. Further we will continue execution, consistently falling out on each set breakpoint. We are interested in breakpoint, after which there will be a hangup. It is a breakpoint set to ret - at the end of the function under study. This is unexpected, but if you pay attention to push before ret, it becomes clear that this is not a return to the dial peer, but a transfer of control to the new code. Perform si and get to the address 0x4000020.
Hurray, finally we launched the task!
As we remember, the halt instruction is located at 0x4000260, which is already much closer to the current eip. In order not to look for calls again and not to set breakpoints with our hands, let's do the following: we will write a simple script that will execute one instruction in a loop, print the next one and check that eip! = 0x4000260. The script looks like this:
b *0x4000020 commands 1 while $pc != 0x4000260 x /1i $pc si end x /1i $pc end c Place the script in the script.txt file and execute it in gdb with the source command. After the execution we get the following:
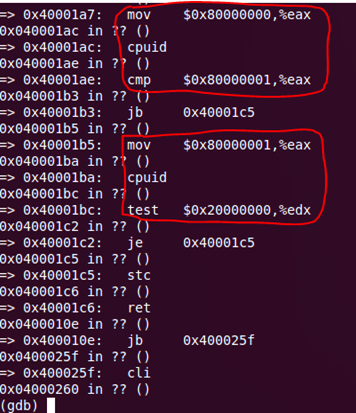
Two cpuid calls are apparent in the code, after which there is a hangup. It seems that this is some kind of check. We will understand what they check. The first call is made with the parameter eax = 0x80000000, as a result, eax contains the maximum value of the parameter that can be passed to cpuid instructions. Next, the value is compared with 0x80000001, this is a test for the ability to make the next call. The second call is performed with the eax = 0x800000001 parameter, and the 29th edx bit is checked, which is set to 1 if Long Mode is supported.
It seems that the virtual machine hangs because QEMU, which I run, does not support Long Mode. Let's start the virtual machine as follows:
Hooray, we managed to start the task! The case remains for a little - execute it! In general, the problem described above with the hang would not have happened if the linux in which we work was 64-bit. In this case, we are just not lucky with the capacity of the system.
Password selection
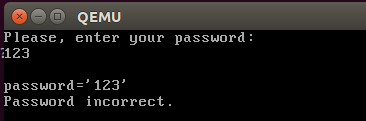
Having reached the task itself, it becomes clear what needs to be done. Apparently, you need to pick up the "password", which would satisfy the checking algorithm. To do this, find the place where the password is checked.
We will try to stop the execution of the virtual machine as close as possible to checking the password. You may notice that before the error message is displayed, the entered password is printed on the fourth line. Most likely, by this time the verification has not yet been completed, so, having fallen out of the debugger in this place, we will find ourselves with a password already entered, which has not yet passed the verification. It will remain up the stack to the function in which the display of the password on the screen and its verification are called in sequence.
How to determine where to put a breakpoint in the code in order to get to the right place? Printing a symbol on the screen is possible in two ways:
- A simple way is to write a symbol to video memory at 0xb8000 in text mode, which is enabled by default at startup.
- A difficult way is to write a driver that would set up a video card and provide the function of drawing a point on the screen, and then, using fonts, draw a character point by point. Instead of the driver, you can use the VBE BIOS, as it is done here .
Suppose a simple method was used. Then we can put a breakpoint on the access to the video memory, namely, to the first character of the fourth line. Video memory starts with the address 0xb8000, the line size is 80 characters, for each character there are 2 bytes (symbol + color), the required address is 0xb8000 + 80 * 2 * 3 = 0xb81e0. The command to set a breakpoint for writing to gdb memory will look like this:
watch *0xb81e0 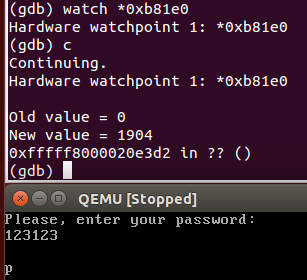
The assumption was true, we fell out immediately after writing the character to memory. Breakpoint is no longer needed, you can delete it. We make one more assumption - suppose that there is a function in which the printing and password verification code is sequentially called. Then the source code should look like this:
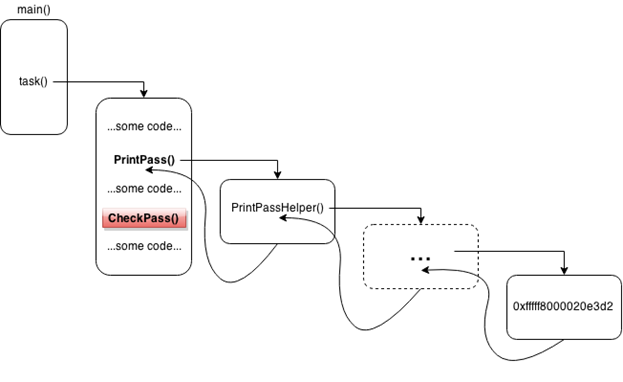
Our goal is to find the CheckPass () function. To do this, we will set breakpoints to return addresses from the functions nested in PrintPass (), and continue execution. If the breakpoint has just fallen out, and the message “Password incorrect.” Has not yet been printed, then we put a new one and continue.
If it is printed, then the last but one set and we needed it - it stood right after the call to PrintPass () in the body of task (). We will understand how to get the return address. If the code was compiled without specific flags, then at the beginning of the function with a couple of instructions “push $ rbp; mov $ rsp, $ rbp ”formed a new stack frame. In this case, the return address is stored at $ rbp + 8. It's easy to check:
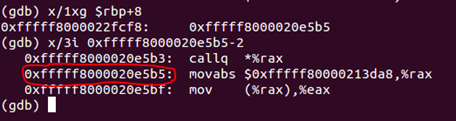
Indeed, before the address 0xfffff8000020e5b5 there is an instruction call. Now we can carry out our plans.
We write a script
Since it is unknown what the depth of the stack is, we will write a small script for gdb that will go up the stack until QEMU starts typing on the “Password incorrect” screen.
set confirm off # save start values of first 4 chars from 5th row of screen set $start_vmem_val = *(unsigned long long*)(0xb8280) set $curr_vmem_val = $start_vmem_val # if nothing changed in 5th row of screen, we continue while $start_vmem_val == $curr_vmem_val # delete all old breakpoints d # get return addres from stack and set breakpoint on it. Then, continue. set $ret_addr = *(unsigned long long*)($rbp + 8) b *$ret_addr c set $curr_vmem_val = *(unsigned long long*)(0xb8280) end Save the script to a file and execute the command source, as already done before. We get the following:
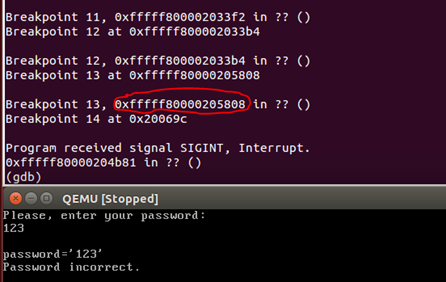
The script is frozen, never getting into breakpoint at 0x20069c, but the message “Password incorrect” is printed. This means that the assumption about the existence of a function that we called task () is true. The hang indicates that the task () function never returns after the “Password incorrect” message is printed to the screen. However, this is not important, the main thing is that we now know the return address from the PrintPass () function, to which we put the last but thirteenth breakpoint.
The search continues ...
Let's continue the search for the password verification procedure from the newly received address 0xfffff80000205808: run QEMU, set a breakpoint at this address and enter an arbitrary password. We'll dump the code by stepping back a few bytes from the RIP to find out the address of the function we just left.
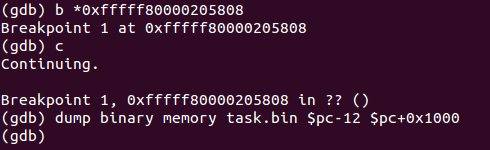
Disassemble the resulting dump with the command “objdump –D –b binary –m i386: x86-64 –adjust-vma = 0xfffff800002057fc task.bin> task.txt”.
Note that we have just left the function at 0xfffff80000203358, and this address is found several times in the received dump.
fffff800002057fc <.data>:
fffff800002057e3: 48 8d 85 60 ff ff ff lea -0xa0 (% rbp),% rax
fffff800002057ea: 48 89 c6 mov% rax,% rsi
fffff800002057ed: 48 bf 56 15 21 00 00 movabs $ 0xfffff80000211556,% rdi
fffff800002057f4: f8 ff ff
fffff800002057f7: b8 00 00 00 00 mov $ 0x0,% eax
fffff800002057fc: 48 ba 58 33 20 00 00 movabs $ 0xfffff80000203358,% rdx
fffff80000205803: f8 ff ff
fffff80000205806: ff d2 callq *% rdx
rip => fffff80000205808: 48 b8 08 15 21 00 00 movabs $ 0xfffff80000211508,% rax
fffff8000020580f: f8 ff ff
...
fffff80000205930: 48 bf 65 15 21 00 00 movabs $ 0xfffff80000211565,% rdi
fffff80000205937: f8 ff ff
fffff8000020593a: b8 00 00 00 00 mov $ 0x0,% eax
fffff8000020593f: 48 ba 58 33 20 00 00 movabs $ 0xfffff80000203358,% rdx
fffff80000205946: f8 ff ff
fffff80000205949: ff d2 callq *% rdx
...
fffff8000020594d: 48 bf 78 15 21 00 00 movabs $ 0xfffff80000211578,% rdi
fffff80000205954: f8 ff ff
fffff80000205957: b8 00 00 00 00 mov $ 0x0,% eax
fffff8000020595c: 48 ba 58 33 20 00 00 movabs $ 0xfffff80000203358,% rdx
fffff80000205963: f8 ff ff
fffff80000205966: ff d2 callq *% rdx
The considered code is 64-bit and there are two main conventions of calls used in a 64-bit code:
In this case, System V is used, since the arguments for call are passed through the RDI, RSI, RDX registers, etc. We have just exited a function that, at a minimum, displayed text, and this function is called several times. The first time it is called with the arguments 0xfffff80000211556 and -0xa0 (% rbp), the second time with 0xfffff80000211565, the third time with 0xfffff80000211578. Let's see what is at these addresses.

The function 0xfffff80000203358 is printf, and, depending on the result of the check, it displays different messages. The string "123" is the entered password. Let's see, depending on what messages are displayed.
fffff8000020591c: movabs $ 0xfffff800002114c0,% rax
fffff80000205926: mov 0x38 (% rax),% rax
fffff8000020592a: cmp $ 0x1,% rax if (g_struct.res == 1)
, ==== <fffff8000020592e: jne 0xfffff8000020594d {
| fffff80000205930: movabs $ 0xfffff80000211565,% rdi
| fffff8000020593a: mov $ 0x0,% eax
| fffff8000020593f: movabs $ 0xfffff80000203358,% rdx
| fffff80000205949: callq *% rdx printf (“Password correct!”);
| , == <fffff8000020594b: jmp 0xfffff80000205968}
`====> fffff8000020594d: movabs $ 0xfffff80000211578,% rdi else
| fffff80000205957: mov $ 0x0,% eax {
| fffff8000020595c: movabs $ 0xfffff80000203358,% rdx
| fffff80000205966: callq *% rdx printf (“Password incorrect.”);
`==> fffff80000205968: movabs $ 0xfffff80000204b83,% rax}
fffff80000205972: callq *% rax some_func ();
fffff80000205974: leaveq
fffff80000205975: retq
The result of the check is stored in the structure at address 0xfffff800002114c0 with an offset of 0x38. Let's see if there are any calls to this structure in the function in question.
fffff8000020587c: mov $ 0x48,% edx
fffff80000205881: mov $ 0x0,% esi
fffff80000205886: movabs $ 0xfffff800002114c0,% rdi
fffff80000205890: movabs $ 0xfffff80000203d40,% rax
fffff8000020589a: callq *% rax memset (& g_struct, 0, 0x48);
fffff8000020589c: lea -0xa0 (% rbp),% rdx
fffff800002058a3: movabs $ 0xfffff800002114c0,% rax
fffff800002058ad: mov% rdx, (% rax) * (u64 *) & g_struct = password;
fffff800002058b0: lea -0xa0 (% rbp),% rdx
fffff800002058b7: movabs $ 0xfffff800002114c0,% rax
fffff800002058c1: mov% rdx, 0x20 (% rax) * ((u64 *) & g_struct + 4) = password;
Above the code is a function call with three arguments, one of which is a pointer to our structure. If you refer to the code of this function, it becomes clear that this is a memset. A pointer to the string with the entered password, at offset 0 and 32 (0x20), is written twice to the structure. Apparently, this is initialization. If you look at the code between initialization and checking the result, we will see the following:
; above is the initialization of the g_struct structure
fffff800002058c5: movzbl -0x1 (% rbp),% eax l_var1 = -0x1 (% rbp);
fffff800002058c9: mov% rax,% rdi
fffff800002058cc: movabs $ 0xfffff80000203e94,% rax
fffff800002058d6: callq *% rax if (func1 (l_var1))
fffff800002058d8: test% rax,% rax {
fffff800002058db: sete% al
fffff800002058de: test% al,% al
, ==== <fffff800002058e0: je 0xfffff80000205909
| fffff800002058e2: movabs $ 0xfffff80000211508,% rax asm (
| fffff800002058ec: mov (% rax),% rax push * 0xfffff80000211508
| fffff800002058ef: mov% rax,% rdx retq
| fffff800002058f2: push% rdx);
| fffff800002058f3: retq
| fffff800002058f4: movzbl -0x1 (% rbp),% eax
| fffff800002058f8: mov% rax,% rdi
| fffff800002058fb: movabs $ 0xfffff800002040b2,% rax
| fffff80000205905: callq *% rax func2 (l_var1);
| , == <fffff80000205907: jmp fffff8000020591c}
`====> fffff80000205909: movzbl -0x1 (% rbp),% eax else
| fffff8000020590d: mov% rax,% rdi {
| fffff80000205910: movabs $ 0xfffff800002040b2,% rax
| fffff8000020591a: callq *% rax func2 (l_var1);
`==> fffff8000020591c: movabs $ 0xfffff800002114c0,% rax}
; below is the test and output
Yellow highlighted branches in the code, which may be code verification password. The push / ret construction looks somewhat strange in the middle of the code, since it is not clear how execution will continue after it. We are still looking for a password verification feature.
Functions at addresses 0xfffff800002040b2 and 0xfffff80000203e94 do not use the entered password and do not access the found structure. Of interest is a pair of instructions push, retq, through which the jump to the address 0xfffff80000600000 occurs, but if you try to see what the code is at this address, we will see the following:

When you try to execute it, a transition occurs to the address 0xfffff80000209ac5. Why it happens? The memory access error message suggests that virtual memory is not available at this address. This can be checked by running “info mem” in the QEMU console.
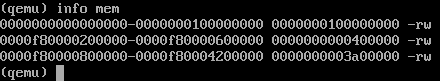
And indeed, the 2 megabyte range from the address 0xf80000600000 is not zamaplen. Do not be confused by the fact that the top 4 digits are zero, not f - when translating virtual addresses in 64-bit mode, the top 16 bits are not used, and the address 0x0 is equal to the address 0xfffff00000000000. When accessing an unplugged address, #PF (page fault) occurs, the problem address is written to CR2, control is transferred to the appropriate exception handler, which in our case is located at 0xfffff80000209ac5. The accuracy of this assumption can be verified once again by looking at the value of the CR2 register in the QEMU console — it is equal to 0xfffff80000600000.
We carefully look at the code
In the interrupt handler, the state is saved at the beginning, and the first C code appears at 0xfffff8000020da3c. It has an interesting place:
...
0xfffff8000020da5b: cmp $ 0xe,% rax
0xfffff8000020da5f: jne 0xfffff8000020da95
0xfffff8000020da61: mov -0x18 (% rbp),% rax
0xfffff8000020da65: mov 0xb8 (% rax),% rdx
0xfffff8000020da6c: movabs $ 0xfffff80000211508,% rax
0xfffff8000020da76: mov (% rax),% rax
0xfffff8000020da79: cmp% rax,% rdx
0xfffff8000020da7c: jb 0xfffff8000020da95
0xfffff8000020da7e: mov -0x18 (% rbp),% rax
0xfffff8000020da82: mov% rax,% rdi
0xfffff8000020da85: movabs $ 0xfffff80000204df8,% rax
0xfffff8000020da8f: callq *% rax
...
Comparing with 0xe ( #PF ) is very similar to checking the cause of the exception that has occurred, and at 0xfffff80000211508 lies the value 0xfffff80000600000, with which another comparison takes place. If both conditions are met, then a call to the address 0xfffff80000204df8 occurs. There we can see the following code:
...
0xfffff80000204e19: movabs $ 0xfffff8000020fda0,% rax
0xfffff80000204e23: lea (% rdx,% rax, 1),% rax
0xfffff80000204e27: mov (% rax),% rdx
0xfffff80000204e2a: mov% rdx, -0x50 (% rbp)
0xfffff80000204e2e: mov 0x8 (% rax),% rdx
0xfffff80000204e32: mov% rdx, -0x48 (% rbp)
0xfffff80000204e36: mov 0x10 (% rax),% rax
0xfffff80000204e3a: mov% rax, -0x40 (% rbp)
0xfffff80000204e3e: mov -0x50 (% rbp),% rax
0xfffff80000204e42: cmp $ 0x726574,% rax
0xfffff80000204e48: je 0xfffff80000205418
0xfffff80000204e4e: cmp $ 0x726574,% rax
0xfffff80000204e54: ja 0xfffff80000204ea4
0xfffff80000204e56: cmp $ 0x69667a,% rax
0xfffff80000204e5c: je 0xfffff80000205067
0xfffff80000204e62: cmp $ 0x69667a,% rax
0xfffff80000204e68: ja 0xfffff80000204e87
0xfffff80000204e6a: cmp $ 0x616464,% rax
0xfffff80000204e70: je 0xfffff80000205225
...
A significant part of the function is taken by a couple of cmp / je instructions, the abundance of which suggests that there was a long switch / case in the C code, where each value had its own handler. The 8-byte value, readable at 0xfffff8000020fda0 with a certain offset, acts as a compared one.
If you put a break point on this code, you can see that it is executed repeatedly and the offset is always a multiple of 24 m. It looks like a virtual machine with an instruction length of 24 bytes, where the first 8 bytes are the instruction signature, and the remaining 16 are the parameters. We will dump the memory at 0xfffff8000020fda0 with the command “dump memory vmcode.bin 0xfffff8000020fda0 0xfffff80000210da0” and open it in the hex editor (Okteta turned out to be on my hands).
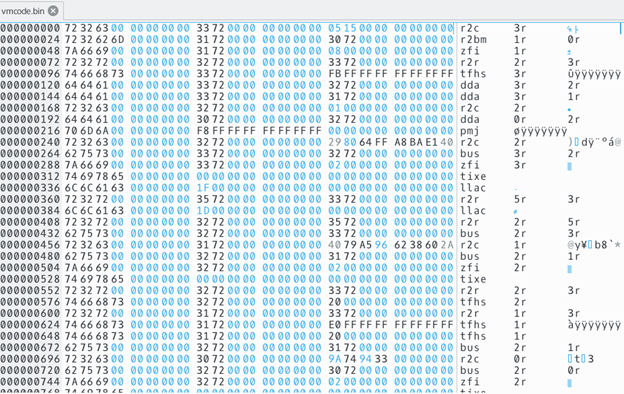
The right side of the figure clearly shows that instruction signatures are encoded as combinations of ASCII characters. Among the instructions there are such as llac, tixe, bus, which suggests that we see them upside down. This is due to the fact that they were written in C code as a value in single quotes stored in little-endian. The parameters of the instructions are either the values of r0, r1, ..., etc., or numbers.
Got to the virtual machine code!
In principle, having reached the virtual machine code, disassembling it is a matter of technology. Signatures of instructions clearly hint at how they work, and if something needs to be clarified, it suffices to find the appropriate handler in the function at 0xfffff80000204df8. In pseudocode, the VM code looks like this:
r3 = 5381; while (1) { r1 = *(u8*)r0; if (r1 == 0) break; r3 = r3 * 33 + r1; } // check DJB hash if (r3 != 0x40e1baa8ff648029) { return 0; } r5 << 64 + r3 = (u128)hexstr2val(r4) if (r5 - r3 != 0x2a60386296a57940) { return 0; } r2 = r3 >> 32; r1 = (r3 << 32) >> 32; if (r2 - r1 != 0x3394749a) { return 0; } r2 = (r3 << 32) >> 48; r1 = (r3 << 48) >> 48; if (r2 - r1 != 0x465e) { return 0; } return 1; // success After checking the DJB hash from the entered string, there are additional conditions that the key must satisfy.
Sample program for the selection of key
The key is not present in the checks explicitly, but based on 4 conditions in the pseudocode, it can be quickly picked up. Below is an example of a program that selects the right key.
int main(int argc, char **argv) { unsigned long long d64 = 0x2a60386296a57940; unsigned long long d32 = 0x3394749a; unsigned long long d16 = 0x465e; unsigned long long step = 0x1000100010001; unsigned long long key_l = ((d32 << 32) + (d16 << 48)) + ((d16 << 16) + 0); unsigned long long key_h = key_l + d64; std::stringstream key_ss; unsigned int i = 0; while (1) { key_ss << std::hex << key_h; key_ss << std::hex << std::setw(16) << std::setfill('0') << key_l; unsigned long long key_str_hash = djb2_hash(key_ss.str().c_str()); if (key_str_hash == 0x40e1baa8ff648029) { std::cout << "Success! " << i << "\n"; std::cout << "res_key = '" << key_ss.str() << "'\n"; } key_h += step; key_l += step; i++; key_ss.str(""); } return 0; } P ! , , .
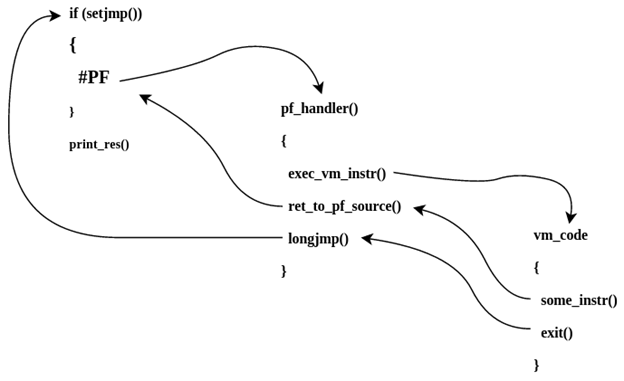
VM #PF, VM, exit, longjmp, #PF. . VM, #PF, .
: , IDA, (, , ), , , , . - IDA 64 .
radare2, , , , rasm “movabs $0xfffff800002114c0,%rax”, , (bin.laddr), 4Gb. - , radare2 , . objdump, gdb $EDITOR.
NeoQUEST-2015?
7 , 8 ( — 10:00)! , , . 18:00 , — , «» «» . !
Source: https://habr.com/ru/post/261081/
All Articles