Linux Profiling Mechanisms
The last couple of years I have been writing under the Linux kernel and often see how people suffer from the ignorance of long-standing, generally accepted and (almost) convenient tools. For example, once we debugged the network at the next reincarnation of our device and tried to understand what
In the Linux kernel such mechanisms 3:
- tracepoints
- kprobes
- perf events
Based on these 3 kernel features, absolutely all profilers and tracers are built that are available for Linux, including
ftrace , perf , SystemTap , ktap and others. In this article I will tell you what they (mechanisms) give, how they work, and next time we will look at specific tools.')
Kernel tracepoints
Kernel tracepoints is a kernel tracing framework, made through static code instrumentation. Yes, you understood correctly, most of the important functions of the kernel (network, memory management, scheduler) are statically instrumented. On my kernel, the number of tracepoints is:
  [etn] $ perf list tracepointt |  wc -l
   1271
Among them are kmalloc:
  [etn] $ perf list tracepoint |  grep "kmalloc"
   kmem: kmalloc [Tracepoint event]
And this is how it actually looks like in the nuclear function
__do_kmalloc : /** * __do_kmalloc - allocate memory * @size: how many bytes of memory are required. * @flags: the type of memory to allocate (see kmalloc). * @caller: function caller for debug tracking of the caller */ static __always_inline void *__do_kmalloc(size_t size, gfp_t flags, unsigned long caller) { struct kmem_cache *cachep; void *ret; cachep = kmalloc_slab(size, flags); if (unlikely(ZERO_OR_NULL_PTR(cachep))) return cachep; ret = slab_alloc(cachep, flags, caller); trace_kmalloc(caller, ret, size, cachep->size, flags); return ret; } trace_kmalloc is tracepoint.Such tracepoints write output to a debug ring buffer, which can be viewed in / sys / kernel / debug / tracing / trace:
  [~] # mount -t debugfs none / sys / kernel / debug
 [~] # cd / sys / kernel / debug / tracing /
 [tracing] # echo 1> events / kmem / kmalloc / enable
 [tracing] # tail trace
 bash-10921 [000] .... 1127940.937139: kmalloc: call_site = ffffffff8122f0f5 ptr = ffff8800aaecb900 bytes_req = 48 bytes_alloc = 64 gfp_flags = GFP_KERNEL
 bash-10921 [000] .... 1127940.937139: kmalloc: call_site = ffffffff8122f084 ptr = ffff8800ca008800 bytes_req = 2048 bytes_alloc = 2048 gfp_flags = GFP_KERNEL | GFP_NOWARN | GFP_NORETRY
 bash-10921 [000] .... 1127940.937139: kmalloc: call_site = ffffffff8122f084 ptr = ffff8800aaecbd80 bytes_req = 64 bytes_alloc = 64 gfp_flags = GFP_KERNEL | GFP_NOWARN | GFP_NORETRY
 tail-11005 [001] .... 1127940.937451: kmalloc: call_site = ffffffff81219297 ptr = ffff8800aecf5f00 bytes_req = 240 bytes_alloc = 256 gfp_flags = GFP_KERNEL | GFP_ZERO
 tail-11005 [000] .... 1127940.937518: kmalloc: call_site = ffffffff81267801 ptr = ffff880123e8bd80 bytes_req = 128 bytes_alloc = 128 gfp_flags = GFP_KERNEL
 tail-11005 [000] .... 1127940.937519: kmalloc: call_site = ffffffff81267786 ptr = ffff880077faca00 bytes_req = 504 bytes_alloc = 512 gfp_flags = GFP_KERNEL
Note that trasepoint “kmem: kmalloc”, like everyone else, is turned off by default, so you need to turn it on by saying 1 to its
enable file.You can write a tracepoint for your own kernel module. But,
CONFIG_MODULE_SIG enabled (almost always yes) and no private key for the signature (it is in the kernel vendor of your distribution). See heartbreaking details in lkml [1] , [2] .In short, tracepoints are a simple and lightweight thing, but using it is inconvenient and not recommended - use
ftrace or perf .kprobes
If tracepoints are tags of static instrumentation, then
kprobes is a mechanism for dynamic instrumentation of the code. With kprobes, you can interrupt the execution of a nuclear code anywhere , call your handler, do what you want in it and go back as if nothing had happened.How this is done: you write your own kernel module in which you register a handler for a specific kernel symbol (read, function) or any address in general.
It works like this:
- We make our own kernel module, in which we write our handler.
- We register our handler at some address A, whether it is just an address or
some function. - The kprobe subsystem copies the instructions to the address, A, and replaces them with the CPU trap (
int 3for x86). - Now, when the execution of the code reaches address A, an exception is generated, by which the registers are saved, and control is passed to the exception handler, which eventually becomes kprobes .
- The kprobes subsystem looks at the address of the exception, finds who was registered at address A, and calls our handler.
- When our handler finishes, the registers are restored, the saved instructions are executed, and execution continues.
There are 3 types of kprobes in the core:
- kprobes is a “baseline” probe that allows you to interrupt any part of the core.
- jprobes - jump probe, is inserted only at the beginning of the function, but it gives a convenient mechanism for accessing the arguments of the interrupted function for our handler. It also does not work at the expense of trap'ov, but through
setjmp/longjmp(hence the name), that is, more lightweight. - kretprobes - return probe, is inserted before exiting the function and gives convenient access to the result of the function.
With kprobes, we can trace anything, including the code of third-party modules. Let's do this for our miscdevice driver. I want to know that
In my miscdevice driver, the function looks like this:
  ssize_t etn_write (struct file * filp, const char __user * buf,
           size_t count, loff_t * f_pos)
I wrote a simple jprobe module that writes the number of bytes and offset to the kernel log.
  root @ etn: ~ # tail -F /var/log/kern.log
 Jan 1 00:00:42 etn kernel: [42.923717] ETN JPROBE: jprobe_init: 46: Planted jprobe at bf00f7a8, handler addr bf071000
 Jan 1 00:00:43 etn kernel: [43.194840] ETN JPROBE: trace_etn_write: 23: Writing 2 bytes at offset 4
 Jan 1 00:00:43 etn kernel: [43.201827] ETN JPROBE: trace_etn_write: 23: Writing 2 bytes at offset 4
In short, the thing is powerful, but it is not very convenient to use: there is no access to local variables (only through the indent from
ebp ), you need to write a kernel module, debug, load Perf events
Immediately I will say that you should not confuse “perf events” and the
perf program - you will be told about the program separately.“Perf events” is the meter access interface in the PMU (Performance Monitoring Unit), which is part of the CPU. Thanks to these metrics, you can easily ask the core to show you how many misses in the L1 cache, no matter what your architecture, whether it is ARM or amd64. True, your processor should have support in the kernel :-) Relatively relevant information on this subject can be found here .
To access these counters, as well as a huge pile of other good, the
perf program was written. With its help, you can see which iron events are available to us.X86 example
  $ perf list pmu hw sw cache
   branch-instructions OR cpu / branch-instructions / [Kernel PMU event]
   branch-misses OR cpu / branch-misses / [Kernel PMU event]
   bus-cycles OR cpu / bus-cycles / [Kernel PMU event]
   cache-misses OR cpu / cache-misses / [Kernel PMU event]
   cache-references OR cpu / cache-references / [Kernel PMU event]
   cpu-cycles OR cpu / cpu-cycles / [Kernel PMU event]
   instructions OR cpu / instructions / [Kernel PMU event]


   cpu-cycles OR cycles [Hardware event]
   instructions [Hardware event]
   cache-references [Hardware event]
   cache-misses [Hardware event]
   branch-instructions OR branches [Hardware event]
   branch-misses [Hardware event]
   bus-cycles [Hardware event]
   ref-cycles [Hardware event]

   cpu-clock [Software event]
   task-clock [Software event]
   page-faults OR faults [Software event]
   OR-cs [Software event]
   cpu-migrations OR migrations [Software event]
   minor-faults [Software event]
   major-faults [Software event]
   alignment-faults [Software event]
   emulation-faults [Software event]
   dummy [Software event]

   L1-dcache-loads [Hardware cache event]
   L1-dcache-load-misses [Hardware cache event]
   L1-dcache-stores [Hardware cache event]
   L1-dcache-store-misses [Hardware cache event]
   L1-dcache-prefetches [Hardware cache event]
   L1-icache-loads [Hardware cache event]
   L1-icache-load-misses [Hardware cache event]
   LLC-loads [Hardware cache event]
   LLC-load-misses [Hardware cache event]
   LLC-stores [Hardware cache event]
   LLC-store-misses [Hardware cache event]
   dTLB-loads [Hardware cache event]
   dTLB-load-misses [Hardware cache event]
   dTLB-stores [Hardware cache event]
   dTLB-store-misses [Hardware cache event]
   iTLB-loads [Hardware cache event]
   iTLB-load-misses [Hardware cache event]
   branch-loads [Hardware cache event]
   branch-load-misses [Hardware cache event]
And that's what's on ARM
  root @ etn: ~ # perf list pmu hw sw cache

   cpu-cycles OR cycles [Hardware event]
   instructions [Hardware event]
   cache-references [Hardware event]
   cache-misses [Hardware event]
   branch-instructions OR branches [Hardware event]
   branch-misses [Hardware event]
   stalled-cycles-frontend OR idle-cycles-frontend [Hardware event]
   stalled-cycles-backend OR idle-cycles-backend [Hardware event]
   ref-cycles [Hardware event]

   cpu-clock [Software event]
   task-clock [Software event]
   page-faults OR faults [Software event]
   OR-cs [Software event]
   cpu-migrations OR migrations [Software event]
   minor-faults [Software event]
   major-faults [Software event]
   alignment-faults [Software event]
   emulation-faults [Software event]
   dummy [Software event]

   L1-dcache-loads [Hardware cache event]
   L1-dcache-load-misses [Hardware cache event]
   L1-dcache-stores [Hardware cache event]
   L1-dcache-store-misses [Hardware cache event]
   L1-icache-load-misses [Hardware cache event]
   dTLB-load-misses [Hardware cache event]
   dTLB-store-misses [Hardware cache event]
   iTLB-load-misses [Hardware cache event]
   branch-loads [Hardware cache event]
   branch-load-misses [Hardware cache event]
It can be seen that x86 will be richer for such things.
To access "perf events", a special system call
perf_event_open was made, to which you send the event itself and the config, which describes what you want to do with this event. In response, you get a file descriptor from which you can read the data collected by perf on the event.On top of this,
perf provides many different features, such as grouping events, filtering, outputting to different formats, analyzing collected profiles, etc. Therefore, perf now shoves everything that is possible: from tracepoint to eBPF and to the point that all ftrace they want to make part of perf [3] [4] .In short, “perf_events” is of little interest in itself, and
perf itself deserves a separate article, so for the seed I will show a simple example.We speak:
  root @ etn: ~ # perf timechart record apt-get update
 ...
 root @ etn: ~ # perf timechart -i perf.data -o timechart.svg
And we get this miracle:
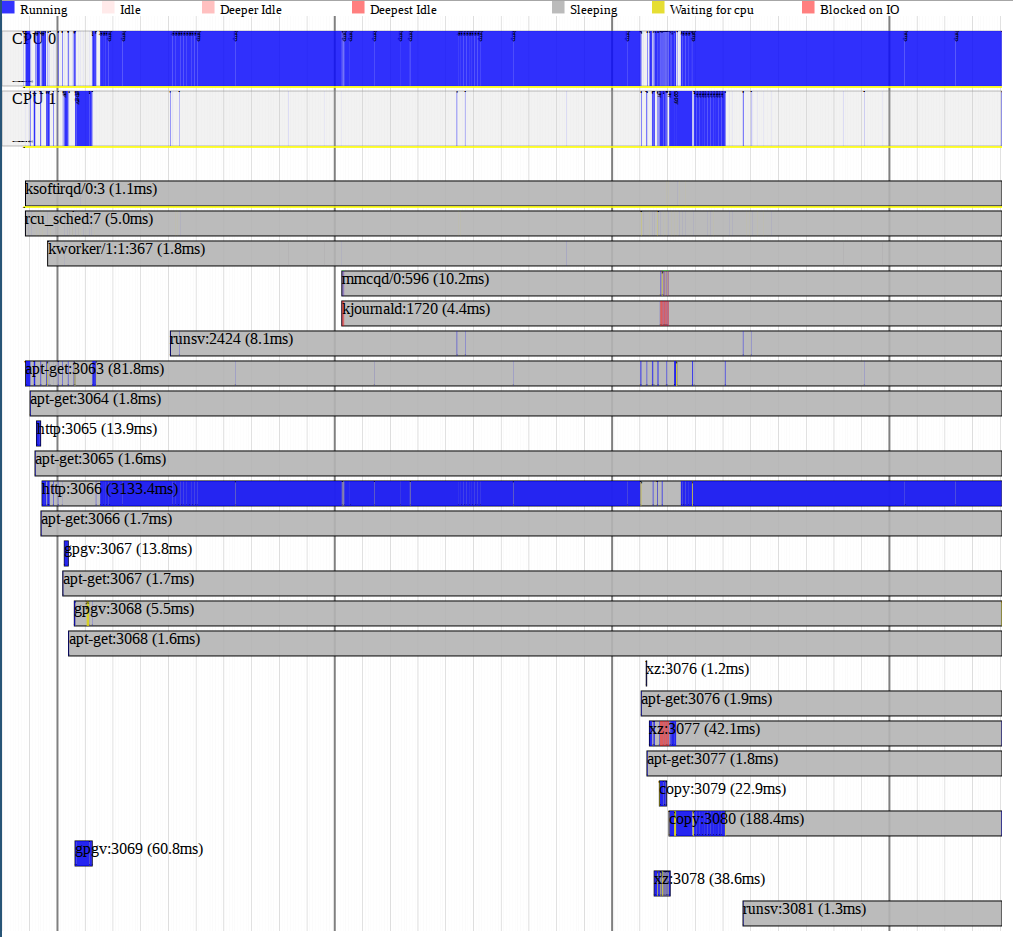 Perf timechart
Conclusion
Thus, knowing a little more about tracing and profiling in the kernel, you can make life much easier for yourself and your friends, especially if you learn how to use real tools like
ftrace , perf and SystemTap , but more on that another time.Read
Source: https://habr.com/ru/post/261003/
All Articles