RAD using multidimensional table processor
I want to share with the business community a project from the field of business intelligence, which I have been doing in my spare time for the last year and a half.
Many use tabular processors (Excel, OpenOffice Calc, etc.) to quickly create applications that perform simple calculations, help in creating reports or make planning easier. Despite the fact that the capabilities of such applications are usually very limited, the simplicity of tabular processors makes this approach very popular. This article focuses on trying to expand the capabilities of tabular processors using a multidimensional data model (usually associated with the concept of OLAP ), while trying not to complicate the work with the new tool too much. Who cares read on.
')
Problem
For the past five years I have been working as an IT consultant and have been engaged in .NET development mainly in the field of controlling and planning in large enterprises. During this time, I have already come across projects several times when a client showed a complex excel document with many formulas and a couple of scripts and said that he wanted an application with the same functionality plus a couple of additional features. These projects combined a similar scenario of using the document, consisting of three steps:
- Collect data from many (5-1000) users. The data consisted of numbers tied to several attributes, such as: sales at a certain point, for a certain time, of a certain product or expenses for a project, category, department. The document was usually either located in a network folder, or copies were sent to users by e-mail, and the answer was manually transferred to one document.
- Calculate statistics / result. Excel became more complicated over the course of several years and, apart from the multitude of formulas, its use implied several steps that were performed manually. Simulations of computations with different inputs are also possible. For example: what would have happened if the dollar had risen by 10%.
- Show result as a table. Usually this table was subsequently used in printed reports or in presentation slides.
Solutions based on tabular processors with which I dealt, as a rule, were used for one of two purposes:
- planning, when plans and forecasts for the future are not in the company's transaction bases, but in the heads of experts
- special reports whose source data is not maintained in transactional systems
Over time, the amount of manual work associated with the use of tabular processors greatly increased, and the organization decided to pay for the development of special software with the possibility of parallel operation of many users and reliable data storage in the database.
Example
Here is a fictional and very simplified example of such a spreadsheet, which, nevertheless, illustrates the difficulties associated with the “flat” data model.
Imagine a company selling lemonade. We have 3 employees who sell lemonade in different places of the city. The company decides to plan sales for each day in order to:
- approximately know how many lemons to buy in the morning
- pay bonuses to employees who are trying to increase sales (for example, calling people, rather than playing on the phone behind the counter)
Since the company has 3 employees, 1 product and so far there is no special need to keep long-term statistics, she decides to use spreadsheets. This is how our document looks like:

In the rows are days, and in the columns the number of sold cups of lemonade, revenue and percentage of the plan. In order to compare plans with reality, we will keep data in two versions: planned and actual. We created a worksheet for each employee, and we count on them the amount based on the fact that in each sheet the row Total has the number 33. Every month we copy a piece of paper, erase the data and fill out again.
Question: What to do if we have several products (fresh orange juice?), We want statistics by months or a year, the salesmen’s headquarters expand, and we want to see data on the city’s districts (for example, to see the effect of advertising)? What if we want to complicate the formulas and add cost planning? Of course, we can still suffer a bit with the tables: produce worksheets for each product and seller (for example, only 5 products and 10 sellers = 50 sheets), correct copied formulas, write scripts to group sellers and so on. What if…
Idea
Remembering the university course on databases, I immediately noticed that the multidimensional data model is very well suited for describing such systems.
My first solution was to create a .NET framework that stored data in the database as a multidimensional cube, was in charge of controlling access to the data, and allowed the calculations to be described as IronPython scripts. Although the code for each new project required significantly less, using this framework required knowledge of C # and databases.
After some time, the idea emerged to create a multidimensional system similar to tabular processors, working with which would not require programming skills .
Market
Then it goes about OLAP and multidimensional data analysis. Since this topic has already been discussed at Habré (for example, Introduction to multivariate analysis ), I will not repeat and assume that the reader knows about what is at stake.
An Internet search showed that the idea is not new. I came across two categories of similar products:
Multidimensional table processors (Multi-dimensional spreadsheets)
In 1991, Lotus Development Corporation released the Lotus Improv product, which is a typical representative of this type of software. Despite the fact that this product served as an example for a whole class of similar systems, it was not very successful, and its development was discontinued in 1996. As I understand from the articles on the Internet, the product was designed for one user. For myself, I made the following conclusions:
- The multidimensional data model is too complicated a concept for most ordinary users.
- Using a multidimensional cube alone rarely makes sense. The data that one person enters will most often fit in a two-dimensional tablet. A multi-dimensional data model makes sense in a multi-user scenario.
Full Business Intelligence Systems with Planning Function
Several large (or even very large) companies already offer server systems of this type.
In the description of such systems, the word OLAP is usually present, but there are several differences in their work from the classical OLAP systems, which are usually designed to analyze existing data from transactional systems. In my understanding, planning systems with a multidimensional data model are different in that they allow convenient multi-user data entry into a multidimensional cube. This means that the database behind such a system must simultaneously support both transactional (save user input) and analytical (data aggregation) mode of operation.
It turned out that some of my clients had already tried using one or another planning system with a multidimensional data model and had the following difficulties:
- The use of most of these systems requires the presence of highly paid specialists, since: the ability to program in special scripting languages is necessary; In order to properly install or administer a system, it is often necessary to read several hundred pages of documentation.
- Relatively expensive and complex licenses.
- At the same time, the functionality of such systems is limited and the use of the final product created on the basis of the system is usually more complicated than the use of a specially written application.
With the last item is difficult to do anything. The idea to create software without programming skills is not new, but artificial intelligence has not yet been invented, the possibilities of such programs will be limited. The first two points I decided to fix.
Decision
Write a system, the work with which will be as simple as the use of tabular processors, which has the following properties:
- Multidimensional and hierarchical data model
- Formulas as close as possible to the familiar formulas of tabular processors
- Ability to work in parallel through the web
- Control of access to data and formulas
- Simple installation, the ability to start working in a couple of minutes using the free version
- Easy maintenance (no need to work in the cloud)
- Only a few people who create an application model need to understand OLAP concepts. The user who enters the data simply fills the table.
- The ability to store and quickly calculate large amounts of data (up to a billion values)
Design
Common architecture
The system (codename Egeria) is designed for multi-user work via the Web and consists of a server written in .NET / C # and a web client. To work "at home" there is a simple application (Launcher), which allows you to select a folder with data, starts the local server and opens the browser with the desired address.
Dimensions and their elements
Unlike tabular processors, where rows and columns are numbered by numbers and letters, respectively, members / dimension members in cubes are usually created from elements of the application area (in this case, they are sellers, products, days, and so on). Often, database tables are used to describe the elements of each dimension. Since I did not want to complicate the lives of users by learning SQL, I decided to create a visual concept for representing metadata.
What turned out, I called the visual document. All metadata in the system, including system objects (such as a cube or dimension), is described by a visual document. An example of such a document that describes the formatting of a report position is shown in the following image:
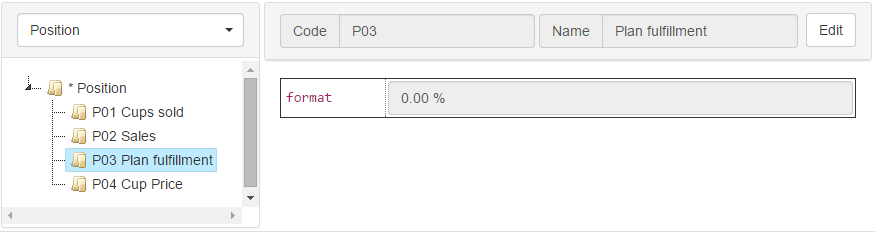
Each document has two fields: a code (Code) for references to a document from formulas and a name (Name) for display on the screen. The visual document itself has a hierarchical structure and consists of ordinary input elements, such as a text field, selection lists, a checkbox, or a list of elements. The structure of a visual document is described by a visual scheme, which in turn is a visual document (the structure of a visual scheme can be described by a visual scheme in the same way that an XML Schema structure can be described using an XML Schema instance). The scheme that describes the document from the previous image defines the "format" field. This diagram can be seen in the “Level data type” section of the following image:

This picture shows the description of the “position report” measurement. In Egeria, all dimensions are hierarchical (even if only one level of hierarchy is defined). This means that each dimension can be represented as a tree. As already mentioned, the elements of this tree are visual documents. Documents of each hierarchy level have their own scheme, described in the Dimension model. Position measurement has one hierarchy level, which is called position. Also, a zero element with an asterisk (*) code is added to each dimension. This item contains no data and is at the highest level of the hierarchy, which also has a star identifier (*). In the first picture on the left we see that the Position measurement consists of 5 elements: *, P01, P02, P03, P04.
Cubes
Numerical data is stored in the so-called cubes. A cube is described by its dimensions and is something like a multi-dimensional Excel sheet. One number can be stored in each cell of the cube.
Data View: Worksheet
Modern screens show no more than two dimensions, which forces us to design data into rows and columns of a two-dimensional table. This transformation and selection of the cube section accessible to the user is described using the worksheet concept.
In Egeria, unlike tabular processors, a worksheet does not contain data (it is stored in a cube), but simply displays data from parts of a cube. Two sheets can show the same cube region.
Everything works the same as a pivot table in tabular processors. The user selects which measurements will be columns, which rows and which filters using drag & drop. After that, for each dimension, the elements that will be displayed in the worksheet are selected. After the worksheet is saved, you can enter data into the cube and create formulas.
Calculations
A simple but flexible cube computing processing system is the main advantage of Egeria. All calculations are made on the server. Formulas are compiled into machine code and therefore run very quickly. On an average laptop, a cube with five million values is completely calculated in 10–20 seconds (the number of unfilled cells in a cube does not matter). The dependency tracking system in a cube allows you to calculate the change in a single cell of a cube instantly (unless, of course, another 5 million cells depend on this cell).
I wanted to make the Egeria formulas as similar as possible to the formulas of conventional tabular processors. Here are 3 main differences that I could not avoid:
- Egeria slightly extends the standard formula language to allow the use of metadata in formulas. The expression pos.format, for example, will return the contents of the format field of an element of the pos dimension of the current cell.
- Added a couple of new features that allow you to work with metadata and format cells. More information about them can be found in the system documentation.
- An important innovation is the addressing system in the cube:
Cube Addressing
Addresses in tabular processors look like this: B3 or $ C $ 4 (first relative, second absolute). It would be too difficult to write each dimension to each address (we can have 10-15 measurements). In addition, Egeria refuses to copy formulas for reasons of speed and clarity of the resulting model of calculations (for each formula we describe the space in which it operates).
Addressing in the system is always relative to the cell, which is considered at the moment.
Each reference to a cube is enclosed in square brackets. In parentheses, comma-separated lists of addresses for each dimension that needs to be changed to get to the desired cell. The expression [] will return the cell that is currently being processed. The expression [dim1: a1] returns the cell with the code a1 in the dimension dim1, leaving the rest of the address unchanged. There are also special functions that allow you to access the elements of hierarchical dimensions. [dim1: children ()] , for example, returns one cell for each element under the current element in the dim1 dimension. This way you can aggregate data.
What will our example look like in Egeria?
We get about this:
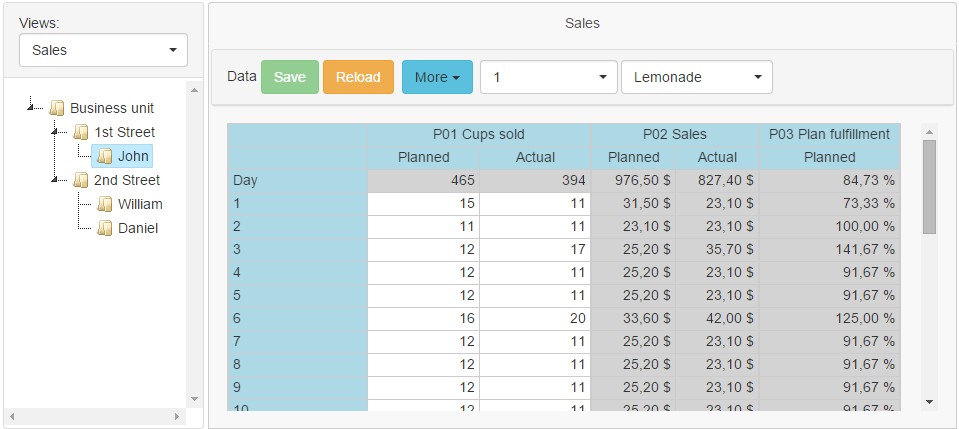
Selecting the seller in the tree on the left and the month and product through the selection lists on top, we will see sales in the table on the right.
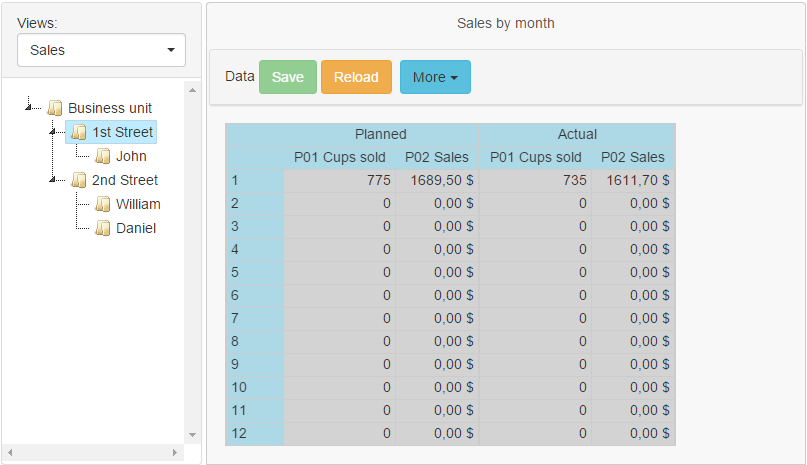
If you select a street in the tree, then on the right you will see sales on this street:
You can create this application in 20 minutes (including data entry) by following these steps:
- Open the metadata editor and create the following measurements (in parentheses are the measurement code used in the formulas):
- Day (day) - Day of sale with items from 1 to 31.
- Month (mon) - Month of sale with items from 1 to 12.
- Data type (dty) - Data type with elements: planned (Planned) and valid (Actual)
- Position (pos) - Position of the report / input form with the elements: the number of cups of lemonade sold (Cups sold), the revenue (Sales), the percentage of the plan fulfillment (Plan fulfillment) and the price per glass (Cup price).
- Business unit (bu) - Our employees are grouped by the streets on which they work.
- Product (prod) - Products that our employees sell.
- Create the following worksheets (worksheets or input forms):
- Prices: Entering prices through the streets.
- Sales: Enter sold cups and count revenue.
- Sales by month: Aggregation of data by month.
- Add formulas.
The formula for calculating sales, for example, is:[day: *, dty: *, mon: *, pos: P04, bu: parent ()] * [pos: P01]
pos: P01 is the element code of the measurement “position of the report” which is called “the number of cups sold” (Cups sold), pos: 04 - “the price of the glass”. Since the price of a glass depends only on the street and the product, we store it on the zero (*) element in the dimensions day (day), data type (dty), and month (mon).
The expression bu: parent () goes from the hierarchy level “seller” (measuring a business unit) to the hierarchy level “street”.
Detailed video with step-by-step creation of this system can be found in the screencasts section on the system website .
Want to know more?
On the website http://egeria.rocks you will find:
- project documentation and screencasts (unfortunately, only in English)
- free system preview
- a couple of sample apps created with egeria
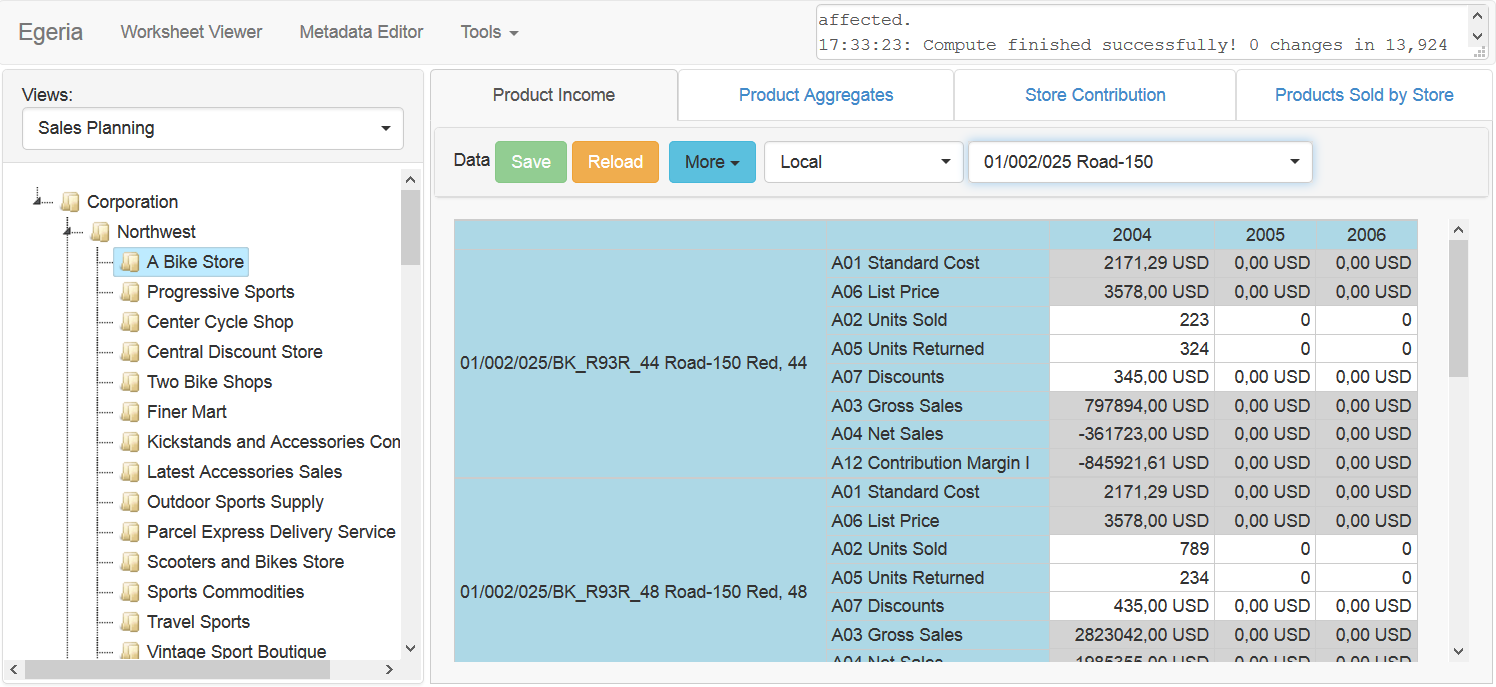
In addition to the example given here, there is:
- a sales planning system that automatically calculates the company's revenues from sales and expenses, while converting currencies
- investment planning system on the example of an amusement park
- real estate appraisal system
- project time tracking system with the ability to enter holidays
and this is only a small part of what Egeria can be used for.
Tech data
For those who are interested in how it all works:
Front-end
In connection with the recent growth in popularity and capabilities of web applications, the choice fell on JavaScript / HTML5 (Single Page Application) as a client. In this case, the server role is limited to providing the REST API.
The client uses AngularJS, which implements the MVVM pattern. The presence of a large number of free components for this platform and its well-thought-out architecture greatly simplified the development of the client.
Back-end
The server is written in C #. Nancy FX is used as a server framework.
ASP.NET seemed too heavy for me to simply create a REST API. In addition, the simplicity of Nancy and the use of the facade pattern will make it possible, if necessary, to replace the web framework within one or two days.
I also wanted the user to just download and launch the application, thus obtaining a local web server. It perfectly supports the self-host script using Nancy.
For parsing formulas used Sprache Framework , which allows you to create a parser for a few hours. After parsing from the syntax tree, Expression Trees are generated, which the .NET runtime turns into native code.
Database
Since under a hood a visual document is serialized into a JSON document, Egeria can store data in any JSON database. Currently there is an adapter for MongoDB. To store data in local files, a self-signed copy-on-write key-value storage (key-value-store) and data serialization using protobuf-net are used. Unfortunately, I could not find a well-maintained key-value repository written entirely in managed code. JSON.NET is used to work with JSON objects.
Cube data is stored in a compressed binary representation (approximately 30 bytes per point with .NET decimal accuracy), which saves memory and quickly moves data from the key-value-store to memory and back. The system is built on the principle of in-memory processing and assumes that all data will fit into memory. The cube is loaded asynchronously and the system is available almost immediately after the start.
Feedback
I would be very happy to hear your opinion about the system.
- Another bike or something new?
- Got an idea for a system?
- I think about putting the code in a readable form, putting it on Github. Would you like the system code to be open, or is quality technical support still more important here?
- Found a bug or want to suggest a new feature?
Write comments.
Especially interesting is the opinion of people who have already been involved in planning systems with a multidimensional data model.
Source: https://habr.com/ru/post/260985/
All Articles