Brubeck is a fast, statsd-compatible metric aggregator from GitHub
Appearance history
One of the main goals of the GitHub development team has always been high performance. They even have a saying: “it's not fully shipped until it's fast” (a product is considered ready only when it is fast). And how to understand that something is working quickly or slowly? Need to measure. Measure correctly, measure reliably, measure always. You need to follow the measurements, visualize various metrics, keep abreast, especially when dealing with high-loaded online systems, such as GitHub. Therefore, metrics is a tool that allows the team to provide such fast and affordable services, almost without downtime.
At the time, GitHub was one of the first to introduce a tool called statsd from Etsy developers. statsd is a metric aggregator written in Node.js. Its essence was to collect various metrics and aggregate them in the server for later saving in any format, for example, in Graphite as data on a graph. statsd is a good tool built on UDP sockets, convenient to use both on the main Rails application and to collect simple metrics, like calling nc -u . The problem with it began to manifest itself later, as the number of servers and metrics sent to statsd grew.
')
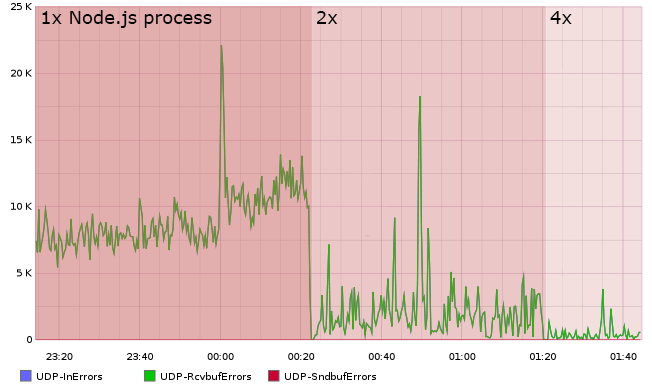
For example, some metrics did not appear correctly, and some, especially new ones, were not collected at all. The reason for this was the almost 40% loss of UDP packets, which simply did not have time to process and were discarded. The nature of a single-threaded Node.js using a single UDP socket manifested itself.
But scaling was not so easy. In order to distribute the collection and processing of packets across several servers, it was necessary to shard not by IP, but by the metrics themselves, otherwise each server would have its own set of data for all metrics. And the task of sharding by metrics is not easy; to solve it, GitHub wrote its parser for UDP packets and balancing by the name of the metric.
This smoothed the situation, allowed to increase the number of statsd instances to four, but was a half-measure:
4 statsd servers, barely collecting metrics, plus a self-written load balancer engaged in parsing UDP packets, eventually forced to rewrite everything more correctly, to pure C, from scratch, while maintaining backward compatibility. So come Brubeck.
Brubeck
But rewriting the Node.js application (event-loop, written in C based on libuv) to pure C, using the same libuv is a dubious task. Therefore, it was decided to revise the architecture of the application.
First, they abandoned the event-loop on the socket. Indeed, when 4 million packets a second flow into you, it makes no sense to spin in a loop each time and ask if there is any new data to read, since, most likely, they have already appeared there, and not alone :)
The event loop was replaced with a pool of threads of workers using one common socket with serialization of access to it. Later, the mechanism was improved by adding support for SO_REUSEPORT for sockets from linux 3.9, which made it possible to abandon the serialization of access of the workers to the socket in the aggregator itself. ( note on this topic it will be interesting to read the article how nginx introduced support for SO_REUSEPORT ).
Secondly, having multiple streams working with the same metrics means that we have data separation. For secure access to shared data, an access synchronization mechanism is needed, for example, lock (lock), which is not good under conditions of high competition for data access and, if necessary, high performance. Lock-free algorithms come to the rescue, in particular, the lock-free implementation of a hash table in which metrics are stored. (in fact, there is a lock-free only for reading, and for writing optimistic locking, but this is not a problem for applications with a high reads-to-write rate, since metrics are added and removed much less often than the data itself comes in ).
Thirdly, data aggregation within one metric was synchronized through spinlock - an extremely cheap mechanism in terms of CPU resource costs and context switching, which also did not cause difficulties, since there was almost no struggle for data within the same metric.
Result
The simple multi-threaded architecture of the aggregator made it possible to achieve quite good results: over the past two years, the only server with Brubeck has grown to handle 4.3 million metrics per second , without losing any packets even at peak load. All info and data are reliably taken from the blog developers .
Brubeck was posted on open source: github.com/github/brubeck
It already has a lot of statsd, but not all. At the moment, development is underway, the community finds bugs and fixes it quickly.
Source: https://habr.com/ru/post/260971/
All Articles