How the PVS-Studio team improved the Unreal Engine code
 Our company creates, promotes and sells the PVS-Studio static code analyzer for C / C ++ programmers. However, our interaction with customers is not limited solely to the sale of licenses for the PVS-Studio product. For example, we do some contract work. By virtue of the NDA, we usually cannot tell about them, and an interesting story will not work. The names of the projects in which we participate will also say nothing to the majority of our readers. But this time, the name says a lot. We worked together with Epic Games on the Unreal Engine project. This will be our story.
To promote the PVS-Studio static code analyzer, we came up with an interesting article format. We check open projects and write about the defects found in the code. Here you can take a look at these articles: updated list . From these articles all benefit. Readers are interested to look at other people's mistakes. At the same time they will learn for themselves new ways to avoid these mistakes, using some tricks or coding style. For us, the benefit is that more people learn about the existence of PVS-Studio. For authors of projects, too, the benefits - they can fix some bugs.
One of such articles was " Long-awaited check of Unreal Engine 4 ". The Unreal Engine source code was notable for its high quality, but as you know, all software development projects contain errors and PVS-Studio coped well with finding these errors. We checked the project and sent the test results to Epic Games. The authors of the project have thanked us and corrected the defects found by us. But this was not enough for us, and we decided to try to sell the license for PVS-Studio to Epic Games.
Epic Games was interested in using PVS-Studio to improve its engine. Thus, we check and edit the Unreal Engine source code so that there are no bugs left in the code and, at the same time, the analyzer no longer generates a single false positive. After that, they will start using PVS-Studio on their code base, minimizing the complexity of integrating the analyzer into their development process. In this case, Epic Games agreed to pay not only the license, but also reward us additionally for the work done.
')
We agreed. Work is done. And now we offer the reader to get acquainted with interesting moments that we encountered while working with the Unreal Engine source codes.
From the PVS-Studio side, Pavel Eremeev, Svyatoslav Razmyslov, Anton Tokarev participated in the project. From Epic Games, we received the most help from Andy Bayle and Dan O'Connor - without them, our work would have been impossible, thank you!
Integration of PVS-Studio analysis into the Unreal Engine assembly
For assembly in the Unreal Engine uses its own build system - the Unreal Build Tool. There is also a set of scripts for generating project files for different platforms and compilers. Since PVS-Studio is primarily aimed at working with the Microsoft Visual C ++ compiler, we used the script to get project files (* .vcxproj) for the Microsoft Visual Studio environment.
PVS-Studio has a plug-in that integrates into the Visual Studio development environment and allows you to perform a one-click analysis. However, projects generated for the Unreal Engine are not “normal” MSBuild projects that Visual Studio uses.
When compiling the Unreal Engine in Visual Studio, the environment calls MSBuild when the build starts, however, MSBuild itself is used only as a wrapper to invoke the previously mentioned Unreal Build Tool.
To analyze the source code in PVS-Studio, you need the results of the preprocessor. The analyzer requires a * .i file in which all header files are inserted and all macros are opened.
Note. Further this section will be of interest only to those who use a nonstandard assembly system, for example, like the Unreal Engine. If you plan to try checking your project with PVS-Studio, which is going to be cunning somehow, then I suggest reading this section to the end. Perhaps he will help cope with the verification of your project. If you have an ordinary project for Visual Studio, or you want to quickly read about the errors found, you can skip this section.
In order to correctly run the preprocessor, you need information about the compilation parameters. This information is available in “ordinary” MSBuild projects, and the PVS-Studio plugin “sees” it and can independently preprocess the necessary sources for the subsequent launch of the analyzer. The situation is different with Unreal Engine projects.
As mentioned above, these projects are just a “wrapper”, the actual compiler call is made by the Unreal Build Tool. Therefore, the compilation options are not available to the PVS-Studio plugin for Visual Studio. One-click analysis cannot be run, although the plugin can be used to view the analysis results.
The analyzer itself (PVS-Studio.exe) is a command-line application similar in its use case to the C ++ compiler. Like the compiler, it must be run for each source file, passing the compilation parameters of this file via the command line or response file. The analyzer itself will launch the correct preprocessor and subsequently perform the analysis.
Note. There is another way to work. You can also run the analyzer for an already prepared preprocessed file.
Thus, a universal solution for integrating the PVS-Studio analyzer will be to call its executable file in the same place where the compiler is called — that is, in the assembly system. In this case, in the Unreal Build Tool. It is clear that this will require modification of the used assembly system, which, as in our case, may be undesirable. Therefore, just for similar situations we created a system of “interception” of calls to the compiler - Compiler Monitoring.
The Compiler Monitoring system is able to “catch” the start of compilation processes (in the case of Visual C ++, these are cl.exe processes), collect all the parameters necessary for preprocessing from such processes, and restart the preprocessing of compiled files, and then run their analysis. So do.
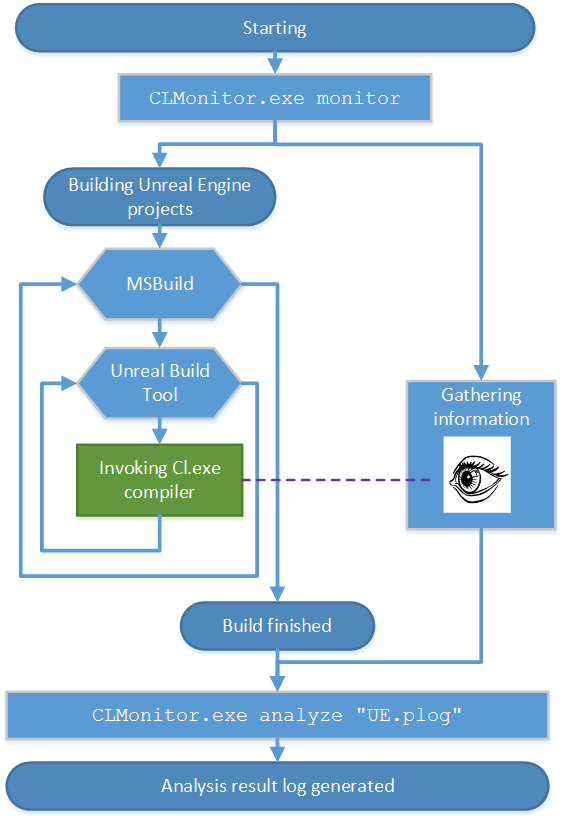
Figure 1. Schematic representation of the verification process of the Unreal Engine project.
Integration of the Unreal Engine analysis is for us to start immediately before assembling the monitoring process (CLMonitor.exe), which, upon completion of the assembly, will already perform all the necessary steps for preprocessing and directly calling the analyzer. To start monitoring, you need to run a simple command:
CLMonitor.exe monitor CLMonitor.exe will launch itself in tracking mode and exit. At the same time, another CLMonitor.exe process will remain hanging in the background, carrying out a direct “trapping” of the compilers. Upon completion of the assembly, you need to execute another simple command:
CLMonitor.exe analyze "UE.plog" Now CLMonitor.exe will launch directly the analysis of the previously collected source files and save the results to the UE.plog file, with which you can already work in our IDE plugin.
We set up on our Continuous Integration server a regular nightly build of interesting Unreal Engine configurations with the subsequent launch of the analysis. Thus, we, first of all, checked that our edits did not break the assembly, and secondly, we received every morning a new report on the verification of the Unreal Engine, taking into account all the revisions made the previous day. And before sending the Pull Request to include our edits in the main project repository, we could easily check that the current version in our repository is stable by simply restarting the build on the server.
Nonlinear speed of edits
So, we have mastered the process of building the project and its analysis. Now let's talk about edits in the code, based on the issued warnings.
At first glance it may seem that the number of warnings issued by the analyzer from day to day should decrease evenly. Approximately the same number of messages is suppressed with the help of some PVS-Studio mechanisms, approximately the same number of edits are made in the code.
That is, theoretically, you can expect some such schedule:
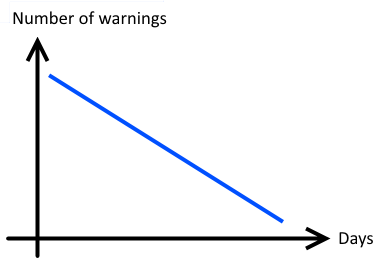
Figure 2. The perfect schedule. The number of errors decreases evenly with each working day.
In fact, messages disappear in the beginning faster than later. First, at the initial stage, warnings in the macros are suppressed, and this quickly reduces their number. Secondly, it turns out that in the beginning obvious things are corrected, and incomprehensible places are postponed for later. We can explain why simple things were ruled in the beginning. I wanted to show developers from Epic Games that we started to work and the process went. It would be strange to start with the complex and get stuck on it.
In total, it took 17 working days to work directly with the Unreal Engine code. Our goal was to destroy all the warnings of the first and second levels of general purpose. Here's how the work went:

Table 1. Number of analyzer warnings on different days.
Pay attention to the numbers highlighted in red. In the first couple of days, we got a little accustomed, and then suppressed warnings in some macros, drastically reducing the number of false positives.
Seventeen working days is a lot, and readers should be explained. First, the project did not work the whole team, but only two people. At the same time they were engaged in other tasks. Secondly, the Unreal Engine code is completely unfamiliar to us, so making the edit was quite a challenge. I had to constantly figure out whether to edit the code, and if so, how.
Now the same data presented in the form of a smoothed graph:
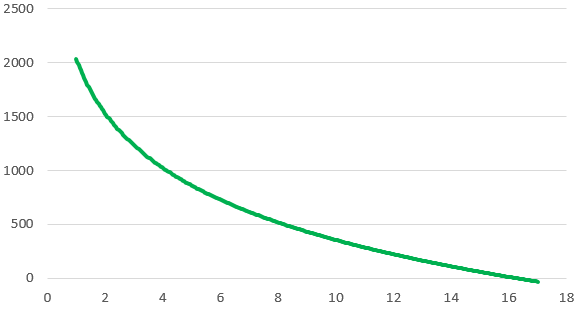
Figure 3. The smoothed graph of the number of alerts.
Practical conclusion. It is necessary to remember yourself and others to warn. A bad idea is to make an estimate of the time it takes to work through all the warnings, only on the first days of work. In the early days, work is going very fast and the forecast will be too optimistic.
But it is still necessary to evaluate somehow. I think some kind of magic formula will work well here and over time we will compose it and show it to the world. While we do not have enough statistics to come up with something true.
About errors found
We corrected a lot of code fragments. Edits can be divided into 3 groups:
- The real mistakes. Below we give a few such errors as an example.
- There was no trouble, but the code was confusing the analyzer and could confuse the person who starts to study this code. In other words, this code, which "smells" and it is also useful to correct it. What we did.
- Edits that are caused solely by the need to "please" the code analyzer, issuing false positives. We tried, if possible, to put the suppression of false messages in a separate special file or improve the operation of the analyzer itself. But still, several places had to be refactored to help the analyzer understand what was happening.
The first interesting message from PVS-Studio: V506 Pointer to local variable "NewBitmap" Such a pointer will become invalid. fontcache.cpp 466
void GetRenderData(....) { .... FT_Bitmap* Bitmap = nullptr; if( Slot->bitmap.pixel_mode == FT_PIXEL_MODE_MONO ) { FT_Bitmap NewBitmap; .... Bitmap = &NewBitmap; } .... OutRenderData.RawPixels.AddUninitialized( Bitmap->rows * Bitmap->width ); .... } The address of the NewBitmap object is stored in the Bitmap pointer. The trouble is that right after this, the lifetime of the NewBitmap object ends and it collapses. It turns out that Bitmap points to an already destroyed object.
When attempting to use a pointer to access a destroyed object, undefined behavior will occur. How it will manifest itself is unknown. The program can even successfully work for many years if, thanks to luck, the data of a dead object (located on the stack) are not overwritten by something else.
It will be correct to make the NewBitmap declaration outside the 'if' operator:
void GetRenderData(....) { .... FT_Bitmap* Bitmap = nullptr; FT_Bitmap NewBitmap; if( Slot->bitmap.pixel_mode == FT_PIXEL_MODE_MONO ) { FT_Bitmap_New( &NewBitmap ); // Convert the mono font to 8bbp from 1bpp FT_Bitmap_Convert( FTLibrary, &Slot->bitmap, &NewBitmap, 4 ); Bitmap = &NewBitmap; } else { Bitmap = &Slot->bitmap; } .... OutRenderData.RawPixels.AddUninitialized( Bitmap->rows * Bitmap->width ); .... } Next warning PVS-Studio: V522 Dereferencing of the null pointer 'GEngine' might take place. Check the logical condition. gameplaystatics.cpp 988
void UGameplayStatics::DeactivateReverbEffect(....) { if (GEngine || !GEngine->UseSound()) { return; } UWorld* ThisWorld = GEngine->GetWorldFromContextObject(....); .... } If the GEngine pointer is non-zero, then the function is exited. All is well. But if the GEngine pointer is zero, then it is dereferenced.
We fixed the code as follows:
void UGameplayStatics::DeactivateReverbEffect(....) { if (GEngine == nullptr || !GEngine->UseSound()) { return; } UWorld* ThisWorld = GEngine->GetWorldFromContextObject(....); .... } An interesting typo is waiting for readers in the following code snippet. In it, the analyzer detected a meaningless function call: V530 The return value of the function 'Memcmp' is required to be utilized. pathfollowingcomponent.cpp 715
int32 UPathFollowingComponent::OptimizeSegmentVisibility( int32 StartIndex) { .... if (Path.IsValid()) { Path->ShortcutNodeRefs.Reserve(....); Path->ShortcutNodeRefs.SetNumUninitialized(....); } FPlatformMemory::Memcmp(Path->ShortcutNodeRefs.GetData(), RaycastResult.CorridorPolys, RaycastResult.CorridorPolysCount * sizeof(NavNodeRef)); .... } The result of the Memcmp function is not used. This alarmed the analyzer.
In fact, the programmer planned to copy the memory using the Memcpy () function, but made a typo. Corrected code:
int32 UPathFollowingComponent::OptimizeSegmentVisibility( int32 StartIndex) { .... if (Path.IsValid()) { Path->ShortcutNodeRefs.Reserve(....); Path->ShortcutNodeRefs.SetNumUninitialized(....); FPlatformMemory::Memcpy(Path->ShortcutNodeRefs.GetData(), RaycastResult.CorridorPolys, RaycastResult.CorridorPolysCount * sizeof(NavNodeRef)); } .... } Let's talk about the diagnostic message, which can be found when checking almost any project. Already a very common type of error it reveals. This is a diagnosis of V595. In our database of errors, it ranks first in the number of defects found (see examples ). At first glance, the list is not that big compared to, say, V501 . But the fact is that the V595 diagnostics are somewhat boring in order to write many examples from some project. Often, one example is written out and a type of postscript is made: And 161 additional diagnostic messages. In half of the cases, these are the real mistakes. Here's what it looks like:
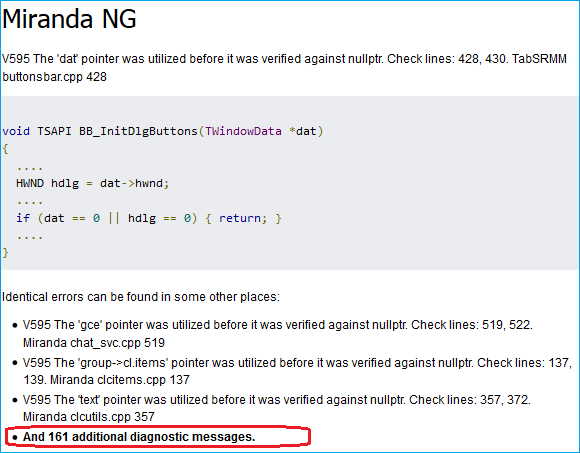
Figure 4. Horror diagnostics V595.
Diagnostics V595 finds code points where pointer dereferencing is performed before it is checked for zero. Usually in the checked projects there is always a certain number of such warnings. Checking and dereferencing a pointer can be quite far in the function code: tens or even hundreds of lines apart, which makes it difficult to correct the error. But there are also small, very illustrative examples, such as, for example, this function:
float SGammaUIPanel::OnGetGamma() const { float DisplayGamma = GEngine->DisplayGamma; return GEngine ? DisplayGamma : 2.2f; } : V595 The 'GEngine' pointer was utilized before it was verified against nullptr. Check lines: 47, 48. gammauipanel.cpp 47 We fixed this function as follows:
float SGammaUIPanel::OnGetGamma() const { return GEngine ? GEngine->DisplayGamma : 2.2f; } Let's go to the next fragment:
V517 The use of if (A) {...} else if (A) {...} 'pattern was detected. There is a possibility of logical error presence. Check lines: 289, 299. automationreport.cpp 289
void FAutomationReport::ClustersUpdated(const int32 NumClusters) { ... //Fixup Results array if( NumClusters > Results.Num() ) //<== { for( int32 ClusterIndex = Results.Num(); ClusterIndex < NumClusters; ++ClusterIndex ) { .... Results.Add( AutomationTestResult ); } } else if( NumClusters > Results.Num() ) //<== { Results.RemoveAt(NumClusters, Results.Num() - NumClusters); } .... } In the current form, the second condition is never satisfied. It is logical to assume that the error in the sign of the second condition, so that extra elements are removed from the array 'Result':
void FAutomationReport::ClustersUpdated(const int32 NumClusters) { .... //Fixup Results array if( NumClusters > Results.Num() ) { for( int32 ClusterIndex = Results.Num(); ClusterIndex < NumClusters; ++ClusterIndex ) { .... Results.Add( AutomationTestResult ); } } else if( NumClusters < Results.Num() ) { Results.RemoveAt(NumClusters, Results.Num() - NumClusters); } .... } Sample code for careful reading. Message: V616 The 'DT_POLYTYPE_GROUND' named with value is used in the bitwise operation. pimplrecastnavmesh.cpp 2006
/// Flags representing the type of a navigation mesh polygon. enum dtPolyTypes { DT_POLYTYPE_GROUND = 0, DT_POLYTYPE_OFFMESH_POINT = 1, DT_POLYTYPE_OFFMESH_SEGMENT = 2, }; uint8 GetValidEnds(...., const dtPoly& Poly) { .... if ((Poly.getType() & DT_POLYTYPE_GROUND) != 0) { return false; } .... } At first glance, everything is fine. It seems that a bit is selected by the mask and its value is checked. But, in fact, in the enumeration of 'dtPolyTypes', simply named constants are defined that are not intended to highlight certain bits.
In this condition, the DT_POLYTYPE_GROUND constant is 0, which means the condition will never be met.
Corrected version:
uint8 GetValidEnds(...., const dtPoly& Poly) { .... if (Poly.getType() == DT_POLYTYPE_GROUND) { return false; } .... } Revealed typo: V501 ||| operator:! bc.lclusters ||! bc.lclusters detourtilecache.cpp 687
dtStatus dtTileCache::buildNavMeshTile(....) { .... bc.lcset = dtAllocTileCacheContourSet(m_talloc); bc.lclusters = dtAllocTileCacheClusterSet(m_talloc); if (!bc.lclusters || !bc.lclusters) //<== return status; status = dtBuildTileCacheContours(....); .... } When copying a variable, they forgot to rename it from 'bc.lclusters' to 'bc.lcset'.
Regular verification results
Above were listed not all found errors, but only a small part of them. We led them to demonstrate what errors PVS-Studio can find even in the working and tested code.
However, we do not tire of repeating that a one-time code check is the wrong way to use a static analyzer. The analysis should be carried out regularly and then a huge number of errors and typos can be found at the stage of writing the code, and not at the stage of testing or maintenance.
Now we will perfectly support our words with the help of the Unreal Engine project.
In the beginning, we ruled the code, ignoring whether it is fresh or old. It was not before. But we very well noticed how the PVS-Studio analyzer began to detect errors in the new or corrected code when we reduced the number of warnings to 0.
In fact, we fiddled with the code a little more than 17 working days. When we finished making edits, and the analyzer started issuing 0 warnings, we waited for another 2 days for the Unreal Engine developers to receive our last Pull Request. And during this time continued to be updated from the main repository and perform the verification code.
And during these two days we managed to see how the analyzer detected errors in the new code. We corrected these mistakes too. But the most important thing is that it perfectly demonstrates the benefits of regular inspections.
In fact, the end of the “number of messages” chart has become
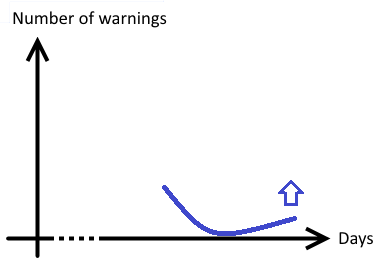
Figure 5. A schematic graph of the growth in the number of warnings after they became 0.
Let's see what we managed to find in the last two days, checking for recent changes in the project code.
The first day
Analyzer first message: V560 A part of conditional expression is always true: FBasicToken :: TOKEN_Guid. k2node_mathexpression.cpp 235
virtual FString ToString() const override { if (Token.TokenType == FBasicToken::TOKEN_Identifier || FBasicToken::TOKEN_Guid) //<== { .... } else if (Token.TokenType == FBasicToken::TOKEN_Const) { .... } Forgot to add "Token.TokenType ==". As a result, since the named constant 'FBasicToken :: TOKEN_Guid' is not equal to 0, the condition is always true.
Analyzer second message: V611 Consider inspecting this code. It's probably better to use 'delete [] CompressedDataRaw;'. crashupload.cpp 222
void FCrashUpload::CompressAndSendData() { .... uint8* CompressedDataRaw = new uint8[BufferSize]; //<== int32 CompressedSize = BufferSize; int32 UncompressedSize = UncompressedData.Num(); .... // Copy compressed data into the array. TArray<uint8> CompressedData; CompressedData.Append( CompressedDataRaw, CompressedSize ); delete CompressedDataRaw; //<== CompressedDataRaw = nullptr; .... } In practice, this error does not always manifest itself, since an array of char elements is allocated. But still, this is a mistake that leads to indefinite behavior and must be corrected.
Second day
Analyzer first warning: V521 Such expressions using the ',' operator are dangerous. Make sure the expression is correct. unrealaudiodevicewasapi.cpp 128
static void GetArrayOfSpeakers(....) { Speakers.Reset(); uint32 ChanCount = 0; // Build a flag field of the speaker outputs of this device for (uint32 SpeakerTypeIndex = 0; SpeakerTypeIndex < ESpeaker::SPEAKER_TYPE_COUNT, //<== ChanCount < NumChannels; ++SpeakerTypeIndex) { .... } check(ChanCount == NumChannels); } Good such fat mistake.
The comma operator ',' is used to perform expressions on both sides of it in order from left to right and get the value of the right expression.
As a result, the condition for stopping the loop is only this check: ChanCount <NumChannels.
Corrected condition:
static void GetArrayOfSpeakers(....) { Speakers.Reset(); uint32 ChanCount = 0; // Build a flag field of the speaker outputs of this device for (uint32 SpeakerTypeIndex = 0; SpeakerTypeIndex < ESpeaker::SPEAKER_TYPE_COUNT && ChanCount < NumChannels; ++SpeakerTypeIndex) { .... } check(ChanCount == NumChannels); } The second warning. V543 It is odd that value '-1' is assigned to the variable 'Result' of HRESULT type. unrealaudiodevicewasapi.cpp 568
#define S_OK ((HRESULT)0L) #define S_FALSE ((HRESULT)1L) bool FUnrealAudioWasapi::OpenDevice(uint32 DeviceIndex, EStreamType::Type StreamType) { check(WasapiInfo.DeviceEnumerator); IMMDevice* Device = nullptr; IMMDeviceCollection* DeviceList = nullptr; WAVEFORMATEX* DeviceFormat = nullptr; FDeviceInfo DeviceInfo; HRESULT Result = S_OK; //<== .... if (!GetDeviceInfo(DataFlow, DeviceIndex, DeviceInfo)) { Result = -1; //<== goto Cleanup; } .... } HRESULT is a 32-bit value divided into three different fields: the error severity code, the device code, and the error code. To work with the HRESULT value, use special constants, such as S_OK, E_FAIL, E_ABORT, and so on. And to check the values of type HRESULT, use such macros as SUCCEEDED, FAILED.
The V543 warning is issued if a variable of type HRESULT is attempted to write a value of -1, true or false.
Writing the value "-1" is incorrect. If you want to report an incomprehensible error, you should use the value 0x80004005L (Unspecified failure). This and similar constants are described in “WinError.h”.
Eh, what a difficult implementation ...
Some programmers and managers may be saddened to learn that it will take N days to integrate static analysis into their project. However, it is not necessary to go this way. It is necessary to understand that the developers of Epic Games have chosen the PERFECT PATH, but not the easiest and fastest.
Yes, ideally, it is better to immediately correct all errors and then quickly respond to new messages from the analyzer issued to the new code. But you can begin to benefit from static analysis without spending time editing the old code.
For this, PVS-Studio offers a special mechanism for marking messages. In a nutshell we describe the general idea.
All messages issued by the analyzer are marked in a special database as inactive. And then programmers see only analyzer messages related to new or modified code. That is, you can immediately begin to benefit from the analysis. And only then, if there is a desire and time, you can slowly view the messages related to the old code and edit the shortcomings.
Details about all this can be found here: documentation , how to quickly implement the analysis in the project .
“Did you write to the developers?”
After each article about checking a project, we are asked: “Have you informed the developers?” And although we always report, such questions are pretty tiring. However, this time we not only “wrote to the developers,” but also corrected all these errors. What anyone can verify in the GitHub repository.
Conclusion
Hopefully, the Epic Games developers liked the work done to edit and improve the Unreal Engine code, and the project benefited. And we are waiting for new projects on the Unreal Engine.
Some conclusions that can be drawn from the results of our work:
- The code of the Unreal Engine project is very high quality. Let readers not be confused by a large number of warnings at the initial stage. This is a normal situation. Most of these warnings have been removed using various methods and settings. The number of real errors found in the code for a project of this size is very small.
- To edit someone else's unfamiliar code is often very difficult. However, this is so clear to any developer on an intuitive level. Nevertheless, we decided to mention this.
- The speed of "processing" warnings is not linear. It will slow down and this should be taken into account when calculating how much is left until the end of edits.
- The maximum benefit from static analysis can be obtained only with its regular use.
Source: https://habr.com/ru/post/260755/
All Articles