Aggregation of time series data

In this article, we open a series of publications on specific problems solved as part of the implementation of AggreGate, which we hope will be able to help you in your real projects.
Some time ago, a cellular operator in Africa turned to our partners involved in the manufacture and maintenance of integrated power supply systems for base stations. The project was designed for 1000-2000 base stations. As part of this project, AggreGate was used to monitor, control, visualize, and build reports. Logging system operation required reports, with which you can quickly see the basic parameters of the equipment. These reports were later used to form the KPI of the power supply system, select the optimal parameters, determine the maintenance schedule and build a route for the engineering team.
')
We have created a flexible tool for AggreGate that allows you to conveniently create this table using both historical data and statistical data. Function summary () . In this article we will look at how to get a table of data on historical values.
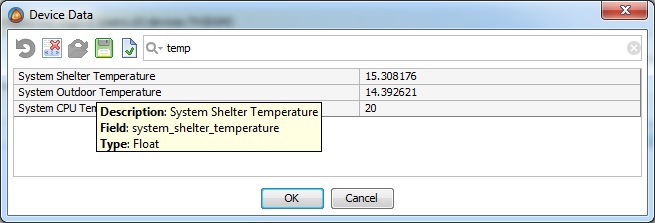
In our example, I propose to use data on the ambient temperature and the SOC temperature used in the sites to control energy sources.
STEP 1: Choose which fields of the variable we need.
It is most convenient to study the device snapshot and determine which names of the fields of interest to us.
STEP 2: We write the expression to get the data and understand the parameters of the function.

To call the function summary () , which is in the context of utilities, we used the function callFunction () , which allows us to call a function of any context and pass parameters for this function:
subtable (callFunction ("utilities", "summary", "systemCPUTemperature", "System CPU Temperature", date (2015, 05, 10, 0, 0, 0), date (2015, 05, 19, 0, 0, 0 ), "Users.d3.devices.TH3DGM", "device_data", 1, "{system_cpu_temperature}", null, 4, 2, 0, 0, null, null, null, true, false, 0), "periodName" , “Context”, “systemCPUTemperature”)
Where:
1) “systemCPUTemperature” field ID in the resulting table (without spaces).
2) “System CPU Temperature” Description of the field in the resulting table.
3) date (2015, 05, 10, 0, 0, 0) Start date
4) date (2015, 05, 19, 0, 0, 0) End date
5) “users.d3.devices.TH3DGM” Path to device context or mask.
6) “device_data” ID of the variable on which the function will work.
7) 1 Data type, in our case - variable, it is also possible to work with events.
8) "{system_cpu_temperature}" Expression to calculate the field value in the resulting table. In our case, this is the value of the system_cpu_temperature field.
9) null Expression to calculate the date. (By default, the time stamp is taken from the database, if you need to use another date, you can write an expression here so that the date is the same variable field)
10) 4 Period of data aggregation.
11) 2 Type of aggregation (max in our example)
12) 0 Type of value changes (we have raw data)
13) 0 Data normalization (we ignore such data in our example)
14) null Minimum allowed value for batch input
15) null Maximum allowed value for batch input
16) null Time zone of initial data (we use server time zone)
17) true Whether to show the result for each period of aggregation.
18) false Whether to show the final result for the entire selected period of the original data.
19) 0 Sorted by time or by device (we use by time)
We get the following table:

STEP 3: We remove the extra fields and enjoy the result.

We use the subtable () function, with the first parameter we submit our table, and then we list which fields we want to leave.

In the next post, we will look at how AggreGate’s built-in tools work with events and how to parameterize your queries and reports to make them more flexible and versatile.
We will be glad to any suggestions about what to describe in the following articles and your personal experience, solving specific problems.
Source: https://habr.com/ru/post/260679/
All Articles