Thread pools: NGINX accelerates 9 or more times.
As you know, NGINX uses an asynchronous event approach to handle connections. Instead of allocating a separate thread or process for each request (as traditional servers do), NGINX multiplexes the processing of multiple connections and requests in a single workflow. For this purpose, sockets are used in non-blocking mode and such effective methods of working with events as epoll and kqueue .
Due to the small and constant number of full-weight processing threads (usually one per core), memory savings are achieved, as well as processor resources on context switching. All the advantages of this approach can be well observed by the example of NGINX itself, which is able to process millions of requests at the same time and scale well.
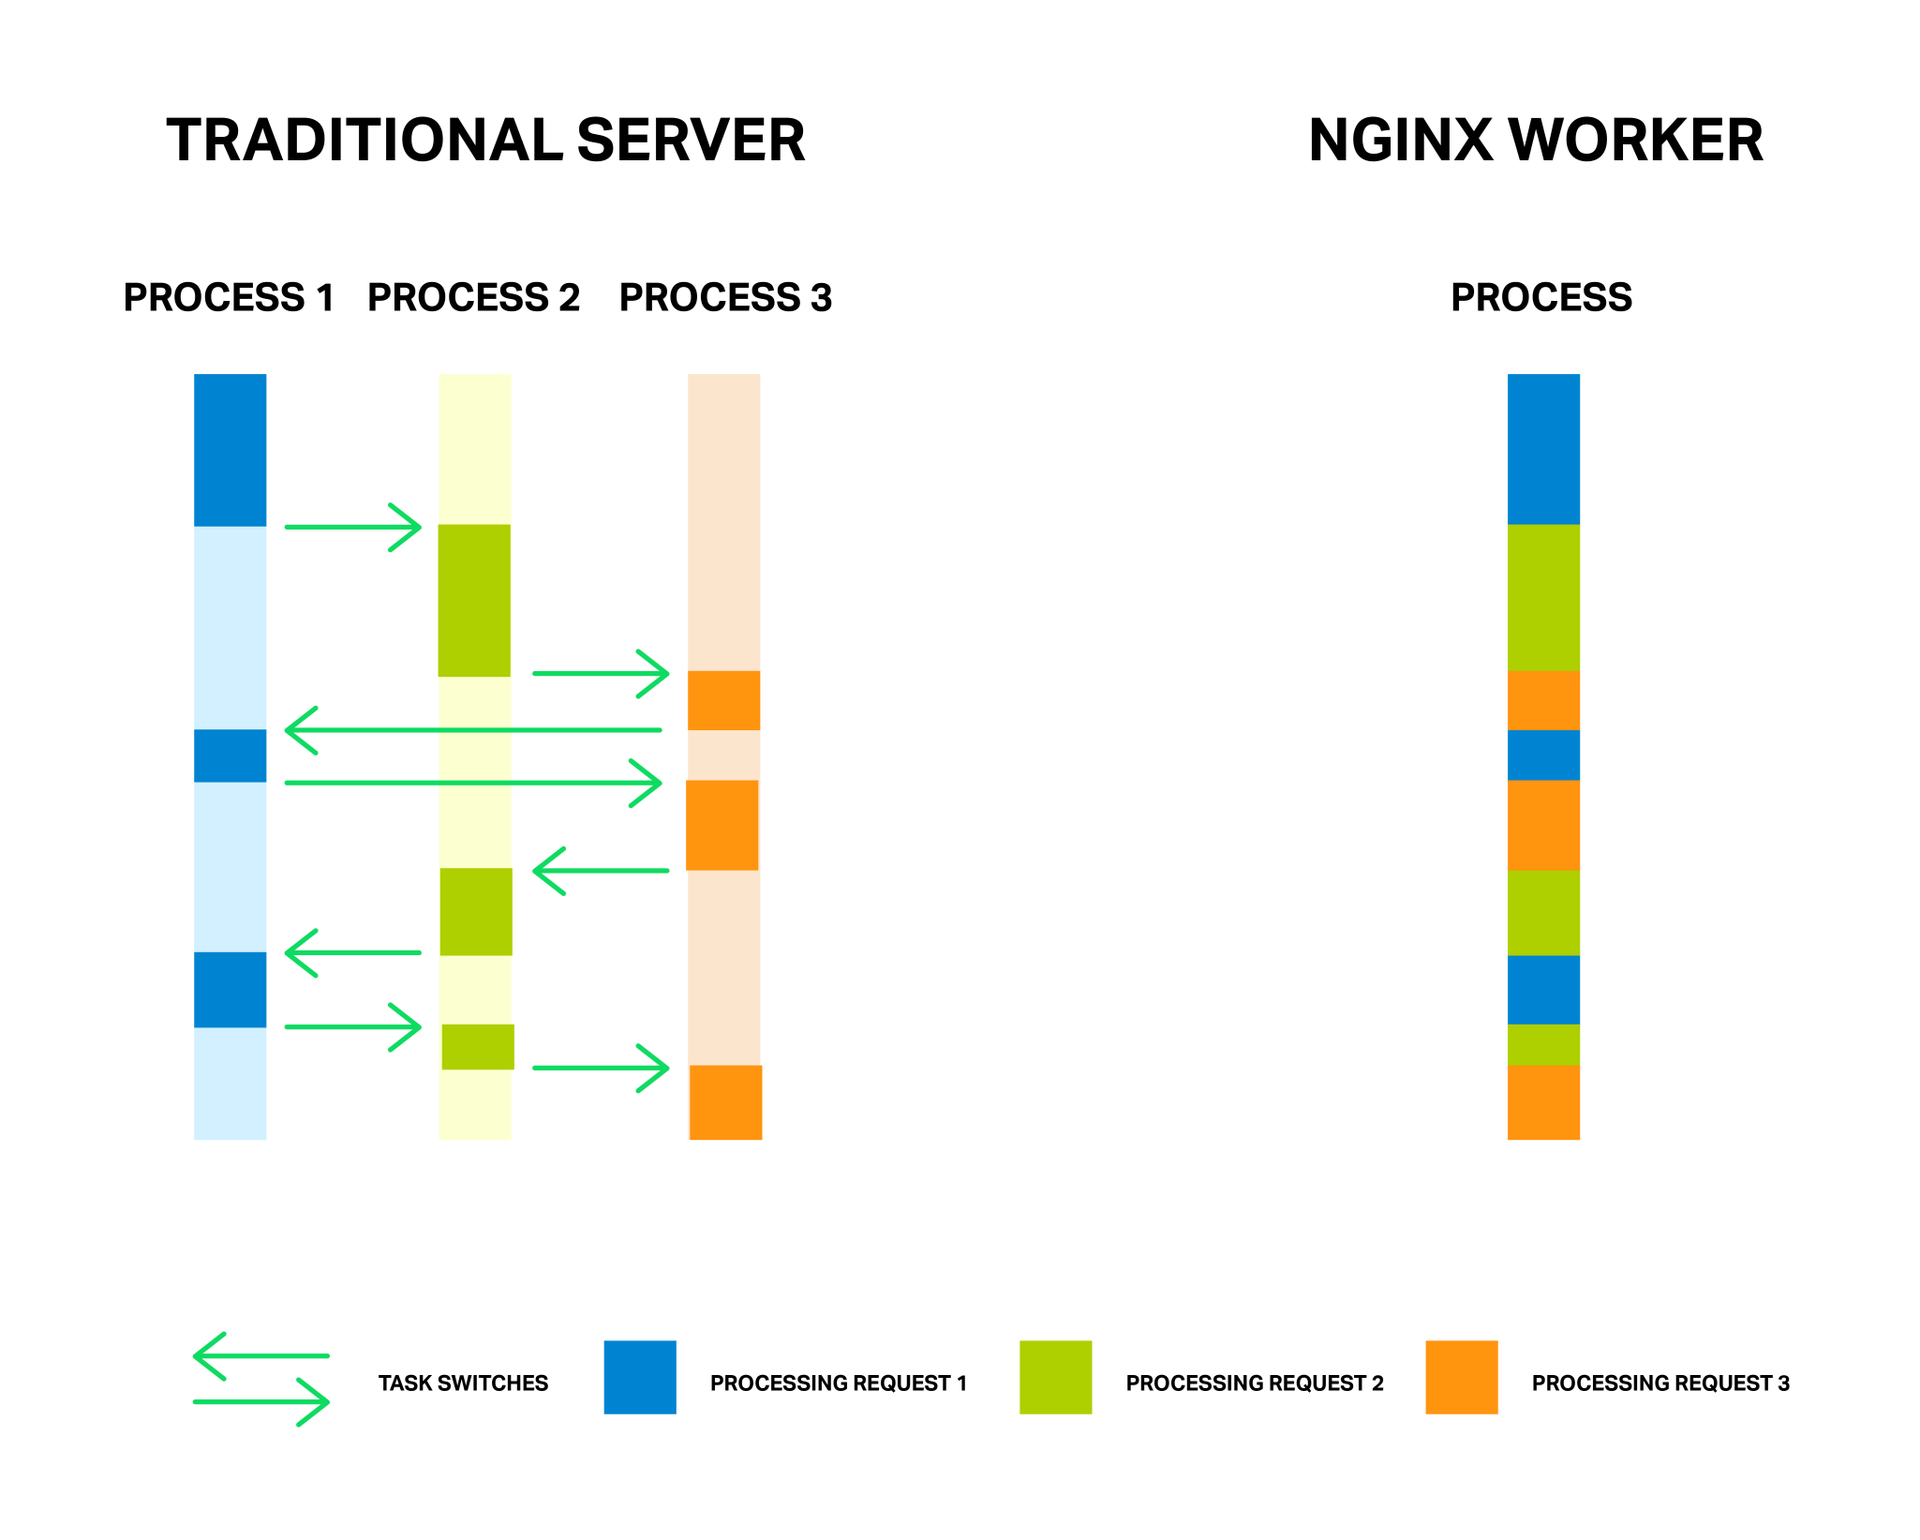 Each process consumes memory and each switch between them requires additional processor cycles, and also leads to the leaching of L-caches.
')
The medal has a downside. The main problem of the asynchronous approach, and it is better to even say “enemy” - is blocking operations. And, unfortunately, many authors of third-party modules, not understanding the principles of operation of NGINX, are trying to perform blocking operations in their modules. Such operations can completely kill the performance of NGINX and should be avoided at all costs.
But even in the current implementation of NGINX, it is not always possible to avoid locks. And to solve this problem, NGINX version 1.7.11 introduced a new “thread pool” mechanism. What it is and how to apply it will be discussed further, and for the beginning we will get acquainted with our enemy in person.
For a better understanding of the problem, let us first understand in more detail the main points about how NGINX works.
According to the principle of operation of NGINX, it is such an event handler, a controller that receives information from the kernel about all events that have occurred in connections, and then gives commands to the operating system, what to do. In fact, NGINX solves the most difficult task of manipulating system resources, and the operating system does the whole routine, reading and sending bytes of information. So it is very important how quickly and in a timely manner NGINX workflow will react to events.
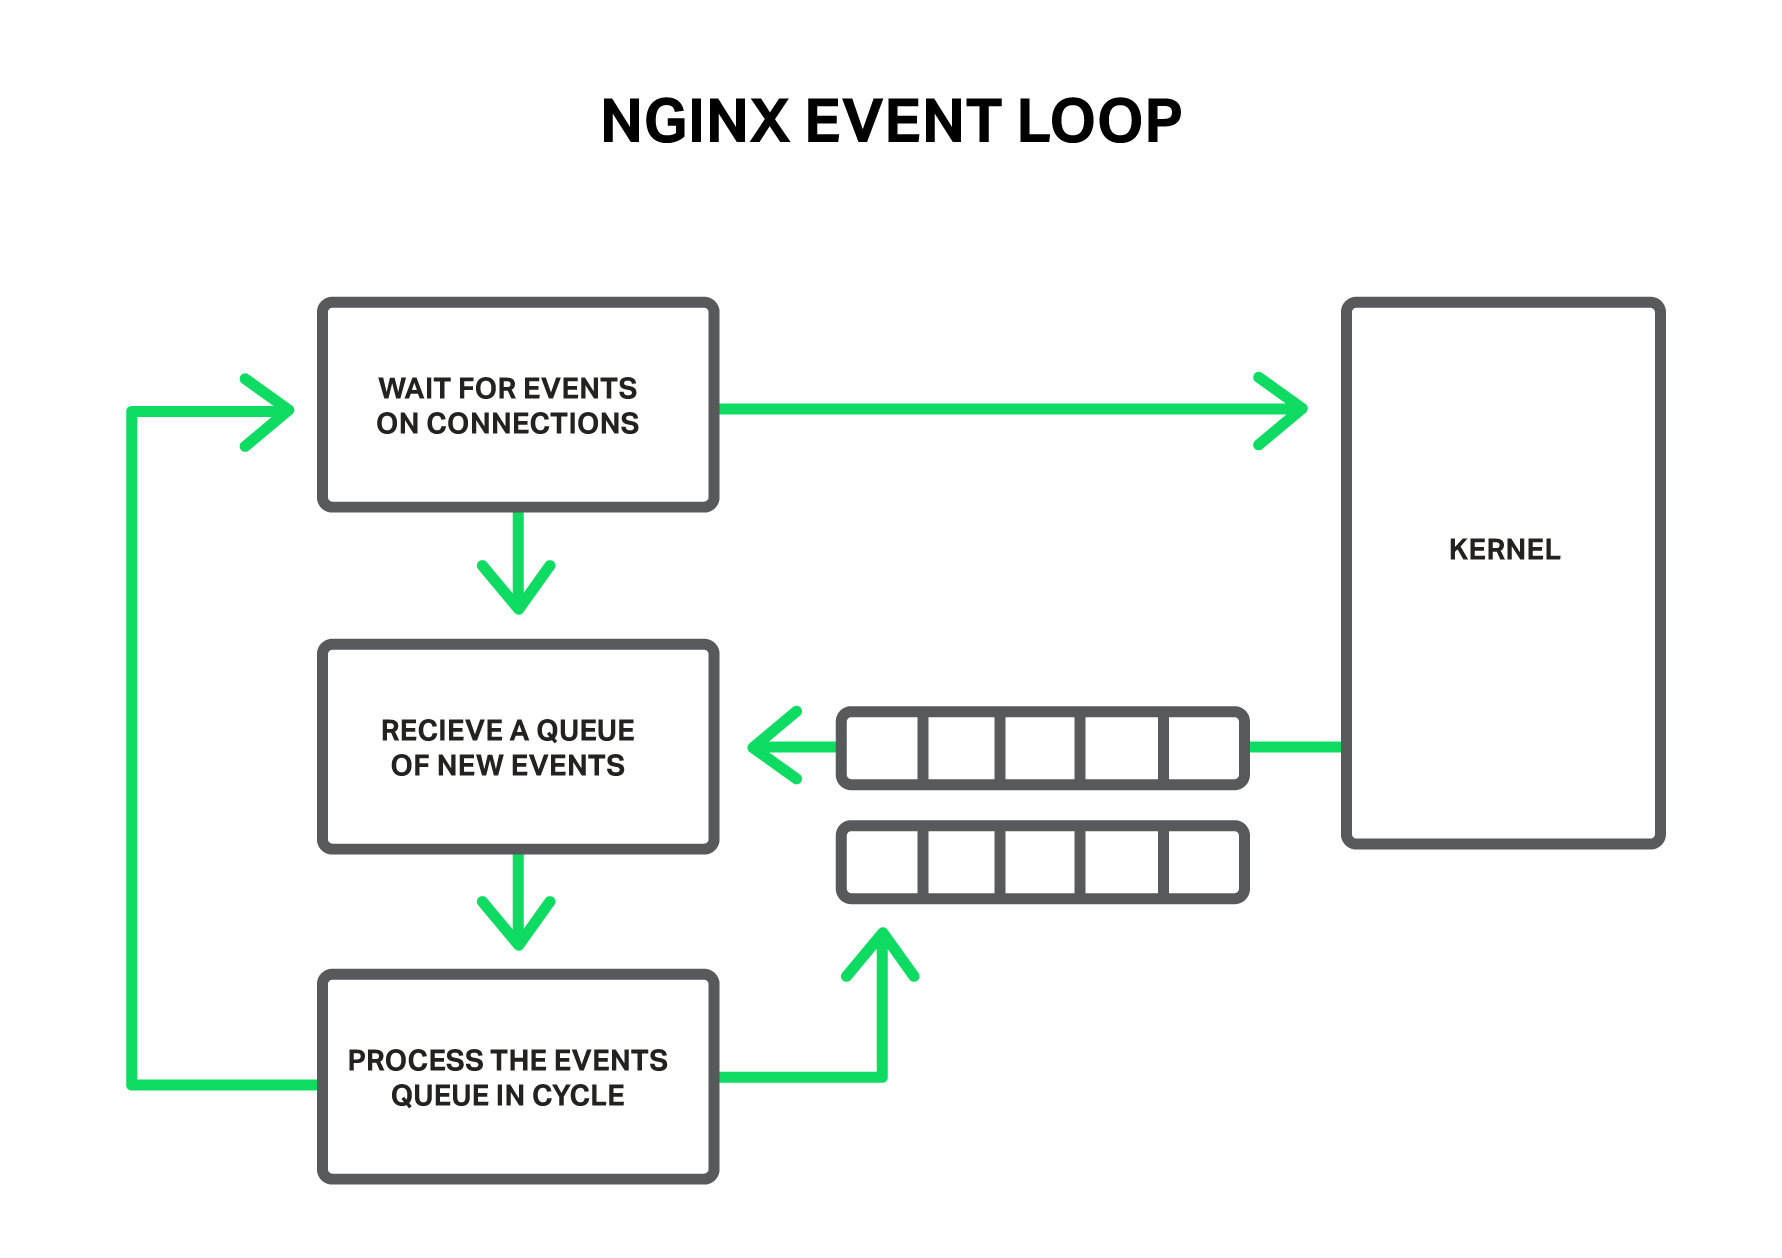 The workflow receives events from the kernel and processes them.
These events can be: timer events, receipt of new data or sending a response and freeing up space in the buffer, notifying about errors in the connection or closing it. NGINX receives a stack of such events and begins to process them in turn, performing the necessary actions. So all event queue processing happens in a simple loop in one thread. NGINX retrieves events one by one from the queue and performs some actions, for example, writes data to the socket or reads it. In most cases, this happens so quickly (most often it is just copying small amounts of data in memory) that you can consider the processing of all events instantaneous.
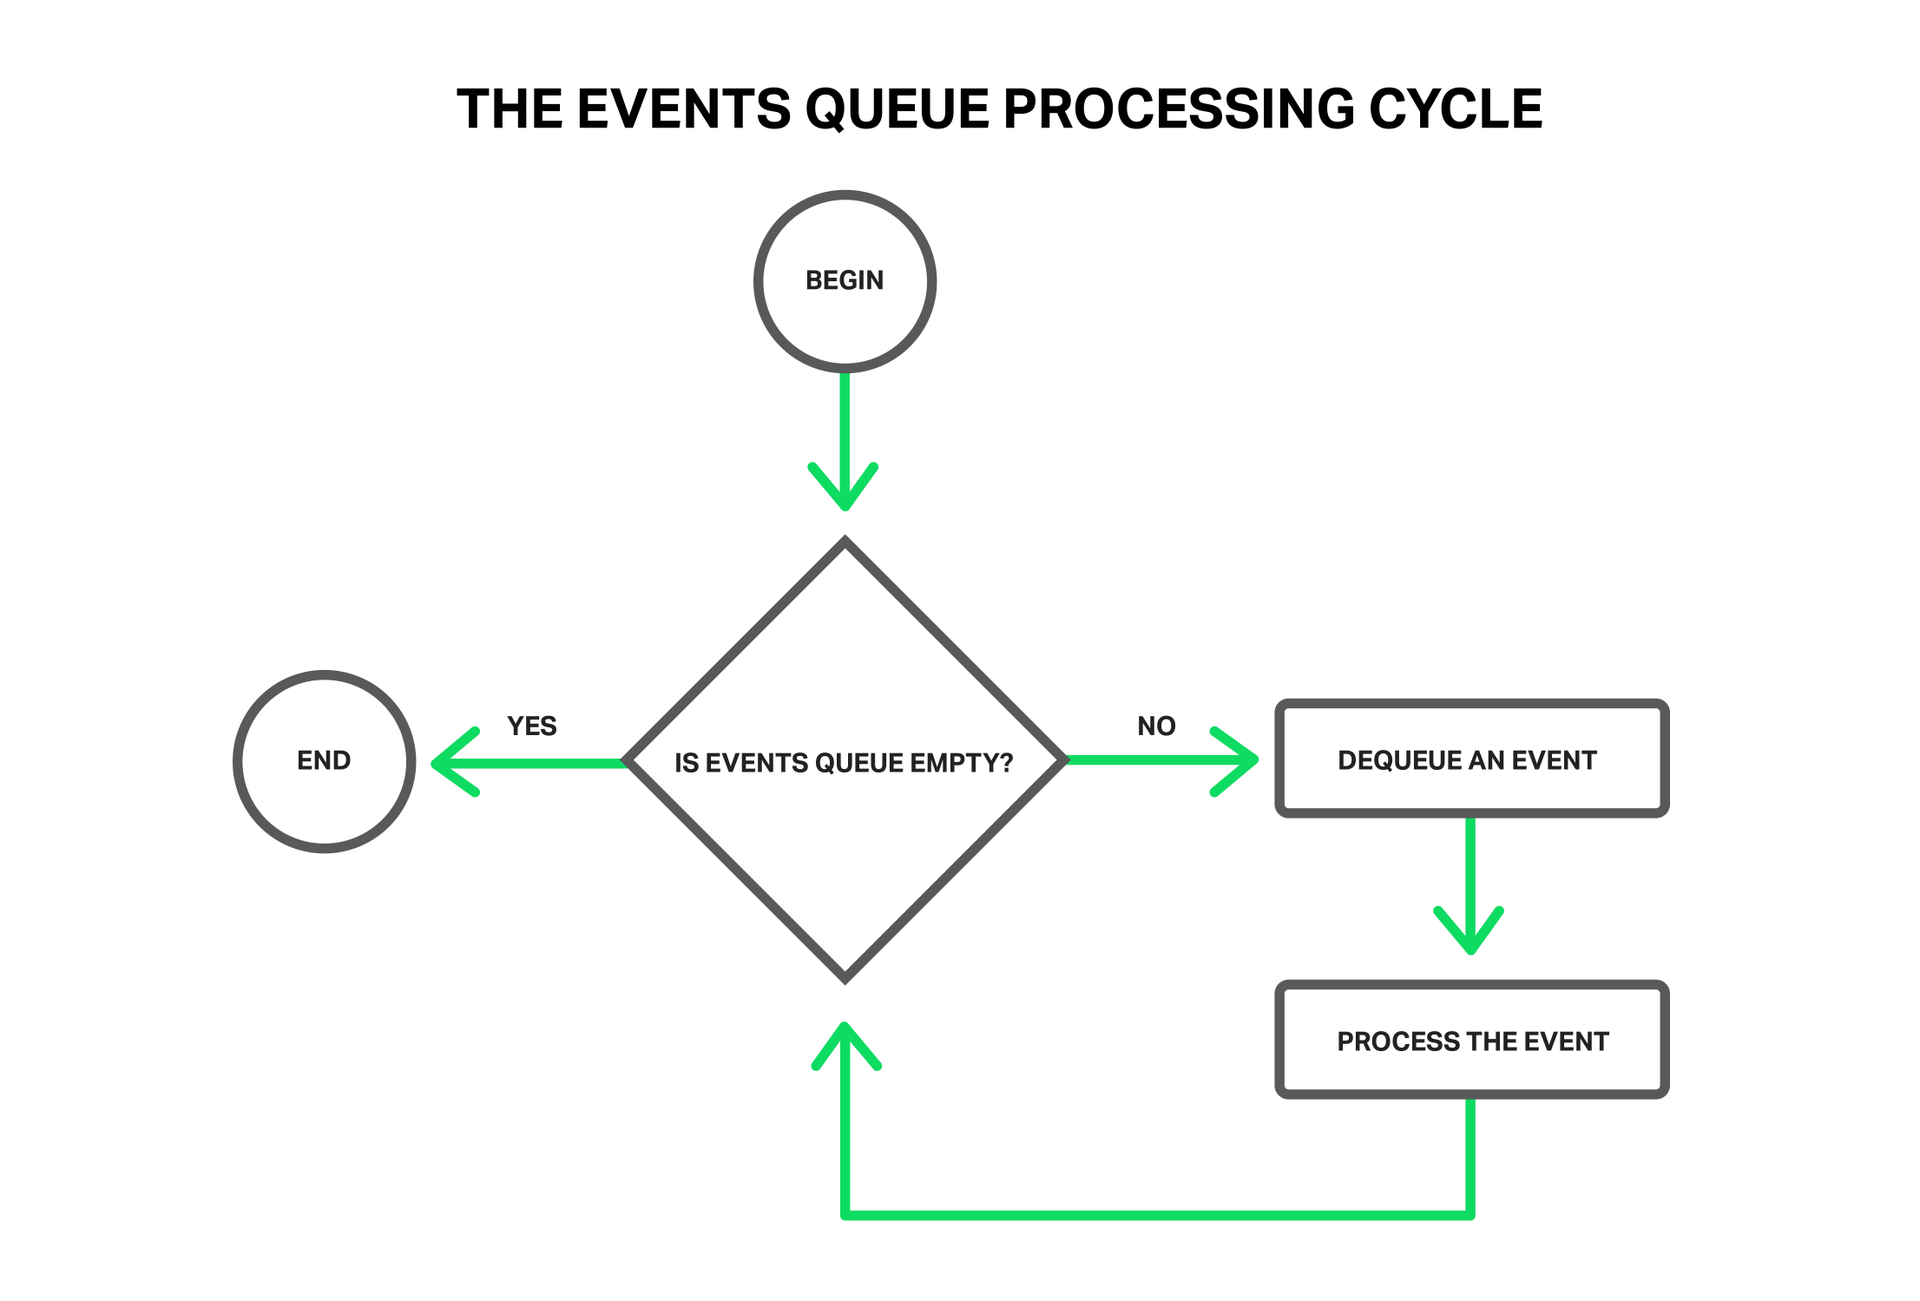 All processing is a simple cycle in one thread.
But what happens if you try to perform some kind of long and difficult operation? The entire event loop will stop waiting for this operation to complete.
Thus, by a blocking operation, we mean any operation that delays the event processing cycle for a substantial time. Operations can be called blocking for various reasons. For example, NGINX can be busy with a long resource-intensive computational operation, or it can wait for access to some resource (hard disk, mutex, library call, waiting for a response from the database in synchronous mode, etc.). The key point here is that during the execution of these operations, the workflow cannot do anything more useful, cannot process other events, although we often have free resources and events that are waiting further in the queue can use them.
Imagine the seller in the store, which lined up a huge line of buyers. And so the first person in the queue comes up to the checkout and wants to buy goods that are not in the shop window, but are in a distant warehouse. The seller asks to wait a couple of hours and leaves the warehouse for the goods. Can you imagine the reaction of the other customers standing in line? Now their waiting time has increased by these two hours, although for many what they need lies a few meters on the counter.
 The entire queue is forced to wait for the execution of the order for the first buyer.
A similar situation occurs in NGINX, when the file to be sent is not in memory, but on the hard disk. The drives are slow (especially those that rotate), and the rest of the requests that are waiting to be processed in the queue may not require access to the hard disk, but still have to wait. As a result, delays grow and system resources may not be fully utilized.
 Only one blocking operation can significantly delay the processing of all subsequent ones.
Some operating systems provide interfaces for asynchronous reading of files and NGINX is able to effectively use them (see the description of the aio directive). A good example of such a system is FreeBSD. Unfortunately, the same cannot be said about Linux. Although there is a certain asynchronous interface for reading files in Linux, it does have some significant drawbacks. One such requirement is the alignment of reads and buffers. NGINX copes with this successfully, but the second problem is worse. Asynchronous reads require the
In particular, to solve this problem, NGINX 1.7.11 introduced a new thread pooling mechanism. They are not yet included in NGINX Plus, but you can contact the sales department if you want to try out the NGINX Plus R6 build with thread pools.
And now let's take a closer look at what they are and how they function.
Let's return to our unlucky seller. But this time he turned out to be resourceful (or is it after he was beaten up by angry customers?) And organized a courier service. Now, when the buyer requests a product that is not on the counter, instead of leaving the counter, going to get the goods on his own and forcing everyone else to wait, he sends a request for delivery of the goods to the courier service and continues to serve the customers' turn. Thus, only those buyers whose orders were not in the store are awaiting delivery, and in the meantime the seller can serve the others without problems.
 Order processing by courier service does not block the queue.
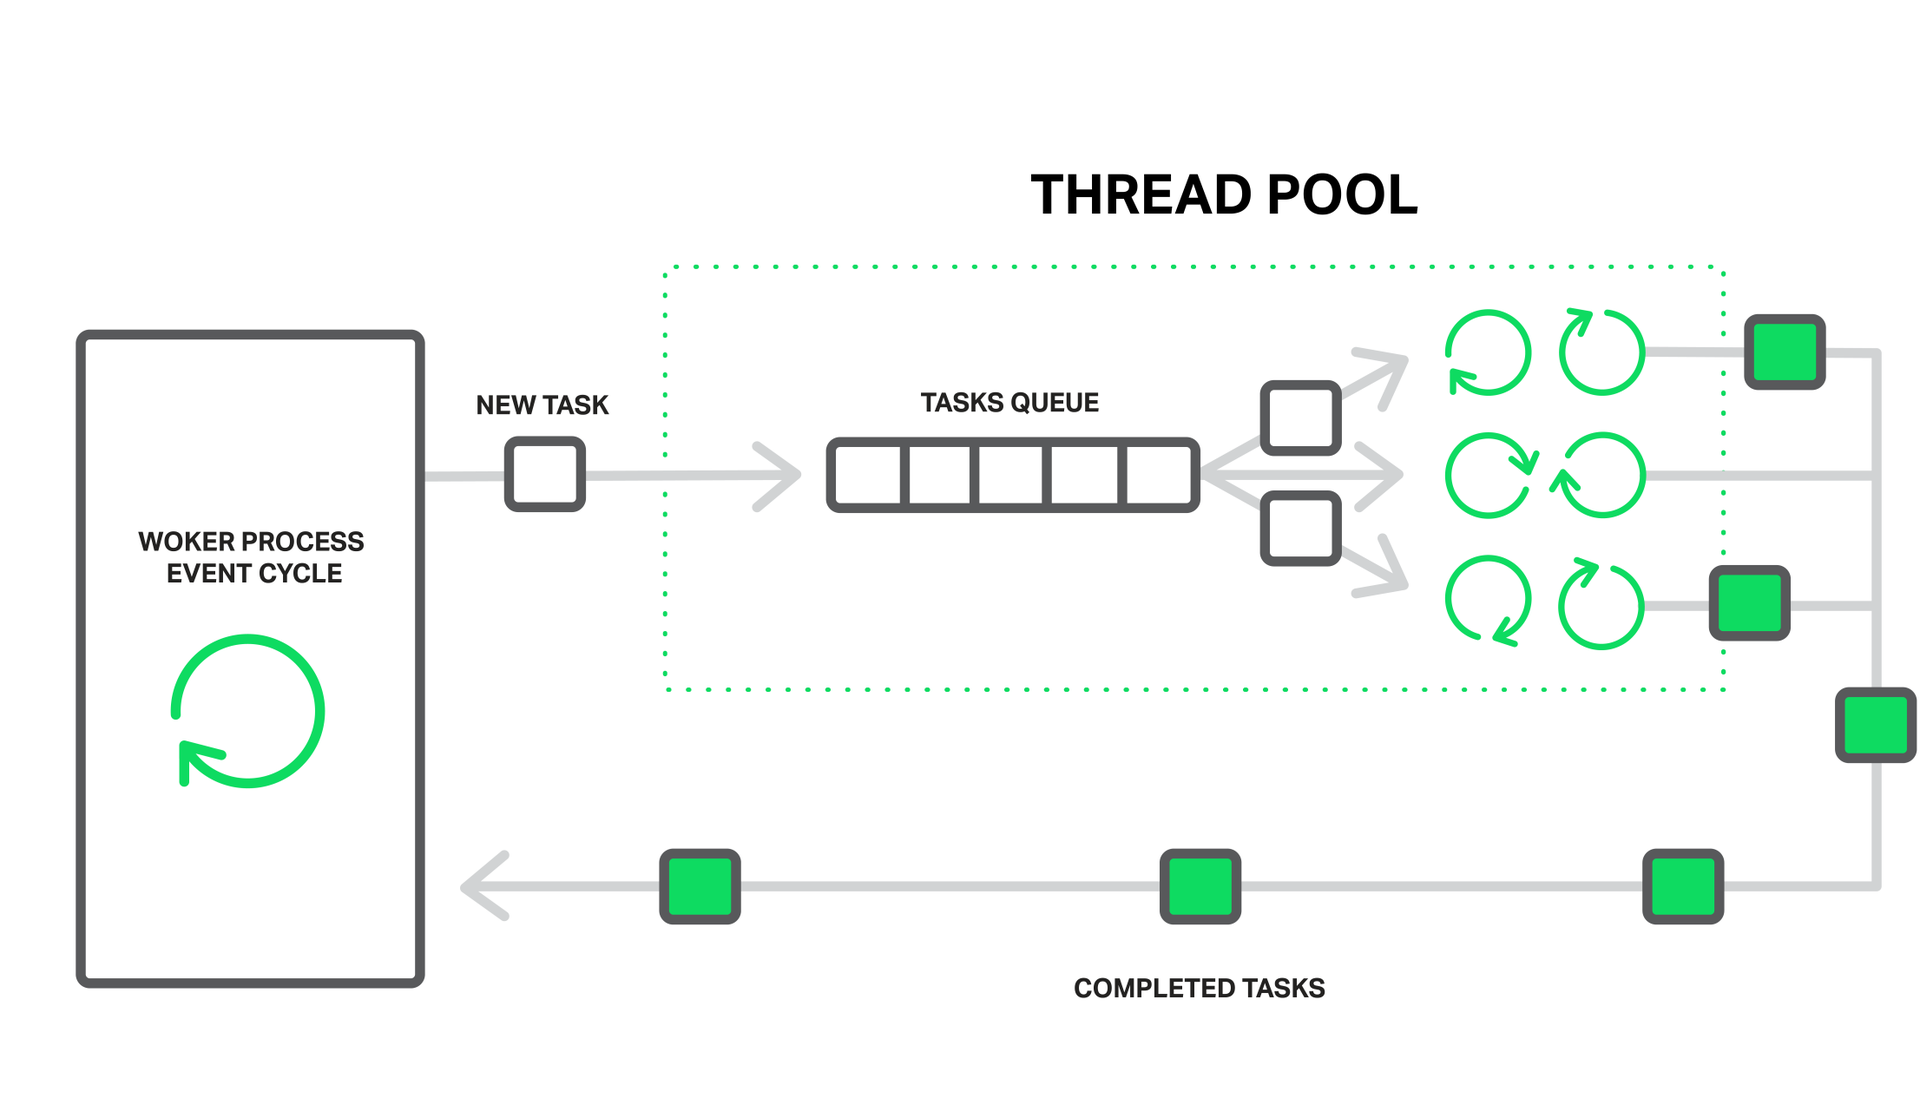
In the case of NGINX, the thread pool serves as a courier service. It consists of a queue of tasks and a set of separate lightweight threads that process this queue. When a workflow needs to perform some kind of potentially long operation, instead of doing it on its own, it places the processing task in the pool queue, from where it can immediately be taken by any free flow to processing.
 The workflow pushes the blocking operations to the thread pool.
It seems that here we have another line formed. And there is. But in this case, this queue is limited to a specific resource. We can not read from the disk faster than he is capable of it, but at least waiting for reading now does not delay the processing of other events.
Reading from disk is taken as the most frequent example of a blocking operation, but in fact, thread pools in NGINX can also be used for any other tasks that are not rational to perform within the main working cycle.
Currently, uploading operations to a thread pool is implemented only for the read () system call on most operating systems, as well as for sendfile () on Linux. We will continue to study this issue and, probably, in the future we will implement the execution of other operations by the thread pool, if this gives a performance benefit.
It's time to move from theory to practice. To demonstrate the effect of using thread pools, we will conduct a small experiment. Namely, we will recreate the most difficult conditions, forcing NGINX to perform a mixture of blocking and non-blocking reads, when the problem of locks on disk accesses is fully manifested.
This requires a dataset that is guaranteed not to fit in the cache of the operating system. On a machine with 48 GB of RAM, 256 GB of 4 MB files each containing random data were generated and NGINX version 1.9.0 was launched to distribute them.
The configuration is quite simple:
As you can see, in order to get the best performance, a small tuning was performed: logging is disabled, accept_mutex is disabled, sendfile is enabled , and sendfile_max_chunk is configured. The latter allows you to reduce the blocking time on the
The machine is equipped with two Intel Xeon E5645 processors (12 cores in total, 24 HyperThreading threads) and a 10 Gbps network interface. The disk subsystem consists of 4 Western Digital WD1003FBYX hard drives combined into a RAID10 array. All this is controlled by the operating system Ubuntu Server 14.04.1 LTS.
 Testbed configuration
The clients are two similar machines. On one of them, wrk is running, creating a constant load with a Lua script. The script requests files from the repository in random order using 200 parallel connections. We call this load parasitic.
From another client machine, we will run
We will measure performance by
So, the first run without the use of thread pools shows very modest results:
As can be seen with this configuration and under such a load, the server is able to issue about one gigabit per second. At the same time, you can observe in the top that all NGINX workflows are in blocking mode for I / O most of the time (marked with the letter
In this case, everything depends on the performance of the disk subsystem, while the processor is idle most of the time. The
Enough substantial delays even in the distribution of only one file from the memory. All workflows are busy reading from a disk to service 200 connections from the first machine, which creates a parasitic load, and cannot process these test requests in a timely manner.
And now we will connect the thread pool, for which we will add the
and ask our NGINX to reload the configuration.
Repeat the test:
Now our server issues 9.5 Gbit / s (against ~ 1 Gbit / s without thread pools)!
He could probably give more, but this is a practical limit for this network interface and NGINX comes up against network bandwidth. Workflows sleep most of the time while waiting for events (they are in state
And we still have a solid supply of processor resources.
Results
The average upload time of 4 MB of the file was reduced from 7.42 seconds to 226.32 milliseconds, i.e. about 33 times, and the number of requests processed per second increased 31 times (250 vs. 8)!
This is explained by the fact that now requests are no longer waiting in the processing queue while workflows are blocked from reading from disk, but are being serviced by free threads. And while the disk subsystem does its job as best it can, serving our “spurious” traffic from the first machine, NGINX uses the remaining processor resources and network bandwidth to serve the second client from memory.
After all the scary stories about blocking operations and such amazing results, many of you will want to turn on thread pools on your servers sooner. Do not hurry.
The truth is that, fortunately, in most cases file operations do not lead to reading from a slow hard disk. If you have enough RAM, then modern operating systems are smart enough to cache files that are often accessed in the so-called page cache.
The page cache is doing quite well and it has always allowed NGINX to demonstrate high performance in the most common situations. Reads from the page cache occur very quickly and such an operation cannot be called blocking. At the same time, interaction with the thread pool incurs additional synchronization costs.
So if you have enough RAM and a small amount of hot data, then you are already doing well and NGINX works in the most optimal way without using thread pools.
In fact, unloading read operations into a separate thread pool solves a rather narrow range of tasks. It is limited to situations where the amount of regularly requested data does not fit in RAM, which makes the cache of the operating system pages ineffective. Such an example could be a highly loaded media distribution service. We simulated this situation in our test.
Unloading read operations into thread pools could be made more versatile for read operations and reduce delays if there was an effective way to know in advance whether the necessary data is in memory or not, and only in the latter case, unload the operation into a separate stream.
Returning to the analogy with the store and distant warehouse, now the seller does not have the opportunity to find out that the goods are on display and he is always forced to work through the courier service.
The fact is that there is no adequate support from the core of the operating system. The first attempts to add this feature in Linux in the form of the fincore () system call refer to 2010, but “ things are still there”. Later there were attempts in the form of the
While FreeBSD users have nothing to worry about, they have a good working asynchronous read mechanism implemented in the kernel. This is what is recommended to use instead of thread pools.
So, if you firmly believe that you can benefit from the thread pool for your tasks, then the question of how to enable and configure it will certainly arise.
The configuration is quite simple and at the same time very flexible. First you need NGINX version 1.7.11 or higher, compiled with the
This is the minimum possible option for setting thread pools. In fact, it is a shortened version of this configuration:
It sets the
This is possible if your threads do not cope with the amount of work and the queue is filled faster than it is processed. In this case, you can try to increase the maximum queue size, and if this does not help, then your system simply cannot handle such a large number of requests.
As you can see, with the thread_pool directive, you have the ability to set the number of threads, the maximum queue size, and the name of this thread pool. The latter implies the ability to configure several independent pools and use them in different parts of the configuration for different tasks:
If
Now imagine that you have a server with three hard drives that should act as a caching proxy for your backends. In this case, the estimated cache size many times exceeds the amount of available RAM. In fact, this is something like a cache node in your personal content distribution network (CDN). In this case, the main load on returning the cached data will fall on the disk subsystem. Of course, you want to extract the maximum performance from the three disks that are available.
One solution could be to organize a RAID array. This approach certainly has its pros and cons. But today NGINX is ready to offer you a different approach:
In this configuration, three independent caches are used — one for each hard disk, and three independent thread pools, also one for the disk.
To evenly distribute the load between caches (and, accordingly, hard drives), the split_clients module is used , which is perfectly suited for this.
The
All this together allows you to squeeze the maximum performance from this disk subsystem, since NGINX interacts with each disk in parallel and independently through separate thread pools. Each disk is served by 16 independent streams and a separate queue of tasks for reading and sending files is formed for it.
After all, your customers love the individual approach? Be sure your hard drives too. ;)
This example is a demonstration of the tremendous flexibility of NGINX in configuring directly under your hardware. You kind of instruct NGINX how to best interact with the disk subsystem on this server and your data. And such fine tuning, when the software works to the user level in the most optimal way with the equipment, ensures the most efficient use of all the resources of a particular system.
Thread pools are a great mechanism that fights the main and well-known enemy of the asynchronous approach - blocking operations, and thus allows NGINX to be brought to a new level of performance, especially if we are talking about very large amounts of data.
As mentioned earlier, thread pools can be used for any other operations and work with libraries that do not have an asynchronous interface.This potentially opens up new opportunities for the implementation of modules and functionality, the implementation of which, without prejudice to performance, was previously not feasible within a reasonable time. You can spend a lot of time and effort writing an asynchronous version of an existing library or trying to add such an interface, but the question arose: “is the game worth the candle”? With thread pools, this task can be solved much easier by creating modules that work with blocking calls, while not interfering with NGINX to carry out its main task by processing other requests.
So many new and interesting things await NGINX in the future. Stay with us!
Due to the small and constant number of full-weight processing threads (usually one per core), memory savings are achieved, as well as processor resources on context switching. All the advantages of this approach can be well observed by the example of NGINX itself, which is able to process millions of requests at the same time and scale well.
')
The medal has a downside. The main problem of the asynchronous approach, and it is better to even say “enemy” - is blocking operations. And, unfortunately, many authors of third-party modules, not understanding the principles of operation of NGINX, are trying to perform blocking operations in their modules. Such operations can completely kill the performance of NGINX and should be avoided at all costs.
But even in the current implementation of NGINX, it is not always possible to avoid locks. And to solve this problem, NGINX version 1.7.11 introduced a new “thread pool” mechanism. What it is and how to apply it will be discussed further, and for the beginning we will get acquainted with our enemy in person.
Problem
For a better understanding of the problem, let us first understand in more detail the main points about how NGINX works.
According to the principle of operation of NGINX, it is such an event handler, a controller that receives information from the kernel about all events that have occurred in connections, and then gives commands to the operating system, what to do. In fact, NGINX solves the most difficult task of manipulating system resources, and the operating system does the whole routine, reading and sending bytes of information. So it is very important how quickly and in a timely manner NGINX workflow will react to events.
These events can be: timer events, receipt of new data or sending a response and freeing up space in the buffer, notifying about errors in the connection or closing it. NGINX receives a stack of such events and begins to process them in turn, performing the necessary actions. So all event queue processing happens in a simple loop in one thread. NGINX retrieves events one by one from the queue and performs some actions, for example, writes data to the socket or reads it. In most cases, this happens so quickly (most often it is just copying small amounts of data in memory) that you can consider the processing of all events instantaneous.
But what happens if you try to perform some kind of long and difficult operation? The entire event loop will stop waiting for this operation to complete.
Thus, by a blocking operation, we mean any operation that delays the event processing cycle for a substantial time. Operations can be called blocking for various reasons. For example, NGINX can be busy with a long resource-intensive computational operation, or it can wait for access to some resource (hard disk, mutex, library call, waiting for a response from the database in synchronous mode, etc.). The key point here is that during the execution of these operations, the workflow cannot do anything more useful, cannot process other events, although we often have free resources and events that are waiting further in the queue can use them.
Imagine the seller in the store, which lined up a huge line of buyers. And so the first person in the queue comes up to the checkout and wants to buy goods that are not in the shop window, but are in a distant warehouse. The seller asks to wait a couple of hours and leaves the warehouse for the goods. Can you imagine the reaction of the other customers standing in line? Now their waiting time has increased by these two hours, although for many what they need lies a few meters on the counter.
A similar situation occurs in NGINX, when the file to be sent is not in memory, but on the hard disk. The drives are slow (especially those that rotate), and the rest of the requests that are waiting to be processed in the queue may not require access to the hard disk, but still have to wait. As a result, delays grow and system resources may not be fully utilized.
Some operating systems provide interfaces for asynchronous reading of files and NGINX is able to effectively use them (see the description of the aio directive). A good example of such a system is FreeBSD. Unfortunately, the same cannot be said about Linux. Although there is a certain asynchronous interface for reading files in Linux, it does have some significant drawbacks. One such requirement is the alignment of reads and buffers. NGINX copes with this successfully, but the second problem is worse. Asynchronous reads require the
O_DIRECT flag on the file descriptor. This means that all data will be read from disk bypassing the cache of the operating system pages (so-called page cache ), which in many cases is not optimal and significantly increases the load on the disk subsystem.In particular, to solve this problem, NGINX 1.7.11 introduced a new thread pooling mechanism. They are not yet included in NGINX Plus, but you can contact the sales department if you want to try out the NGINX Plus R6 build with thread pools.
And now let's take a closer look at what they are and how they function.
Thread pools
Let's return to our unlucky seller. But this time he turned out to be resourceful (or is it after he was beaten up by angry customers?) And organized a courier service. Now, when the buyer requests a product that is not on the counter, instead of leaving the counter, going to get the goods on his own and forcing everyone else to wait, he sends a request for delivery of the goods to the courier service and continues to serve the customers' turn. Thus, only those buyers whose orders were not in the store are awaiting delivery, and in the meantime the seller can serve the others without problems.
In the case of NGINX, the thread pool serves as a courier service. It consists of a queue of tasks and a set of separate lightweight threads that process this queue. When a workflow needs to perform some kind of potentially long operation, instead of doing it on its own, it places the processing task in the pool queue, from where it can immediately be taken by any free flow to processing.
It seems that here we have another line formed. And there is. But in this case, this queue is limited to a specific resource. We can not read from the disk faster than he is capable of it, but at least waiting for reading now does not delay the processing of other events.
Reading from disk is taken as the most frequent example of a blocking operation, but in fact, thread pools in NGINX can also be used for any other tasks that are not rational to perform within the main working cycle.
Currently, uploading operations to a thread pool is implemented only for the read () system call on most operating systems, as well as for sendfile () on Linux. We will continue to study this issue and, probably, in the future we will implement the execution of other operations by the thread pool, if this gives a performance benefit.
Testing performance
It's time to move from theory to practice. To demonstrate the effect of using thread pools, we will conduct a small experiment. Namely, we will recreate the most difficult conditions, forcing NGINX to perform a mixture of blocking and non-blocking reads, when the problem of locks on disk accesses is fully manifested.
This requires a dataset that is guaranteed not to fit in the cache of the operating system. On a machine with 48 GB of RAM, 256 GB of 4 MB files each containing random data were generated and NGINX version 1.9.0 was launched to distribute them.
The configuration is quite simple:
worker_processes 16; events { accept_mutex off; } http { include mime.types; default_type application/octet-stream; access_log off; sendfile on; sendfile_max_chunk 512k; server { listen 8000; location / { root /storage; } } } As you can see, in order to get the best performance, a small tuning was performed: logging is disabled, accept_mutex is disabled, sendfile is enabled , and sendfile_max_chunk is configured. The latter allows you to reduce the blocking time on the
sendfile() call, since in this case NGINX will not attempt to read and send the entire file at once, but will do so in parts of 512 kilobytes.The machine is equipped with two Intel Xeon E5645 processors (12 cores in total, 24 HyperThreading threads) and a 10 Gbps network interface. The disk subsystem consists of 4 Western Digital WD1003FBYX hard drives combined into a RAID10 array. All this is controlled by the operating system Ubuntu Server 14.04.1 LTS.
The clients are two similar machines. On one of them, wrk is running, creating a constant load with a Lua script. The script requests files from the repository in random order using 200 parallel connections. We call this load parasitic.
From another client machine, we will run
wrk , which will request the same file in 50 threads. Since this file is constantly being accessed, then, unlike files that are requested in random order, it will not have time to be flushed from the operating system cache and its reading will always come from memory. Let's call this load test.We will measure performance by
ifstat indicators on the server and wrk statistics from the second client machine.So, the first run without the use of thread pools shows very modest results:
% ifstat -bi eth2 eth2 Kbps in Kbps out 5531.24 1.03e+06 4855.23 812922.7 5994.66 1.07e+06 5476.27 981529.3 6353.62 1.12e+06 5166.17 892770.3 5522.81 978540.8 6208.10 985466.7 6370.79 1.12e+06 6123.33 1.07e+06 As can be seen with this configuration and under such a load, the server is able to issue about one gigabit per second. At the same time, you can observe in the top that all NGINX workflows are in blocking mode for I / O most of the time (marked with the letter
D ): top - 10:40:47 up 11 days, 1:32, 1 user, load average: 49.61, 45.77 62.89 Tasks: 375 total, 2 running, 373 sleeping, 0 stopped, 0 zombie %Cpu(s): 0.0 us, 0.3 sy, 0.0 ni, 67.7 id, 31.9 wa, 0.0 hi, 0.0 si, 0.0 st KiB Mem: 49453440 total, 49149308 used, 304132 free, 98780 buffers KiB Swap: 10474236 total, 20124 used, 10454112 free, 46903412 cached Mem PID USER PR NI VIRT RES SHR S %CPU %MEM TIME+ COMMAND 4639 vbart 20 0 47180 28152 496 D 0.7 0.1 0:00.17 nginx 4632 vbart 20 0 47180 28196 536 D 0.3 0.1 0:00.11 nginx 4633 vbart 20 0 47180 28324 540 D 0.3 0.1 0:00.11 nginx 4635 vbart 20 0 47180 28136 480 D 0.3 0.1 0:00.12 nginx 4636 vbart 20 0 47180 28208 536 D 0.3 0.1 0:00.14 nginx 4637 vbart 20 0 47180 28208 536 D 0.3 0.1 0:00.10 nginx 4638 vbart 20 0 47180 28204 536 D 0.3 0.1 0:00.12 nginx 4640 vbart 20 0 47180 28324 540 D 0.3 0.1 0:00.13 nginx 4641 vbart 20 0 47180 28324 540 D 0.3 0.1 0:00.13 nginx 4642 vbart 20 0 47180 28208 536 D 0.3 0.1 0:00.11 nginx 4643 vbart 20 0 47180 28276 536 D 0.3 0.1 0:00.29 nginx 4644 vbart 20 0 47180 28204 536 D 0.3 0.1 0:00.11 nginx 4645 vbart 20 0 47180 28204 536 D 0.3 0.1 0:00.17 nginx 4646 vbart 20 0 47180 28204 536 D 0.3 0.1 0:00.12 nginx 4647 vbart 20 0 47180 28208 532 D 0.3 0.1 0:00.17 nginx 4631 vbart 20 0 47180 756 252 S 0.0 0.1 0:00.00 nginx 4634 vbart 20 0 47180 28208 536 D 0.0 0.1 0:00.11 nginx 4648 vbart 20 0 25232 1956 1160 R 0.0 0.0 0:00.08 top 25921 vbart 20 0 121956 2232 1056 S 0.0 0.0 0:01.97 sshd 25923 vbart 20 0 40304 4160 2208 S 0.0 0.0 0:00.53 zsh In this case, everything depends on the performance of the disk subsystem, while the processor is idle most of the time. The
wrk results are also not comforting: Running 1m test @ http://192.0.2.1:8000/1/1/1 12 threads and 50 connections Thread Stats Avg Stdev Max +/- Stdev Latency 7.42s 5.31s 24.41s 74.73% Req/Sec 0.15 0.36 1.00 84.62% 488 requests in 1.01m, 2.01GB read Requests/sec: 8.08 Transfer/sec: 34.07MB Enough substantial delays even in the distribution of only one file from the memory. All workflows are busy reading from a disk to service 200 connections from the first machine, which creates a parasitic load, and cannot process these test requests in a timely manner.
And now we will connect the thread pool, for which we will add the
aio threads directive to the location block with the storage: location / { root /storage; aio threads; } and ask our NGINX to reload the configuration.
Repeat the test:
% ifstat -bi eth2 eth2 Kbps in Kbps out 60915.19 9.51e+06 59978.89 9.51e+06 60122.38 9.51e+06 61179.06 9.51e+06 61798.40 9.51e+06 57072.97 9.50e+06 56072.61 9.51e+06 61279.63 9.51e+06 61243.54 9.51e+06 59632.50 9.50e+06 Now our server issues 9.5 Gbit / s (against ~ 1 Gbit / s without thread pools)!
He could probably give more, but this is a practical limit for this network interface and NGINX comes up against network bandwidth. Workflows sleep most of the time while waiting for events (they are in state
S ): top - 10:43:17 up 11 days, 1:35, 1 user, load average: 172.71, 93.84, 77.90 Tasks: 376 total, 1 running, 375 sleeping, 0 stopped, 0 zombie %Cpu(s): 0.2 us, 1.2 sy, 0.0 ni, 34.8 id, 61.5 wa, 0.0 hi, 2.3 si, 0.0 st KiB Mem: 49453440 total, 49096836 used, 356604 free, 97236 buffers KiB Swap: 10474236 total, 22860 used, 10451376 free, 46836580 cached Mem PID USER PR NI VIRT RES SHR S %CPU %MEM TIME+ COMMAND 4654 vbart 20 0 309708 28844 596 S 9.0 0.1 0:08.65 nginx 4660 vbart 20 0 309748 28920 596 S 6.6 0.1 0:14.82 nginx 4658 vbart 20 0 309452 28424 520 S 4.3 0.1 0:01.40 nginx 4663 vbart 20 0 309452 28476 572 S 4.3 0.1 0:01.32 nginx 4667 vbart 20 0 309584 28712 588 S 3.7 0.1 0:05.19 nginx 4656 vbart 20 0 309452 28476 572 S 3.3 0.1 0:01.84 nginx 4664 vbart 20 0 309452 28428 524 S 3.3 0.1 0:01.29 nginx 4652 vbart 20 0 309452 28476 572 S 3.0 0.1 0:01.46 nginx 4662 vbart 20 0 309552 28700 596 S 2.7 0.1 0:05.92 nginx 4661 vbart 20 0 309464 28636 596 S 2.3 0.1 0:01.59 nginx 4653 vbart 20 0 309452 28476 572 S 1.7 0.1 0:01.70 nginx 4666 vbart 20 0 309452 28428 524 S 1.3 0.1 0:01.63 nginx 4657 vbart 20 0 309584 28696 592 S 1.0 0.1 0:00.64 nginx 4655 vbart 20 0 30958 28476 572 S 0.7 0.1 0:02.81 nginx 4659 vbart 20 0 309452 28468 564 S 0.3 0.1 0:01.20 nginx 4665 vbart 20 0 309452 28476 572 S 0.3 0.1 0:00.71 nginx 5180 vbart 20 0 25232 1952 1156 R 0.0 0.0 0:00.45 top 4651 vbart 20 0 20032 752 252 S 0.0 0.0 0:00.00 nginx 25921 vbart 20 0 121956 2176 1000 S 0.0 0.0 0:01.98 sshd 25923 vbart 20 0 40304 3840 2208 S 0.0 0.0 0:00.54 zsh And we still have a solid supply of processor resources.
Results
wrk from the second machine: Running 1m test @ http://192.0.2.1:8000/1/1/1 12 threads and 50 connections Thread Stats Avg Stdev Max +/- Stdev Latency 226.32ms 392.76ms 1.72s 93.48% Req/Sec 20.02 10.84 59.00 65.91% 15045 requests in 1.00m, 58.86GB read Requests/sec: 250.57 Transfer/sec: 0.98GB The average upload time of 4 MB of the file was reduced from 7.42 seconds to 226.32 milliseconds, i.e. about 33 times, and the number of requests processed per second increased 31 times (250 vs. 8)!
This is explained by the fact that now requests are no longer waiting in the processing queue while workflows are blocked from reading from disk, but are being serviced by free threads. And while the disk subsystem does its job as best it can, serving our “spurious” traffic from the first machine, NGINX uses the remaining processor resources and network bandwidth to serve the second client from memory.
Silver bullet does not exist
After all the scary stories about blocking operations and such amazing results, many of you will want to turn on thread pools on your servers sooner. Do not hurry.
The truth is that, fortunately, in most cases file operations do not lead to reading from a slow hard disk. If you have enough RAM, then modern operating systems are smart enough to cache files that are often accessed in the so-called page cache.
The page cache is doing quite well and it has always allowed NGINX to demonstrate high performance in the most common situations. Reads from the page cache occur very quickly and such an operation cannot be called blocking. At the same time, interaction with the thread pool incurs additional synchronization costs.
So if you have enough RAM and a small amount of hot data, then you are already doing well and NGINX works in the most optimal way without using thread pools.
In fact, unloading read operations into a separate thread pool solves a rather narrow range of tasks. It is limited to situations where the amount of regularly requested data does not fit in RAM, which makes the cache of the operating system pages ineffective. Such an example could be a highly loaded media distribution service. We simulated this situation in our test.
Unloading read operations into thread pools could be made more versatile for read operations and reduce delays if there was an effective way to know in advance whether the necessary data is in memory or not, and only in the latter case, unload the operation into a separate stream.
Returning to the analogy with the store and distant warehouse, now the seller does not have the opportunity to find out that the goods are on display and he is always forced to work through the courier service.
The fact is that there is no adequate support from the core of the operating system. The first attempts to add this feature in Linux in the form of the fincore () system call refer to 2010, but “ things are still there”. Later there were attempts in the form of the
preadv2() system call and the RWF_NONBLOCK flag (details can be found in the articles Non-blocking buffered file read operations and Asynchronous buffered read operations on LWN.net) - but the fate of these patches is still in question. Sadly, the blame for all this seems to be the notorious bikching (disputes about what color markers smell better).While FreeBSD users have nothing to worry about, they have a good working asynchronous read mechanism implemented in the kernel. This is what is recommended to use instead of thread pools.
Configuration
So, if you firmly believe that you can benefit from the thread pool for your tasks, then the question of how to enable and configure it will certainly arise.
The configuration is quite simple and at the same time very flexible. First you need NGINX version 1.7.11 or higher, compiled with the
--with-threads flag. In the simplest case, the setting looks elementary. All that is needed to enable unloading of read operations and sending files to the thread pool is the aio directive at the level of http , server or location , set to the value of threads: aio threads; This is the minimum possible option for setting thread pools. In fact, it is a shortened version of this configuration:
thread_pool default threads=32 max_queue=65536; aio threads=default; It sets the
default thread pool, in which 32 threads will work and the maximum allowed job queue size is 65,536. If the job queue becomes full, NGINX rejects the request and logs the error: thread pool "NAME" queue overflow: N tasks waiting This is possible if your threads do not cope with the amount of work and the queue is filled faster than it is processed. In this case, you can try to increase the maximum queue size, and if this does not help, then your system simply cannot handle such a large number of requests.
As you can see, with the thread_pool directive, you have the ability to set the number of threads, the maximum queue size, and the name of this thread pool. The latter implies the ability to configure several independent pools and use them in different parts of the configuration for different tasks:
thread_pool one threads=128 max_queue=0; thread_pool two threads=32; http { server { location /one { aio threads=one; } location /two { aio threads=two; } } … } If
max_queue not explicitly specified, as in pool two, the default value of 65536 is used. As you can see from the example, you can set the queue size to zero. Then the pool will be able to accept only as many jobs at a time as it has free threads and there will be no jobs waiting in the queue.Now imagine that you have a server with three hard drives that should act as a caching proxy for your backends. In this case, the estimated cache size many times exceeds the amount of available RAM. In fact, this is something like a cache node in your personal content distribution network (CDN). In this case, the main load on returning the cached data will fall on the disk subsystem. Of course, you want to extract the maximum performance from the three disks that are available.
One solution could be to organize a RAID array. This approach certainly has its pros and cons. But today NGINX is ready to offer you a different approach:
# : # /mnt/disk1, /mnt/disk2 /mnt/disk3 thread_pool pool_1 threads=16; thread_pool pool_2 threads=16; thread_pool pool_3 threads=16; http { proxy_cache_path /mnt/disk1 levels=1:2 keys_zone=cache_1:256m max_size=1024G use_temp_path=off; proxy_cache_path /mnt/disk2 levels=1:2 keys_zone=cache_2:256m max_size=1024G use_temp_path=off; proxy_cache_path /mnt/disk3 levels=1:2 keys_zone=cache_3:256m max_size=1024G use_temp_path=off; split_clients $request_uri $disk { 33.3% 1; 33.3% 2; * 3; } server { … location / { proxy_pass http://backend; proxy_cache_key $request_uri; proxy_cache cache_$disk; aio threads=pool_$disk; sendfile on; } } } In this configuration, three independent caches are used — one for each hard disk, and three independent thread pools, also one for the disk.
To evenly distribute the load between caches (and, accordingly, hard drives), the split_clients module is used , which is perfectly suited for this.
The
use_temp_path=off parameter of the use_temp_path=off directive instructs NGINX to save temporary files in the same directory as the cache data. This is necessary to avoid copying data from one disk to another while saving the answer to the cache.All this together allows you to squeeze the maximum performance from this disk subsystem, since NGINX interacts with each disk in parallel and independently through separate thread pools. Each disk is served by 16 independent streams and a separate queue of tasks for reading and sending files is formed for it.
After all, your customers love the individual approach? Be sure your hard drives too. ;)
This example is a demonstration of the tremendous flexibility of NGINX in configuring directly under your hardware. You kind of instruct NGINX how to best interact with the disk subsystem on this server and your data. And such fine tuning, when the software works to the user level in the most optimal way with the equipment, ensures the most efficient use of all the resources of a particular system.
findings
Thread pools are a great mechanism that fights the main and well-known enemy of the asynchronous approach - blocking operations, and thus allows NGINX to be brought to a new level of performance, especially if we are talking about very large amounts of data.
As mentioned earlier, thread pools can be used for any other operations and work with libraries that do not have an asynchronous interface.This potentially opens up new opportunities for the implementation of modules and functionality, the implementation of which, without prejudice to performance, was previously not feasible within a reasonable time. You can spend a lot of time and effort writing an asynchronous version of an existing library or trying to add such an interface, but the question arose: “is the game worth the candle”? With thread pools, this task can be solved much easier by creating modules that work with blocking calls, while not interfering with NGINX to carry out its main task by processing other requests.
So many new and interesting things await NGINX in the future. Stay with us!
Source: https://habr.com/ru/post/260669/
All Articles