Matlab features for developing and testing mechanistic trading systems
I think that there is no need to substantiate the need for thorough testing and selection of parameters for trading strategies ... I’d better explain why Matlab.
The MetaTrader trading terminal has a built-in system for testing and setting trading strategies that allows you to run a strategy on a given part of history and look at the results of trading both in graphical representation and in the form of a sign with the performance characteristics of this strategy in this part of history. How it looks for the Nova strategy, see below.

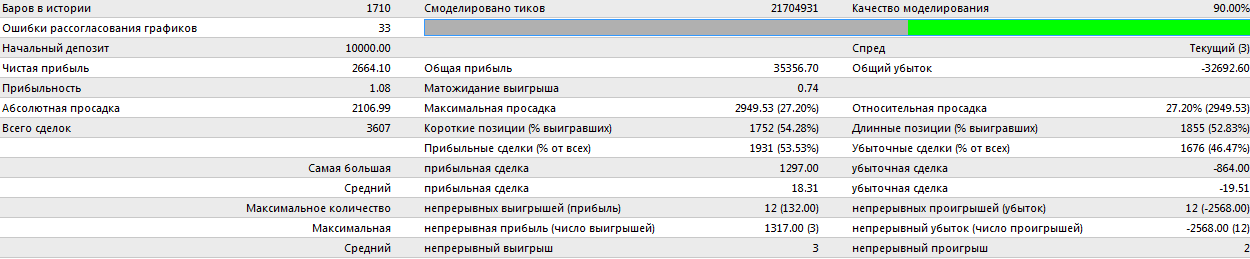
In my opinion, this testing system has a number of significant drawbacks:
1) You cannot use real tick data, you can only model them for data of minute, 5-minute, 15-minute, etc. stored on the server. timeframes;
2) For the selection of the optimal parameters of the strategy is quite a scant set of available optimization procedures;
3) A little more diverse, but still insufficient set of target indicators of the trading strategy that can be optimized;
4) The trading strategy development environment itself is suitable for the most minimal programming, not impressive with the variety of possibilities and accessible tools.
')
And I would like to be able to use tick (or even every second) data to accurately simulate trading situations, create trading strategies of any level of mathematical complexity, describe my own criteria for evaluating the quality of a strategy, search for optimal parameters using various optimization procedures, etc.
All this is possible using Matlab as a platform for developing and testing strategies. From MetaTrader, we will need source data (in my example: every second current prices for 27 currency pairs). Then MetaTrader will still be used to work with a ready-made trading strategy implemented, for example, in the form of a DLL, but all the most creative part of creating a system will occur in a more mathematical environment.
The data is collected by a custom indicator, whose code in MQL4 looks like this:
So, the data is collected and saved in CSV files. The rows are recorded current quotes, in columns: the entire range of bid and ask quotes for each currency pair. Total, columns in 2 times more than the considered currency pairs.
Suppose we do not have the opportunity to keep the computer running MetaTrader continuously, then the data will be received in blocks: downloaded, closed the program, renamed the file, so as not to get stuck, we can run it again, etc.
At the moment, I have collected data for 16 weeks. Moreover, the size of the data is different due to the fact that the collection began "somewhere in the morning" on Monday, and ended on Friday "approximately after lunch." Therefore it is necessary to put up with the fact that all arrays with data blocks of different sizes. In Matlab, I upload them as follows:
Script loadPrices.m:
As a result, all data blocks are stored in the global variable PRICES, which represents 16 cells.
Now, the basic idea: strategies should be created in such a way that they only accept their parameters as input. All source data is passed through global variables. In the course of executing a strategy, each time a deal is closed, global variables are adjusted that characterize the quality of the strategy’s work. To optimize these characteristics, we create a “shell” within which global variables are initialized, which of the indicators of the strategy’s performance will be returned as a parameter, and the strategy will be invoked.
Script testStrat.m:
The name of the script that implements the strategy is passed through the global variable stratName. The characteristic of the strategy that will be returned is determined by the variable returnParamIndex, if the value is 0, then all characteristics within the structure are returned.
Please note that all the values “the more the better” are with a minus, this is done for universal optimization: always minimize the target parameter.
Actually, the characteristics of the system:
DrawDown - maximum drawdown (maximum difference between the previous maximum and the current value);
Recovery - recovery factor (the ratio of the final gain to the maximum drawdown);
Equity - the final win;
DealsNumber - the number of transactions;
MeanDeal - the average income per transaction;
DealsSigma - standard deviation of income for each transaction from the average value;
Sharp - Sharpe ratio (the ratio of the average income per transaction to the standard deviation of income from transactions from the average value);
ProfitFactor - profit factor (the ratio of total profit to total loss);
ProfitDealsNumber - the number of winning trades;
ProfitDealsRate - the proportion of winning transactions;
ProfitMean - average win (for a successful transaction);
LossDealsNumber - the number of losing trades;
LossDealsRate - share of losing trades;
LossMean - average loss (for a losing trade).
These indicators are initialized by the initRates.m function
Moreover, both 0 and obviously bad values can be initialized (determined by the input parameter). Why bad initialization is needed will be shown below when considering a specific strategy. Note that several auxiliary variables are initialized:
maxEquity, dealSqr, totalProfit, totalLoss,
which are used in the following listing.
During the execution of the strategy, at each closing of the transaction, we will update the characteristics of the work strategy. To do this, use the updateStratRates.m function:
Actually, that's the whole infrastructure for testing strategies. Now you can describe the strategy as a function that takes as input a set of parameters, calling initRates at the beginning and updateStratRates with the result of each closing deal.
Baseline data can be obtained, for example:
Now more about the trading system, twoEMA, by the example of which I will show how it all works.
The idea of the system is to use two exponential moving averages. Entry into the market is subject to the following conditions:
Purchase / sale is carried out if all the conditions are met:
1) Fast moving average above / below slow for at least a certain number of 4-digit points;
2) The opening price of the timeframe is higher / lower than the fast moving average;
3) No current open deals.
Closing with any of the following conditions:
1) Achievement of the established profit value for the current transaction;
2) Achievement of the established value of the loss on the current transaction (tralling stop-loss as the income on the transaction increases, it pulls up to the current price, until breakeven values are reached);
3) The appearance of conditions 1 and 2 on the opening of the transaction in the opposite direction.
The input parameters for the transaction are: the length of the timeframe in seconds, the parameters of moving averages in units of measurement 0.0001, the “gap” between moving averages for opening a trade, the values of profit and loss in four-digit points.
In addition, we will consider two modes of operation of the strategy: debugging and demonstration.
In the demonstration mode, unlike debugging, not only closed transactions are evaluated, but also open ones, for which the maximum profit on the transaction, the maximum loss on the transaction, as well as the final income / loss at the time of closing the transaction are estimated.
Thus, each transaction can be represented by a standard “bar” instead of the traditional line graph Equity. Profit is counted in 4-digit points.
twoEMA.m:
In the listing above, the updateSeries helper function is used; it is a kind of "push_back".
Function updateSeries.m:
Finally, how can all this be used together?
Script mainScript.m:
As a result, the equity trading system will look like this:
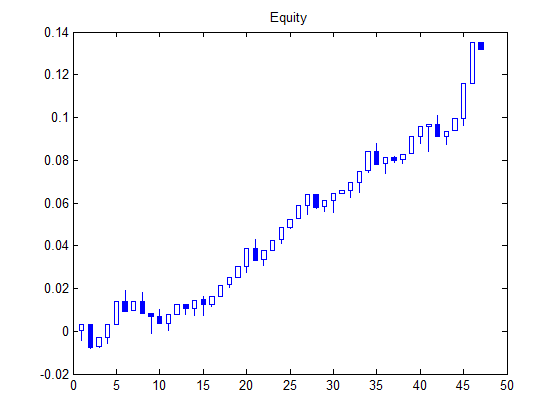
And the characteristics are as follows:
DrawDown: 0.0105
Recovery: 12.6103
Equity: 0.1320
DealsNumber: 47
MeanDeal: 0.0028
DealsSigma: 0.0056
Sharp: 0.5034
ProfitFactor: 3.3393
ProfitDealsNumber: 34
ProfitDealsRate: 0.7234
ProfitMean: 0.0055
LossDealsNumber: 13
LossDealsRate: 0.2766
LossMean: -0.0043
It could have been better ... Not surprisingly, at a minimum, we need to use a more intelligent search function for optimum than fminsearch, given that we have no reason to consider the objective function smooth, continuously differentiable and unimodal ...
But we didn’t have a goal to create a super system. And the possibilities of using Matlab are demonstrated.
The MetaTrader trading terminal has a built-in system for testing and setting trading strategies that allows you to run a strategy on a given part of history and look at the results of trading both in graphical representation and in the form of a sign with the performance characteristics of this strategy in this part of history. How it looks for the Nova strategy, see below.
In my opinion, this testing system has a number of significant drawbacks:
1) You cannot use real tick data, you can only model them for data of minute, 5-minute, 15-minute, etc. stored on the server. timeframes;
2) For the selection of the optimal parameters of the strategy is quite a scant set of available optimization procedures;
3) A little more diverse, but still insufficient set of target indicators of the trading strategy that can be optimized;
4) The trading strategy development environment itself is suitable for the most minimal programming, not impressive with the variety of possibilities and accessible tools.
')
And I would like to be able to use tick (or even every second) data to accurately simulate trading situations, create trading strategies of any level of mathematical complexity, describe my own criteria for evaluating the quality of a strategy, search for optimal parameters using various optimization procedures, etc.
All this is possible using Matlab as a platform for developing and testing strategies. From MetaTrader, we will need source data (in my example: every second current prices for 27 currency pairs). Then MetaTrader will still be used to work with a ready-made trading strategy implemented, for example, in the form of a DLL, but all the most creative part of creating a system will occur in a more mathematical environment.
The data is collected by a custom indicator, whose code in MQL4 looks like this:
//+------------------------------------------------------------------+ //| pack_collector.mq4 | //| Copyright 2014, JamaGava | //| | //+------------------------------------------------------------------+ #property copyright "Copyright 2014, JamaGava" #property link "" #property version "1.00" #property strict int filehandleData; int filehandleHead; int filehandleVolHead; int filehandleVolData; //+------------------------------------------------------------------+ //| Expert initialization function | //+------------------------------------------------------------------+ int OnInit() { EventSetTimer(1); filehandleData = FileOpen("tickPack.csv",FILE_WRITE|FILE_CSV); filehandleHead = FileOpen("tickPackHead.csv",FILE_WRITE|FILE_CSV); filehandleVolHead = FileOpen("tickPackVolumeHead.csv",FILE_WRITE|FILE_CSV); filehandleVolData = FileOpen("tickPackVolume.csv",FILE_WRITE|FILE_CSV); FileWrite(filehandleHead, "bid:AUD/USD", "ask:AUD/USD", "bid:EUR/USD", "ask:EUR/USD", "bid:GBP/USD", "ask:GBP/USD", "bid:NZD/USD", "ask:NZD/USD", "bid:USD/CAD", "ask:USD/CAD", "bid:USD/CHF", "ask:USD/CHF", "bid:USD/JPY", "ask:USD/JPY", "bid:AUD/CAD", "ask:AUD/CAD", "bid:AUD/CHF", "ask:AUD/CHF", "bid:AUD/NZD", "ask:AUD/NZD", "bid:CAD/CHF", "ask:CAD/CHF", "bid:EUR/AUD", "ask:EUR/AUD", "bid:EUR/CAD", "ask:EUR/CAD", "bid:EUR/CHF", "ask:EUR/CHF", "bid:EUR/GBP", "ask:EUR/GBP", "bid:EUR/NZD", "ask:EUR/NZD", "bid:GBP/AUD", "ask:GBP/AUD", "bid:GBP/CAD", "ask:GBP/CAD", "bid:GBP/CHF", "ask:GBP/CHF", "bid:GBP/NZD", "ask:GBP/NZD", "bid:NZD/CAD", "ask:NZD/CAD", "bid:NZD/CHF", "ask:NZD/CHF", "bid:AUD/JPY", "ask:AUD/JPY", "bid:CAD/JPY", "ask:CAD/JPY", "bid:CHF/JPY", "ask:CHF/JPY", "bid:EUR/JPY", "ask:EUR/JPY", "bid:GBP/JPY", "ask:GBP/JPY", "bid:NZD/JPY", "ask:NZD/JPY" ); FileWrite(filehandleVolHead, "volume:AUD/USD", "volume:EUR/USD", "volume:GBP/USD", "volume:NZD/USD", "volume:USD/CAD", "volume:USD/CHF", "volume:USD/JPY", "volume:AUD/CAD", "volume:AUD/CHF", "volume:AUD/NZD", "volume:CAD/CHF", "volume:EUR/AUD", "volume:EUR/CAD", "volume:EUR/CHF", "volume:EUR/GBP", "volume:EUR/NZD", "volume:GBP/AUD", "volume:GBP/CAD", "volume:GBP/CHF", "volume:GBP/NZD", "volume:NZD/CAD", "volume:NZD/CHF", "volume:AUD/JPY", "volume:CAD/JPY", "volume:CHF/JPY", "volume:EUR/JPY", "volume:GBP/JPY", "volume:NZD/JPY" ); FileClose(filehandleHead); FileClose(filehandleVolHead); return(INIT_SUCCEEDED); } //+------------------------------------------------------------------+ //| Expert deinitialization function | //+------------------------------------------------------------------+ void OnDeinit(const int reason) { EventKillTimer(); FileClose(filehandleData); } //+------------------------------------------------------------------+ //| Timer function | //+------------------------------------------------------------------+ void OnTimer() { FileWrite(filehandleData, MarketInfo("AUDUSD", MODE_BID), MarketInfo("AUDUSD", MODE_ASK), MarketInfo("EURUSD", MODE_BID), MarketInfo("EURUSD", MODE_ASK), MarketInfo("GBPUSD", MODE_BID), MarketInfo("GBPUSD", MODE_ASK), MarketInfo("NZDUSD", MODE_BID), MarketInfo("NZDUSD", MODE_ASK), MarketInfo("USDCAD", MODE_BID), MarketInfo("USDCAD", MODE_ASK), MarketInfo("USDCHF", MODE_BID), MarketInfo("USDCHF", MODE_ASK), MarketInfo("USDJPY", MODE_BID), MarketInfo("USDJPY", MODE_ASK), MarketInfo("AUDCAD", MODE_BID), MarketInfo("AUDCAD", MODE_ASK), MarketInfo("AUDCHF", MODE_BID), MarketInfo("AUDCHF", MODE_ASK), MarketInfo("AUDNZD", MODE_BID), MarketInfo("AUDNZD", MODE_ASK), MarketInfo("CADCHF", MODE_BID), MarketInfo("CADCHF", MODE_ASK), MarketInfo("EURAUD", MODE_BID), MarketInfo("EURAUD", MODE_ASK), MarketInfo("EURCAD", MODE_BID), MarketInfo("EURCAD", MODE_ASK), MarketInfo("EURCHF", MODE_BID), MarketInfo("EURCHF", MODE_ASK), MarketInfo("EURGBP", MODE_BID), MarketInfo("EURGBP", MODE_ASK), MarketInfo("EURNZD", MODE_BID), MarketInfo("EURNZD", MODE_ASK), MarketInfo("GBPAUD", MODE_BID), MarketInfo("GBPAUD", MODE_ASK), MarketInfo("GBPCAD", MODE_BID), MarketInfo("GBPCAD", MODE_ASK), MarketInfo("GBPCHF", MODE_BID), MarketInfo("GBPCHF", MODE_ASK), MarketInfo("GBPNZD", MODE_BID), MarketInfo("GBPNZD", MODE_ASK), MarketInfo("NZDCAD", MODE_BID), MarketInfo("NZDCAD", MODE_ASK), MarketInfo("NZDCHF", MODE_BID), MarketInfo("NZDCHF", MODE_ASK), MarketInfo("AUDJPY", MODE_BID), MarketInfo("AUDJPY", MODE_ASK), MarketInfo("CADJPY", MODE_BID), MarketInfo("CADJPY", MODE_ASK), MarketInfo("CHFJPY", MODE_BID), MarketInfo("CHFJPY", MODE_ASK), MarketInfo("EURJPY", MODE_BID), MarketInfo("EURJPY", MODE_ASK), MarketInfo("GBPJPY", MODE_BID), MarketInfo("GBPJPY", MODE_ASK), MarketInfo("NZDJPY", MODE_BID), MarketInfo("NZDJPY", MODE_ASK) ); FileWrite(filehandleVolData, iVolume("AUDUSD", PERIOD_H1,0), iVolume("EURUSD", PERIOD_H1,0), iVolume("GBPUSD", PERIOD_H1,0), iVolume("NZDUSD", PERIOD_H1,0), iVolume("USDCAD", PERIOD_H1,0), iVolume("USDCHF", PERIOD_H1,0), iVolume("USDJPY", PERIOD_H1,0), iVolume("AUDCAD", PERIOD_H1,0), iVolume("AUDCHF", PERIOD_H1,0), iVolume("AUDNZD", PERIOD_H1,0), iVolume("CADCHF", PERIOD_H1,0), iVolume("EURAUD", PERIOD_H1,0), iVolume("EURCAD", PERIOD_H1,0), iVolume("EURCHF", PERIOD_H1,0), iVolume("EURGBP", PERIOD_H1,0), iVolume("EURNZD", PERIOD_H1,0), iVolume("GBPAUD", PERIOD_H1,0), iVolume("GBPCAD", PERIOD_H1,0), iVolume("GBPCHF", PERIOD_H1,0), iVolume("GBPNZD", PERIOD_H1,0), iVolume("NZDCAD", PERIOD_H1,0), iVolume("NZDCHF", PERIOD_H1,0), iVolume("AUDJPY", PERIOD_H1,0), iVolume("CADJPY", PERIOD_H1,0), iVolume("CHFJPY", PERIOD_H1,0), iVolume("EURJPY", PERIOD_H1,0), iVolume("GBPJPY", PERIOD_H1,0), iVolume("NZDJPY", PERIOD_H1,0) ); } //+------------------------------------------------------------------+ So, the data is collected and saved in CSV files. The rows are recorded current quotes, in columns: the entire range of bid and ask quotes for each currency pair. Total, columns in 2 times more than the considered currency pairs.
Suppose we do not have the opportunity to keep the computer running MetaTrader continuously, then the data will be received in blocks: downloaded, closed the program, renamed the file, so as not to get stuck, we can run it again, etc.
At the moment, I have collected data for 16 weeks. Moreover, the size of the data is different due to the fact that the collection began "somewhere in the morning" on Monday, and ended on Friday "approximately after lunch." Therefore it is necessary to put up with the fact that all arrays with data blocks of different sizes. In Matlab, I upload them as follows:
Script loadPrices.m:
global PRICES; N = 16; PRICES = cell( N, 1 ); fNames = { 'C:\matlabR2008a_win\work\frx\DATA\1\tickPack.csv'; 'C:\matlabR2008a_win\work\frx\DATA\2\tickPack.csv'; 'C:\matlabR2008a_win\work\frx\DATA\3\tickPack.csv'; 'C:\matlabR2008a_win\work\frx\DATA\4\tickPack.csv'; 'C:\matlabR2008a_win\work\frx\DATA\5\tickPack.csv'; 'C:\matlabR2008a_win\work\frx\DATA\6\tickPack.csv'; 'C:\matlabR2008a_win\work\frx\DATA\7\tickPack.csv'; 'C:\matlabR2008a_win\work\frx\DATA\8\tickPack.csv'; 'C:\matlabR2008a_win\work\frx\DATA\9\tickPack.csv'; 'C:\matlabR2008a_win\work\frx\DATA\10\tickPack.csv'; 'C:\matlabR2008a_win\work\frx\DATA\11\tickPack.csv'; 'C:\matlabR2008a_win\work\frx\DATA\12\tickPack.csv'; 'C:\matlabR2008a_win\work\frx\DATA\13\tickPack.csv'; 'C:\matlabR2008a_win\work\frx\DATA\14\tickPack.csv'; 'C:\matlabR2008a_win\work\frx\DATA\15\tickPack.csv'; 'C:\matlabR2008a_win\work\frx\DATA\16\tickPack.csv'; }; for i = 1:N PRICES{ i } = load( fNames{ i } ); display( i ); end As a result, all data blocks are stored in the global variable PRICES, which represents 16 cells.
Now, the basic idea: strategies should be created in such a way that they only accept their parameters as input. All source data is passed through global variables. In the course of executing a strategy, each time a deal is closed, global variables are adjusted that characterize the quality of the strategy’s work. To optimize these characteristics, we create a “shell” within which global variables are initialized, which of the indicators of the strategy’s performance will be returned as a parameter, and the strategy will be invoked.
Script testStrat.m:
function [R] = testStrat( P ) global DrawDown; global Recovery; global Equity; global DealsNumber; global MeanDeal; global DealsSigma; global Sharp; global ProfitFactor; global ProfitDealsNumber; global ProfitDealsRate; global ProfitMean; global LossDealsNumber; global LossDealsRate; global LossMean; global returnParamIndex; global stratName; initRates( 0 ); feval( stratName, P ); switch( returnParamIndex ) case 1 R = DrawDown; case 2 R = -Recovery; case 3 R = -Equity; case 4 R = -DealsNumber; case 5 R = -MeanDeal; case 6 R = DealsSigma; case 7 R = -Sharp; case 8 R = -ProfitFactor; case 9 R = -ProfitDealsNumber; case 10 R = -ProfitDealsRate; case 11 R = -ProfitMean; case 12 R = LossDealsNumber; case 13 R = LossDealsRate; case 14 R = LossMean; case 0 R = struct( ... 'DrawDown', DrawDown, ... 'Recovery', Recovery, ... 'Equity', Equity, ... 'DealsNumber', DealsNumber, ... 'MeanDeal', MeanDeal, ... 'DealsSigma', DealsSigma, ... 'Sharp', Sharp, ... 'ProfitFactor', ProfitFactor, ... 'ProfitDealsNumber', ProfitDealsNumber, ... 'ProfitDealsRate', ProfitDealsRate, ... 'ProfitMean', ProfitMean, ... 'LossDealsNumber', LossDealsNumber, ... 'LossDealsRate', LossDealsRate, ... 'LossMean', LossMean ... ); end The name of the script that implements the strategy is passed through the global variable stratName. The characteristic of the strategy that will be returned is determined by the variable returnParamIndex, if the value is 0, then all characteristics within the structure are returned.
Please note that all the values “the more the better” are with a minus, this is done for universal optimization: always minimize the target parameter.
Actually, the characteristics of the system:
DrawDown - maximum drawdown (maximum difference between the previous maximum and the current value);
Recovery - recovery factor (the ratio of the final gain to the maximum drawdown);
Equity - the final win;
DealsNumber - the number of transactions;
MeanDeal - the average income per transaction;
DealsSigma - standard deviation of income for each transaction from the average value;
Sharp - Sharpe ratio (the ratio of the average income per transaction to the standard deviation of income from transactions from the average value);
ProfitFactor - profit factor (the ratio of total profit to total loss);
ProfitDealsNumber - the number of winning trades;
ProfitDealsRate - the proportion of winning transactions;
ProfitMean - average win (for a successful transaction);
LossDealsNumber - the number of losing trades;
LossDealsRate - share of losing trades;
LossMean - average loss (for a losing trade).
These indicators are initialized by the initRates.m function
function [z] = initRates( mode ) global DrawDown; global Recovery; global Equity; global DealsNumber; global MeanDeal; global DealsSigma; global Sharp; global ProfitFactor; global ProfitDealsNumber; global ProfitDealsRate; global ProfitMean; global LossDealsNumber; global LossDealsRate; global LossMean; global maxEquity; global dealSqr; global totalProfit; global totalLoss; z = mode; maxEquity = 0; dealSqr = 0; totalProfit = 0; totalLoss = 0; if mode == 0 DrawDown = 0; Recovery = 0; Equity = 0; DealsNumber = 0; MeanDeal = 0; DealsSigma = 0; Sharp = 0; ProfitFactor = 0; ProfitDealsNumber = 0; ProfitDealsRate = 0; ProfitMean = 0; LossDealsNumber = 0; LossDealsRate = 0; LossMean = 0; else DrawDown = 1000; Recovery = -1000; Equity = -1000; DealsNumber = 0; MeanDeal = -1000; DealsSigma = 1000; Sharp = -1000; ProfitFactor = 0; ProfitDealsNumber = 0; ProfitDealsRate = 0; ProfitMean = 0; LossDealsNumber = 100000; LossDealsRate = 1000; LossMean = 1000; end Moreover, both 0 and obviously bad values can be initialized (determined by the input parameter). Why bad initialization is needed will be shown below when considering a specific strategy. Note that several auxiliary variables are initialized:
maxEquity, dealSqr, totalProfit, totalLoss,
which are used in the following listing.
During the execution of the strategy, at each closing of the transaction, we will update the characteristics of the work strategy. To do this, use the updateStratRates.m function:
function [z] = updateStratRates( dealResult ) z = sign( dealResult ); global DrawDown; global Recovery; global Equity; global DealsNumber; global MeanDeal; global DealsSigma; global Sharp; global ProfitFactor; global ProfitDealsNumber; global ProfitDealsRate; global ProfitMean; global LossDealsNumber; global LossDealsRate; global LossMean; global maxEquity; global dealSqr; global totalProfit; global totalLoss; Equity = Equity + dealResult; if Equity > maxEquity maxEquity = Equity; end down = maxEquity - Equity; if down > DrawDown DrawDown = down; end Recovery = Equity / DrawDown; DealsNumber = DealsNumber + 1; MeanDeal = Equity / DealsNumber; dealSqr = dealSqr + dealResult^2; DealsSigma = sqrt( (dealSqr / DealsNumber) - MeanDeal^2 ); Sharp = MeanDeal / DealsSigma; if dealResult > 0 ProfitDealsNumber = ProfitDealsNumber + 1; totalProfit = totalProfit + dealResult; ProfitMean = totalProfit / ProfitDealsNumber; else LossDealsNumber = LossDealsNumber + 1; totalLoss = totalLoss + dealResult; LossMean = totalLoss / LossDealsNumber; end ProfitFactor = -totalProfit / totalLoss; ProfitDealsRate = ProfitDealsNumber / DealsNumber; LossDealsRate = 1 - ProfitDealsRate; Actually, that's the whole infrastructure for testing strategies. Now you can describe the strategy as a function that takes as input a set of parameters, calling initRates at the beginning and updateStratRates with the result of each closing deal.
Baseline data can be obtained, for example:
global pairIndex; % / / global DATA; % global dataBlocksNumber; % ( 16) Now more about the trading system, twoEMA, by the example of which I will show how it all works.
The idea of the system is to use two exponential moving averages. Entry into the market is subject to the following conditions:
Purchase / sale is carried out if all the conditions are met:
1) Fast moving average above / below slow for at least a certain number of 4-digit points;
2) The opening price of the timeframe is higher / lower than the fast moving average;
3) No current open deals.
Closing with any of the following conditions:
1) Achievement of the established profit value for the current transaction;
2) Achievement of the established value of the loss on the current transaction (tralling stop-loss as the income on the transaction increases, it pulls up to the current price, until breakeven values are reached);
3) The appearance of conditions 1 and 2 on the opening of the transaction in the opposite direction.
The input parameters for the transaction are: the length of the timeframe in seconds, the parameters of moving averages in units of measurement 0.0001, the “gap” between moving averages for opening a trade, the values of profit and loss in four-digit points.
In addition, we will consider two modes of operation of the strategy: debugging and demonstration.
In the demonstration mode, unlike debugging, not only closed transactions are evaluated, but also open ones, for which the maximum profit on the transaction, the maximum loss on the transaction, as well as the final income / loss at the time of closing the transaction are estimated.
Thus, each transaction can be represented by a standard “bar” instead of the traditional line graph Equity. Profit is counted in 4-digit points.
twoEMA.m:
function [Z] = twoEma( P ) %{ +---------------------------------------------------------------+ ! ! ! Parameters: ! ! timeframe = P(1) ! ! E1 - slow EMA with alpha = P(2) ! ! E2 - fast EMA with alpha = P(3) ! ! ! ! Open: ! ! long deal: (openPrice >= E2 > E1) & abs(E1 - E2) >= P(4) ! ! short deal: (openPrice <= E2 < E1) & abs(E1 - E2) >= P(4) ! ! ! ! Close: ! ! by trailing Stop-loss or by Take profit ! ! ! +---------------------------------------------------------------+ %} global pairIndex; global DATA; global dataBlocksNumber; global WithPlot; % global EQ; % Equity global eqCounter; % % if or( P( 1 ) < 0, ... or( P( 4 ) * 0.0001 <= 0, ... or( P( 5 ) * 0.0001 <= 0, ... or( P( 6 ) * 0.0001 <= 0, ... or( ... or( P( 2 ) * 0.0001 <= 0, P( 2 ) * 0.0001 >= 1 ), ... or( P( 3 ) * 0.0001 <= P( 2 ) * 0.0001, P( 3 ) * 0.0001 >= 1 ) ... ) ... ) ... ) ... ) ... ) initRates( 1 ); % , % Z = 1; return; end initRates( 0 ); % % currEQopen = 0; currEQmin = 0; currEQmax = 0; currEQclose = 0; TF = round( P( 1 ) ); % for currBlock = 1:dataBlocksNumber currData = DATA{ currBlock }; dataSize = size( currData ); dataLen = dataSize( 1 ); tfNumb = ceil( dataLen / TF ); % bid ask bidPrices = currData( :, 2 * ( pairIndex - 1) + 1 ); askPrices = currData( :, 2 * pairIndex ); % dealDir = 0; openDealPrice = 0; stopLoss = 0; takeProfit = 0; currDeal = 0; signal = 0; E1 = bidPrices( 1 ); E2 = bidPrices( 1 ); currTime = 1; for t = 2:tfNumb % ... currTime = currTime + TF; % ( % ) barLen = TF; if t == tfNumb barLen = dataLen - TF * ( tfNumb - 1 ); end for tick = 2:(barLen - 1) % ... if dealDir == 1 % % currDeal = bidPrices( currTime + tick ) - openDealPrice; currEQmin = min( currDeal, currEQmin ); currEQmax = max( currDeal, currEQmax ); currEQclose = currDeal; % - stopLoss = max( stopLoss, bidPrices( currTime + tick ) - P( 5 ) * 0.0001 ); % - - if or( bidPrices( currTime + tick ) <= stopLoss, ... bidPrices( currTime + tick ) >= takeProfit ... ) dealDir = 0; % updateStratRates( currDeal ); % , % if WithPlot [EQ, eqCounter] = updateSeries( EQ, eqCounter, [currEQopen, currEQmax, currEQmin, currEQclose] ); end end end if dealDir == -1 % currDeal = openDealPrice - askPrices( currTime + tick ); currEQmin = min( currDeal, currEQmin ); currEQmax = max( currDeal, currEQmin ); currEQclose = currDeal; % - stopLoss = min( stopLoss, askPrices( currTime + tick ) + P( 5 ) * 0.0001 ); % - - if or( askPrices( currTime + tick ) >= stopLoss, ... askPrices( currTime + tick ) <= takeProfit ... ) dealDir = 0; % updateStratRates( currDeal ); % , % if WithPlot [EQ, eqCounter] = updateSeries( EQ, eqCounter, [currEQopen, currEQmax, currEQmin, currEQclose] ); end end end end % E1 = E1 + P( 2 ) * 0.0001 * ( bidPrices( currTime ) - E1 ); E2 = E2 + P( 3 ) * 0.0001 * ( bidPrices( currTime ) - E2 ); % signal = 0; if and( and( bidPrices( currTime ) >= E2, E2 > E1 ), abs( E1 - E2 ) >= P( 4 ) * 0.0001 ) signal = 1; end if and( and( bidPrices( currTime ) <= E2, E2 < E1 ), abs( E1 - E2 ) >= P( 4 ) * 0.0001 ) signal = -1; end % , % if or( ... and( dealDir == 1, signal == -1 ), ... and( dealDir == -1, signal == 1 ) ... ) dealDir = 0; % updateStratRates( currDeal ); % , % if WithPlot [EQ, eqCounter] = updateSeries( EQ, eqCounter, [currEQopen, currEQmax, currEQmin, currEQclose] ); end end % if and( dealDir == 0, signal == 1 ) dealDir = 1; openDealPrice = askPrices( currTime ); % % - - stopLoss = bidPrices( currTime + tick ) - P( 5 ) * 0.0001; takeProfit = bidPrices( currTime + tick ) + P( 6 ) * 0.0001; % Equity currEQopen = askPrices( currTime + tick ) - bidPrices( currTime + tick ); currEQmin = askPrices( currTime + tick ) - bidPrices( currTime + tick ); currEQmax = askPrices( currTime + tick ) - bidPrices( currTime + tick ); currEQclose = askPrices( currTime + tick ) - bidPrices( currTime + tick ); end % if and( dealDir == 0, signal == -1 ) dealDir = -1; openDealPrice = bidPrices( currTime ); % % - - stopLoss = askPrices( currTime + tick ) + P( 5 ) * 0.0001; takeProfit = askPrices( currTime + tick ) - P( 6 ) * 0.0001; % Equity currEQopen = askPrices( currTime + tick ) - bidPrices( currTime + tick ); currEQmin = askPrices( currTime + tick ) - bidPrices( currTime + tick ); currEQmax = askPrices( currTime + tick ) - bidPrices( currTime + tick ); currEQclose = askPrices( currTime + tick ) - bidPrices( currTime + tick ); end end % if dealDir ~= 0 % updateStratRates( currDeal ); % , % if WithPlot [EQ, eqCounter] = updateSeries( EQ, eqCounter, [currEQopen, currEQmax, currEQmin, currEQclose] ); end end end Z = 0; In the listing above, the updateSeries helper function is used; it is a kind of "push_back".
Function updateSeries.m:
function [S, I] = updateSeries(s, i, v) if i == 0 S = v; I = 1; else I = i + 1; S = [s; v]; end Finally, how can all this be used together?
Script mainScript.m:
% loadPrices; % global stratName; global returnParamIndex; global pairIndex; global DATA; global PRICES; global dataBlocksNumber; global WithPlot; global EQ; global eqCounter; stratName = 'twoEma'; % twoEMA pairIndex = 2; % (EUR/USD) DATA = PRICES; dataBlocksNumber = 16; WithPlot = false; % P = [900, 100, 310, 25, 100, 40]; % returnParamIndex = 7; % P = fminsearch( 'testStrat', P ); display(P); WithPlot = true; % EQ = 0; eqCounter = 0; returnParamIndex = 0; R = testStrat( P ); display(R); for i = 2:eqCounter % EQ( i, 1 ) = EQ( i, 1 ) + EQ( i - 1, 4 ); EQ( i, 2 ) = EQ( i, 2 ) + EQ( i - 1, 4 ); EQ( i, 3 ) = EQ( i, 3 ) + EQ( i - 1, 4 ); EQ( i, 4 ) = EQ( i, 4 ) + EQ( i - 1, 4 ); end candle(EQ(:, 2), EQ(:, 3), EQ(:, 4), EQ(:, 1)); title('Equity'); As a result, the equity trading system will look like this:
And the characteristics are as follows:
DrawDown: 0.0105
Recovery: 12.6103
Equity: 0.1320
DealsNumber: 47
MeanDeal: 0.0028
DealsSigma: 0.0056
Sharp: 0.5034
ProfitFactor: 3.3393
ProfitDealsNumber: 34
ProfitDealsRate: 0.7234
ProfitMean: 0.0055
LossDealsNumber: 13
LossDealsRate: 0.2766
LossMean: -0.0043
It could have been better ... Not surprisingly, at a minimum, we need to use a more intelligent search function for optimum than fminsearch, given that we have no reason to consider the objective function smooth, continuously differentiable and unimodal ...
But we didn’t have a goal to create a super system. And the possibilities of using Matlab are demonstrated.
Source: https://habr.com/ru/post/260635/
All Articles