Monitor real-time JavaScript timers
Visualization of a dynamic process on a graph is one of the ways to get new / additional information. The publication shows a simple utility with which you can see the work of JavaScript-timers. On the one hand, JavaScript-timers are well suited for organizing a cyclic process. On the other hand, they, in general terms, clearly demonstrate the behavior of single-threaded JavaScript multitasking, which, in some cases, can also be useful.
The schedule allows you to:
The horizontal axis (X) measures the number of cycles passed. The vertical axis (Y) measures time in milliseconds (ms). Start - on the "START" button. Completion - occur automatically after visual filling of data along the X axis.
')
Measured values:
Performance checked:
The code on github .
Demo on GitHub (also works from disk).
setTimeout is used for one-time code execution delays and for looping. SetTimeout based loop:
Here everything seems to be obvious: 100 is the delay in milliseconds (ms) through which the next task cycle will be launched. But, when organizing a cycle, you intuitively expect that the code will be executed exactly with this period. In fact (as seen on the graph), the actual cycle time will consist of the execution time of the code plus the delay time. That is, the more complex the code, the longer the actual cycle time will be.
setInterval is used to execute the code at regular intervals. SetInterval based loop:
The graph shows that setInterval controls the time of the full cycle. When the code execution time changes, the time between calls is “intelligently” adjusted so that the full cycle time remains stable. If the execution time of the code exceeds the specified period, the timer, having exhausted the possibilities for reducing the time between calls, begins to be called with an extended period.
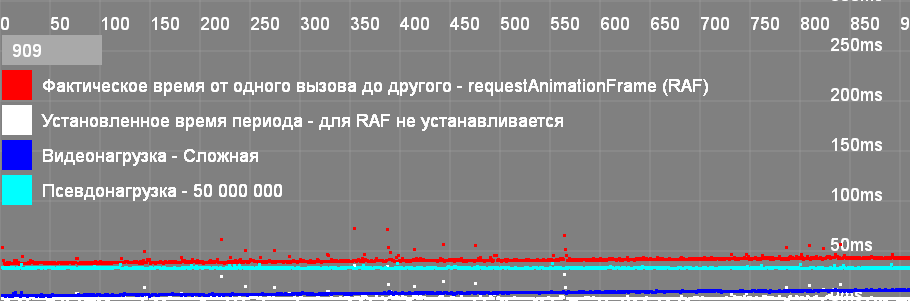
requestAnimationFrame is used to cyclically redraw the screen, which is synchronized with browser redraw cycles. Cycle based on requestAnimationFrame:
In theory, hybrid solutions should have combined exact timing and rendering synchronization with the screen refresh cycle. SetTimeout + requestAnimationFrame based loop:
SetInterval + requestAnimationFrame based loop:
Functionally, the code is executed, but, at the same time, there is an increased instability of cycle periods.
Observations:
As the video load, the functions of drawing graphics on the Canvas are used.
When choosing a simple function (APELSERG.CANVA.Paint), the grid of the graphics is drawn once, at the start. And, further, in the process of plotting, only the current result (four points) and the cycle counter are displayed.
When you select a complex function (APELSERG.CANVA.PaintComplex), all results are saved in arrays. Each time you draw, the graph grid is updated again and all saved results from all arrays are displayed.
A pseudo-load is a simple JavaScript loop in which a random value is selected:
The loop is rendered into a separate function so that it would be easier to substitute another code. You can select the number of cycles from 0 to 1,000,000,000. The test result under pseudo-load, in different browsers, was a little surprised.
To change the scale of the grid, you need:
The resulting graph can be saved as a standard image:
Javascript main loop
How JavaScript Timers Work
The schedule allows you to:
- To see the work of the JavaScript-timer in real time.
- Simulate different load conditions.
- Compare the work of different browsers.
- Gives information for consideration (some results were curious).
Introduction
The horizontal axis (X) measures the number of cycles passed. The vertical axis (Y) measures time in milliseconds (ms). Start - on the "START" button. Completion - occur automatically after visual filling of data along the X axis.
')
Measured values:
- Red: time interval from the beginning of one cycle to the beginning of another (time of a full cycle).
- White: the time from the end of one cycle to the beginning of another (delay time).
- Blue: video load time. Video upload is a graphical display of this graph.
- Cyan: pseudo-load time. A pseudo-load is a simple circular repetition of JavaScript code.
Performance checked:
- Windows: FF, OPERA, CR, IE.
- Linux: FF, OPERA.
The code on github .
Demo on GitHub (also works from disk).
Timer Types
setTimeout
setTimeout is used for one-time code execution delays and for looping. SetTimeout based loop:
MyFunc = function () { // setTimeout(function () { MyFunc(); }, 100); } Here everything seems to be obvious: 100 is the delay in milliseconds (ms) through which the next task cycle will be launched. But, when organizing a cycle, you intuitively expect that the code will be executed exactly with this period. In fact (as seen on the graph), the actual cycle time will consist of the execution time of the code plus the delay time. That is, the more complex the code, the longer the actual cycle time will be.
setInterval
setInterval is used to execute the code at regular intervals. SetInterval based loop:
MyTimer = function () { setInterval(function () { MyFunc(); // }, 100); } The graph shows that setInterval controls the time of the full cycle. When the code execution time changes, the time between calls is “intelligently” adjusted so that the full cycle time remains stable. If the execution time of the code exceeds the specified period, the timer, having exhausted the possibilities for reducing the time between calls, begins to be called with an extended period.
requestAnimationFrame
requestAnimationFrame is used to cyclically redraw the screen, which is synchronized with browser redraw cycles. Cycle based on requestAnimationFrame:
MyFunc = function () { // requestAnimationFrame(function () { MyFunc(); }); } setTimeout / setInterval + requestAnimationFrame
In theory, hybrid solutions should have combined exact timing and rendering synchronization with the screen refresh cycle. SetTimeout + requestAnimationFrame based loop:
MyFunc = function () { // setTimeout(function () { requestAnimationFrame(function () { MyFunc(); }); }, 100); } SetInterval + requestAnimationFrame based loop:
MyTimer = function () { setInterval(function () { requestAnimationFrame(function () { MyFunc(); // }); }, 100); } Functionally, the code is executed, but, at the same time, there is an increased instability of cycle periods.
Observations:
- For different browsers, the behavior of timers may differ. This is especially evident at low values of the delay time and / or at high loads.
- If in the browser, from the bookmark with the schedule to go to another bookmark (in the same window), the timers stop and resume again after activating the bookmark with the schedule. If you open another window in the browser, the work of the timers does not stop.
Video loading
As the video load, the functions of drawing graphics on the Canvas are used.
When choosing a simple function (APELSERG.CANVA.Paint), the grid of the graphics is drawn once, at the start. And, further, in the process of plotting, only the current result (four points) and the cycle counter are displayed.
When you select a complex function (APELSERG.CANVA.PaintComplex), all results are saved in arrays. Each time you draw, the graph grid is updated again and all saved results from all arrays are displayed.
Pseudo load
A pseudo-load is a simple JavaScript loop in which a random value is selected:
APELSERG.MAIN.VirtCalc = function () { for (var n = 0; n < APELSERG.CONFIG.SET.TypeVirtCalc ; n++) { var q = Math.round(Math.random() * 100); } } The loop is rendered into a separate function so that it would be easier to substitute another code. You can select the number of cycles from 0 to 1,000,000,000. The test result under pseudo-load, in different browsers, was a little surprised.
Scaling and saving graphics
To change the scale of the grid, you need:
- Change browser zoom (Ctrl-, Ctrl +).
- Reload this page.
- Select the size of the output value (from 1 to 4 px).
The resulting graph can be saved as a standard image:
- Right mouse button on the chart.
- Save Image As ...
useful links
Javascript main loop
How JavaScript Timers Work
Source: https://habr.com/ru/post/260449/
All Articles