Data from Arduino in the form of charts and graphs
Sometimes it is required, without reading detailed information from a variety of sensors, simply to assess the current state of the system and the dynamics of its state change over a period of time. So I wanted to make a device that shows changes in data from the sensors in the form of beautiful pictures of small diagrams that can be viewed in the browser window of mobile devices or computers connected to the local network. In this case, the determining factor was the minimum cost, and ease of implementation.
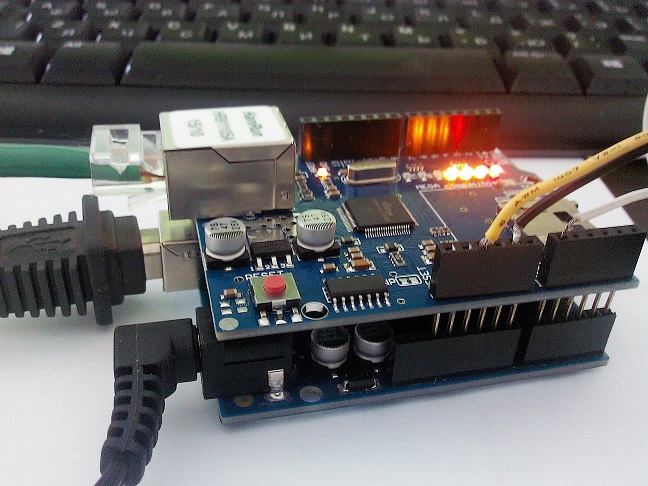
After sorting through various options for solving this problem, I turned my attention to Arduino microcontrollers. The advantage of these devices is the simplicity of obtaining the necessary "iron" functionality by simply connecting the elements. For example, to be able to connect to a local network, it is enough to put the network adapter card on top of the main board. The main thing is to match the corresponding connectors.
The signal from the sensor comes to the analog input of the microcontroller, it is processed, for example, averaged over the necessary, previously set time intervals. The microcontroller contains software that implements the http server, which, upon request from the client’s browser, issues an html page with information from the sensor to the local network. Thus, any device that has a web browser, for example, a smartphone and is connected to a local network, has the ability to view the schedule.
')
The hardware of the converter consists of two parts: the Arduino Uno board, which includes the Atmega328 processor, and the Ethernet shield. Both types of Arduino Ethernet Shields available on the ENC28j60 and W5100 have been tested.
The web server’s capabilities are extremely limited by the available memory of the Arduino board and the architecture of the network board, but we managed to write a sketch that works with both Ethernet shields.
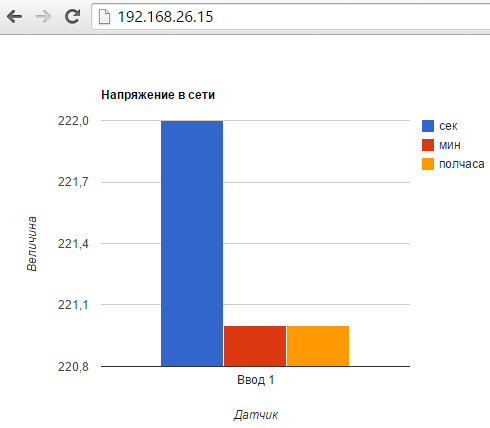
The software (sketch) for arduino is designed for two different applications. In the first case, it was assumed that customers requesting data have access to the Internet, which allows the use of external libraries for visualization. When using the library to build a histogram from Google, the appearance of the page received from Arduino may be as follows:
A sketch for data output in the form of such a diagram with an Ethernet wizard based on the W5100 chip is shown below. If you want to use a board with the ENC28J60 chip, you just need to uncomment 1 line and comment out the next 2 lines of the sketch. The program uses methods to optimize the use of processor memory in order to maximally free up RAM and ensure reliable operation of the program on both types of network adapters.
In this sketch, data from the zero analog input is read and averaged over a half-hour and minute interval. When requested from the client's http at 192.168.26.15, this data is displayed in the form of a histogram. Of course, before downloading this program, you must enter the desired address of your local network.
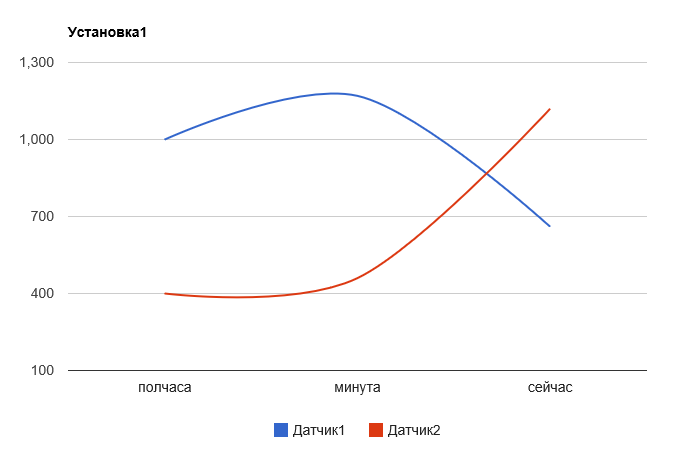
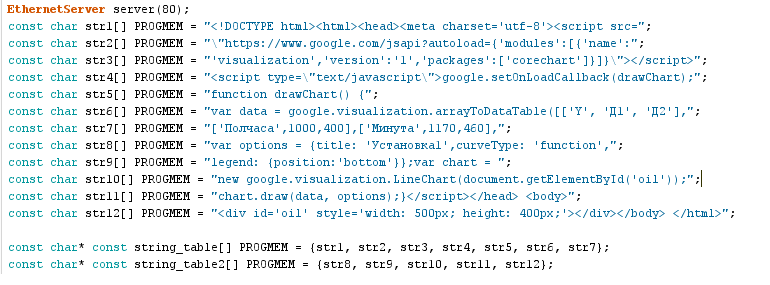
If you wish, you can also output data from arduino as line graphs:
A sketch for such a data presentation is presented below:
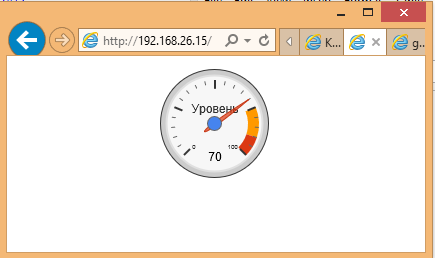
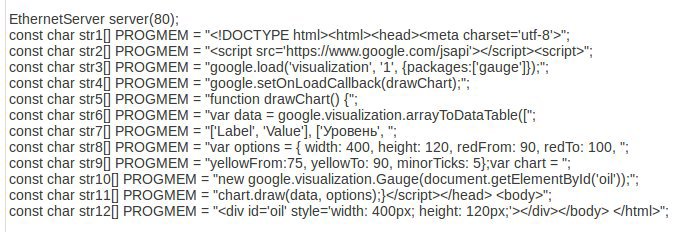
In addition,out of sheer curiosity, as part of a study on the use of the google library, a sketch was written that allows you to display information in the form of an analog gauge. It allows you to quickly assess the current value of the signal.
In case there is no possibility to use devices connected to the Internet to read data from sensors, another method of constructing diagrams in Arduino based on the use of Scalable Vector Graphic (SVG) has been tested.
Since you just need to evaluate the dynamics of changing parameters, then as a result of the following sketch when requesting data from arduino, on the browser screen you will see the following diagram:
One glance at the diagram allows you to understand the dynamics of a parameter change at predetermined time intervals.
The sketch is shown below:
The above sketches show how, using the simplest means, without using additional equipment and software, such as a web server and server-based data processing applications, to get an acceptable type of display of information from sensors under operating conditions. Of course, with this method of data transfer you must have a local network and for the operation of mobile devices, Wi-Fi access to this network.
When writing sketches a great help was provided by the guide for the developer , as well as the article on Habré “Introduction to SVG graphics” .
The UIP library is not included in the standard set, but can be downloaded here .
I hope, based on the examples of sketches given by me and links to training materials, it will be easy for you to make Arduino display graphics in a form that you like best.
PS As it turned out, Habr's spoiler ruthlessly gnawed pieces of html code from the sketches. Therefore, in order not to disappoint readers, I added bitten off fragments in the form of pictures.
After sorting through various options for solving this problem, I turned my attention to Arduino microcontrollers. The advantage of these devices is the simplicity of obtaining the necessary "iron" functionality by simply connecting the elements. For example, to be able to connect to a local network, it is enough to put the network adapter card on top of the main board. The main thing is to match the corresponding connectors.
The signal from the sensor comes to the analog input of the microcontroller, it is processed, for example, averaged over the necessary, previously set time intervals. The microcontroller contains software that implements the http server, which, upon request from the client’s browser, issues an html page with information from the sensor to the local network. Thus, any device that has a web browser, for example, a smartphone and is connected to a local network, has the ability to view the schedule.
')
The hardware of the converter consists of two parts: the Arduino Uno board, which includes the Atmega328 processor, and the Ethernet shield. Both types of Arduino Ethernet Shields available on the ENC28j60 and W5100 have been tested.
The web server’s capabilities are extremely limited by the available memory of the Arduino board and the architecture of the network board, but we managed to write a sketch that works with both Ethernet shields.
The software (sketch) for arduino is designed for two different applications. In the first case, it was assumed that customers requesting data have access to the Internet, which allows the use of external libraries for visualization. When using the library to build a histogram from Google, the appearance of the page received from Arduino may be as follows:
A sketch for data output in the form of such a diagram with an Ethernet wizard based on the W5100 chip is shown below. If you want to use a board with the ENC28J60 chip, you just need to uncomment 1 line and comment out the next 2 lines of the sketch. The program uses methods to optimize the use of processor memory in order to maximally free up RAM and ensure reliable operation of the program on both types of network adapters.
sketch histograms
// data output using the web server in the form of a histogram
// author A. Konovalov 2015
// # include <UIPEthernet.h> // for working with ENC28J60
#include <Ethernet.h>
#include <SPI.h
byte mac [] = {0xDE, 0xAD, 0xBE, 0xEF, 0xFE, 0xED};
IPAddress ip (192,168,26,15);
EthernetServer server (80);
const char str1 [] PROGMEM = "<! DOCTYPE html>";
const char str2 [] PROGMEM = "";
const char str12 [] PROGMEM = "";
const char * const string_table [] PROGMEM = {str1, str2, str3, str4, str5, str6, str7};
const char * const string_table2 [] PROGMEM = {str8, str9, str10, str11, str12};
char myChar;
char buffer [80];
unsigned long previousMillis1 = 0; // last time point
unsigned long previousMillis2 = 1; // last moment of time
unsigned long previousMillis3 = 1; // last moment of time
long OnTime2 = 60000; // minute
long OnTime3 = 1,800,000; // half an hour
int In_sec = 0; // countdown per second
int In_min = 0; // countdown per minute
int In_half = 0; // countdown for half an hour
long Sum_min = 0; // amount per minute
long Sum_half = 0; // amount for half an hour
float Sum_base_min = 0;
float Sum_base_half = 0;
int i, j, k = 0;
void setup ()
{
// start the Ethernet connection and the server:
Ethernet.begin (mac, ip);
server.begin ();
}
// unsigned long begMillis = millis (); // start time in ms
void loop ()
{
unsigned long currentMillis = millis (); // flowed in ms
In_sec = analogRead (0);
Sum_min = Sum_min + (currentMillis - previousMillis1) * In_sec;
In_min = (Sum_min + Sum_base_min) / (OnTime2 * i + currentMillis - previousMillis2);
Sum_half = Sum_half + (currentMillis - previousMillis1) * In_sec;
In_half = (Sum_half + Sum_base_half) / (OnTime3 * j + currentMillis - previousMillis3);
previousMillis1 = currentMillis; // remember the moment of time
if (currentMillis - previousMillis2> = OnTime2)
{i = 1;
Sum_base_min = Sum_min;
previousMillis2 = currentMillis; // remember the moment of time
Sum_min = 0;
}
if (currentMillis - previousMillis3> = OnTime3)
{j = 1;
Sum_base_half = Sum_half;
previousMillis3 = currentMillis; // remember the moment of time
Sum_half = 0;
}
EthernetClient client = server.available ();
if (client) {
boolean currentLineIsBlank = true;
while (client.connected ()) {
if (client.available ()) {
char c = client.read ();
if (c == '\ n' && currentLineIsBlank) {
for (int i = 0; i <7; i ++)
{
strcpy_P (buffer, (char *) pgm_read_word (& (string_table [i])));
client.print (buffer);
delay (500);
}
client.print ("[Enter 1 ',");
client.print (In_sec);
client.print (",");
client.print (In_min);
client.print (",");
client.print (In_half);
client.print ("],]);");
for (int i = 0; i <5; i ++)
{
strcpy_P (buffer, (char *) pgm_read_word (& (string_table2 [i])));
client.print (buffer);
delay (500);
}
break;
}
if (c == '\ n') {
}
else if (c! = '\ r') {
}
}
}
delay (1);
client.stop ();
}
}
In this sketch, data from the zero analog input is read and averaged over a half-hour and minute interval. When requested from the client's http at 192.168.26.15, this data is displayed in the form of a histogram. Of course, before downloading this program, you must enter the desired address of your local network.
If you wish, you can also output data from arduino as line graphs:
A sketch for such a data presentation is presented below:
line chart sketch
// data output using the web server in the form of graphs
// author A. Konovalov 2015
// # include <UIPEthernet.h>
#include <Ethernet.h>
#include <SPI.h>
// Enter a MAC address and IP address for your controller below.
// The IP address will be dependent on your local network:
byte mac [] = {0xDE, 0xAD, 0xBE, 0xEF, 0xFE, 0xED};
IPAddress ip (192,168,26,15);
// Initialize the Ethernet server library
// with the IP address and port
// (port 80 is default for HTTP):
EthernetServer server (80);
const char str1 [] PROGMEM = "<! DOCTYPE html> <script src =";
const char str2 [] PROGMEM = "\" www.google.com/jsapi?autoload= {'modules': [{'name': ";
const char str3 [] PROGMEM = "'visualization', 'version': '1', 'packages': ['corechart']}]} \"> ";
const char str4 [] PROGMEM = "";
const char str12 [] PROGMEM = "";
const char * const string_table [] PROGMEM = {str1, str2, str3, str4, str5, str6, str7};
const char * const string_table2 [] PROGMEM = {str8, str9, str10, str11, str12};
char myChar;
char buffer [80];
unsigned long previousMillis1 = 0; // last time point
unsigned long previousMillis2 = 1; // last moment of time
unsigned long previousMillis3 = 1; // last moment of time
long OnTime2 = 60000; // minute
long OnTime3 = 600000; // half an hour
int In_sec = 0; // countdown per second
int In_min = 0; // countdown per minute
int In_half = 0; // countdown for half an hour
long Sum_min = 0; // amount per minute
long Sum_half = 0; // amount for half an hour
float Sum_base_min = 0;
float Sum_base_half = 0;
int i, j, k = 0;
void setup ()
{
// start the Ethernet connection and the server:
Ethernet.begin (mac, ip);
server.begin ();
}
// unsigned long begMillis = millis (); // flowed in ms
void loop ()
{
unsigned long currentMillis = millis (); // flowed in ms
In_sec = analogRead (0);
Sum_min = Sum_min + (currentMillis - previousMillis1) * In_sec;
In_min = (Sum_min + Sum_base_min) / (OnTime2 * i + currentMillis - previousMillis2);
Sum_half = Sum_half + (currentMillis - previousMillis1) * In_sec;
In_half = (Sum_half + Sum_base_half) / (OnTime3 * j + currentMillis - previousMillis3);
previousMillis1 = currentMillis; // remember the moment of time
if (currentMillis - previousMillis2> = OnTime2)
{i = 1;
Sum_base_min = Sum_min;
previousMillis2 = currentMillis; // remember the moment of time
Sum_min = 0;
}
if (currentMillis - previousMillis3> = OnTime3)
{j = 1;
Sum_base_half = Sum_half;
previousMillis3 = currentMillis; // remember the moment of time
Sum_half = 0;
}
/ *
In_sec = 990;
In_min = 500;
In_half = 90;
* /
// listen for incoming clients
EthernetClient client = server.available ();
if (client) {
// an http request ends with a blank line
boolean currentLineIsBlank = true;
while (client.connected ()) {
if (client.available ()) {
char c = client.read ();
if (c == '\ n' && currentLineIsBlank) {
for (int i = 0; i <7; i ++)
{
strcpy_P (buffer, (char *) pgm_read_word (& (string_table [i]))); // Necessary casts and dereferencing, just copy.
client.print (buffer);
delay (500);
}
client.print ("['Now',");
client.print (660);
client.print (",");
client.print (1120);
client.print ("],]);");
for (int i = 0; i <5; i ++)
{
strcpy_P (buffer, (char *) pgm_read_word (& (string_table2 [i]))); // Necessary casts and dereferencing, just copy.
client.print (buffer);
delay (500);
}
break;
}
if (c == '\ n') {
// you're starting a new line
currentLineIsBlank = true;
}
else if (c! = '\ r') {
// you gotten a character on the current line
currentLineIsBlank = false;
}
}
}
// give the data browser
delay (1);
// close the connection:
client.stop ();
}
}
In addition,
sketch with the device
// data output using the web server as a device
// author A. Konovalov 2015
// # include <UIPEthernet.h>
#include <Ethernet.h>
#include <SPI.h>
byte mac [] = {0xDE, 0xAD, 0xBE, 0xEF, 0xFE, 0xED};
IPAddress ip (192,168,26,15);
EthernetServer server (80);
const char str1 [] PROGMEM = "<! DOCTYPE html>";
const char str2 [] PROGMEM = "";
const char str12 [] PROGMEM = "";
const char * const string_table [] PROGMEM = {str1, str2, str3, str4, str5, str6, str7};
const char * const string_table2 [] PROGMEM = {str8, str9, str10, str11, str12};
char myChar;
char buffer [80];
int In_sec = 0; // countdown per second
int i, j, k = 0;
void setup ()
{
// start the Ethernet connection and the server:
Ethernet.begin (mac, ip);
server.begin ();
}
// unsigned long begMillis = millis (); // flowed in ms
void loop ()
{
In_sec = analogRead (0);
EthernetClient client = server.available ();
if (client) {
// an http request ends with a blank line
boolean currentLineIsBlank = true;
while (client.connected ()) {
if (client.available ()) {
char c = client.read ();
if (c == '\ n' && currentLineIsBlank) {
for (int i = 0; i <7; i ++)
{
strcpy_P (buffer, (char *) pgm_read_word (& (string_table [i]))); // Necessary casts and dereferencing, just copy.
client.print (buffer);
delay (500);
}
client.print (In_sec);
client.print ("]]);");
for (int i = 0; i <5; i ++)
{
strcpy_P (buffer, (char *) pgm_read_word (& (string_table2 [i]))); // Necessary casts and dereferencing, just copy.
client.print (buffer);
delay (500);
}
break;
}
if (c == '\ n') {
// you're starting a new line
currentLineIsBlank = true;
}
else if (c! = '\ r') {
// you gotten a character on the current line
currentLineIsBlank = false;
}
}
}
// give the data browser
delay (1);
// close the connection:
client.stop ();
}
}
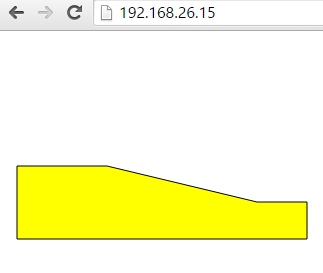
In case there is no possibility to use devices connected to the Internet to read data from sensors, another method of constructing diagrams in Arduino based on the use of Scalable Vector Graphic (SVG) has been tested.
Since you just need to evaluate the dynamics of changing parameters, then as a result of the following sketch when requesting data from arduino, on the browser screen you will see the following diagram:
One glance at the diagram allows you to understand the dynamics of a parameter change at predetermined time intervals.
The sketch is shown below:
svtg sketch
// data output using the web server in the form of a histogram
// author A. Konovalov 2015
// # include <UIPEthernet.h>
#include <Ethernet.h>
#include <SPI.h>
byte mac [] = {0xDE, 0xAD, 0xBE, 0xEF, 0xFE, 0xED};
IPAddress ip (192,168,26,15);
EthernetServer server (80);
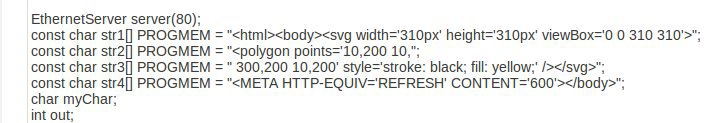
const char str1 [] PROGMEM = "";
const char str2 [] PROGMEM = "/>";
const char str4 [] PROGMEM = "";
char myChar;
int out;
unsigned long previousMillis1 = 0; // last time point
unsigned long previousMillis2 = 1; // last moment of time
unsigned long previousMillis3 = 1; // last moment of time
long OnTime2 = 60000; // minute
long OnTime3 = 600000; // half an hour
int In_sec = 0; // countdown per second
int In_min = 0; // countdown per minute
int In_half = 0; // countdown for half an hour
long Sum_min = 0; // amount per minute
long Sum_half = 0; // amount for half an hour
float Sum_base_min = 0;
float Sum_base_half = 0;
int i, j, k = 0;
void setup ()
{
Ethernet.begin (mac, ip);
server.begin ();
}
// unsigned long begMillis = millis (); // flowed in ms
void loop ()
{
unsigned long currentMillis = millis (); // flowed in ms
In_sec = analogRead (0);
Sum_min = Sum_min + (currentMillis - previousMillis1) * In_sec;
In_min = (Sum_min + Sum_base_min) / (OnTime2 * i + currentMillis - previousMillis2);
Sum_half = Sum_half + (currentMillis - previousMillis1) * In_sec;
In_half = (Sum_half + Sum_base_half) / (OnTime3 * j + currentMillis - previousMillis3);
previousMillis1 = currentMillis; // remember the moment of time
if (currentMillis - previousMillis2> = OnTime2)
{i = 1;
Sum_base_min = Sum_min;
previousMillis2 = currentMillis; // remember the moment of time
Sum_min = 0;
}
if (currentMillis - previousMillis3> = OnTime3)
{j = 1;
Sum_base_half = Sum_half;
previousMillis3 = currentMillis; // remember the moment of time
Sum_half = 0;
}
EthernetClient client = server.available ();
if (client) {
// an http request ends with a blank line
boolean currentLineIsBlank = true;
while (client.connected ()) {
if (client.available ()) {
char c = client.read ();
if (c == '\ n' && currentLineIsBlank) {
for (k = 0; k <strlen (str1); k ++)
{
myChar = pgm_read_byte_near (str1 + k);
client.print (myChar);
}
for (k = 0; k <strlen (str2); k ++)
{
myChar = pgm_read_byte_near (str2 + k);
client.print (myChar);
}
out = 200 - In_sec / 3;
client.print (out);
client.print ("100,");
client.print (out);
client.print ("250,");
out = 200 - In_min / 3;
client.print (out);
client.print ("300,");
out = 200 - In_half / 3;
client.print (out);
for (k = 0; k <strlen (str3); k ++)
{
myChar = pgm_read_byte_near (str3 + k);
client.print (myChar);
}
client.println ();
client.print (In_sec);
client.println ();
client.print (In_min);
client.println ();
client.print (In_half);
for (k = 0; k <strlen (str4); k ++)
{
myChar = pgm_read_byte_near (str4 + k);
client.print (myChar);
}
break;
}
if (c == '\ n') {
// you're starting a new line
currentLineIsBlank = true;
}
else if (c! = '\ r') {
// you gotten a character on the current line
currentLineIsBlank = false;
}
}
}
// give the data browser
delay (1);
// close the connection:
client.stop ();
}
}
// author A. Konovalov 2015
// # include <UIPEthernet.h>
#include <Ethernet.h>
#include <SPI.h>
byte mac [] = {0xDE, 0xAD, 0xBE, 0xEF, 0xFE, 0xED};
IPAddress ip (192,168,26,15);
EthernetServer server (80);
const char str1 [] PROGMEM = "";
const char str2 [] PROGMEM = "/>";
const char str4 [] PROGMEM = "";
char myChar;
int out;
unsigned long previousMillis1 = 0; // last time point
unsigned long previousMillis2 = 1; // last moment of time
unsigned long previousMillis3 = 1; // last moment of time
long OnTime2 = 60000; // minute
long OnTime3 = 600000; // half an hour
int In_sec = 0; // countdown per second
int In_min = 0; // countdown per minute
int In_half = 0; // countdown for half an hour
long Sum_min = 0; // amount per minute
long Sum_half = 0; // amount for half an hour
float Sum_base_min = 0;
float Sum_base_half = 0;
int i, j, k = 0;
void setup ()
{
Ethernet.begin (mac, ip);
server.begin ();
}
// unsigned long begMillis = millis (); // flowed in ms
void loop ()
{
unsigned long currentMillis = millis (); // flowed in ms
In_sec = analogRead (0);
Sum_min = Sum_min + (currentMillis - previousMillis1) * In_sec;
In_min = (Sum_min + Sum_base_min) / (OnTime2 * i + currentMillis - previousMillis2);
Sum_half = Sum_half + (currentMillis - previousMillis1) * In_sec;
In_half = (Sum_half + Sum_base_half) / (OnTime3 * j + currentMillis - previousMillis3);
previousMillis1 = currentMillis; // remember the moment of time
if (currentMillis - previousMillis2> = OnTime2)
{i = 1;
Sum_base_min = Sum_min;
previousMillis2 = currentMillis; // remember the moment of time
Sum_min = 0;
}
if (currentMillis - previousMillis3> = OnTime3)
{j = 1;
Sum_base_half = Sum_half;
previousMillis3 = currentMillis; // remember the moment of time
Sum_half = 0;
}
EthernetClient client = server.available ();
if (client) {
// an http request ends with a blank line
boolean currentLineIsBlank = true;
while (client.connected ()) {
if (client.available ()) {
char c = client.read ();
if (c == '\ n' && currentLineIsBlank) {
for (k = 0; k <strlen (str1); k ++)
{
myChar = pgm_read_byte_near (str1 + k);
client.print (myChar);
}
for (k = 0; k <strlen (str2); k ++)
{
myChar = pgm_read_byte_near (str2 + k);
client.print (myChar);
}
out = 200 - In_sec / 3;
client.print (out);
client.print ("100,");
client.print (out);
client.print ("250,");
out = 200 - In_min / 3;
client.print (out);
client.print ("300,");
out = 200 - In_half / 3;
client.print (out);
for (k = 0; k <strlen (str3); k ++)
{
myChar = pgm_read_byte_near (str3 + k);
client.print (myChar);
}
client.println ();
client.print (In_sec);
client.println ();
client.print (In_min);
client.println ();
client.print (In_half);
for (k = 0; k <strlen (str4); k ++)
{
myChar = pgm_read_byte_near (str4 + k);
client.print (myChar);
}
break;
}
if (c == '\ n') {
// you're starting a new line
currentLineIsBlank = true;
}
else if (c! = '\ r') {
// you gotten a character on the current line
currentLineIsBlank = false;
}
}
}
// give the data browser
delay (1);
// close the connection:
client.stop ();
}
}
The above sketches show how, using the simplest means, without using additional equipment and software, such as a web server and server-based data processing applications, to get an acceptable type of display of information from sensors under operating conditions. Of course, with this method of data transfer you must have a local network and for the operation of mobile devices, Wi-Fi access to this network.
When writing sketches a great help was provided by the guide for the developer , as well as the article on Habré “Introduction to SVG graphics” .
The UIP library is not included in the standard set, but can be downloaded here .
I hope, based on the examples of sketches given by me and links to training materials, it will be easy for you to make Arduino display graphics in a form that you like best.
PS As it turned out, Habr's spoiler ruthlessly gnawed pieces of html code from the sketches. Therefore, in order not to disappoint readers, I added bitten off fragments in the form of pictures.
Most delicious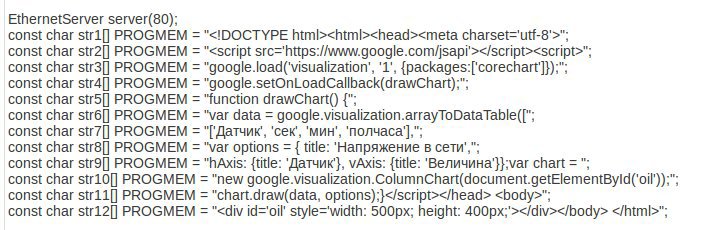
Source: https://habr.com/ru/post/259615/
All Articles