Search for periodic security elements of the RF Passport using the Fourier transform
Many documents contain security features such as holograms, watermarks, guilloches, etc. In the process of scanning such documents there is a problem - the security elements interfere with the recognition systems (OCR). In developing Smart PassportReader, we conducted a study aimed at finding and eliminating similar security elements from document images.
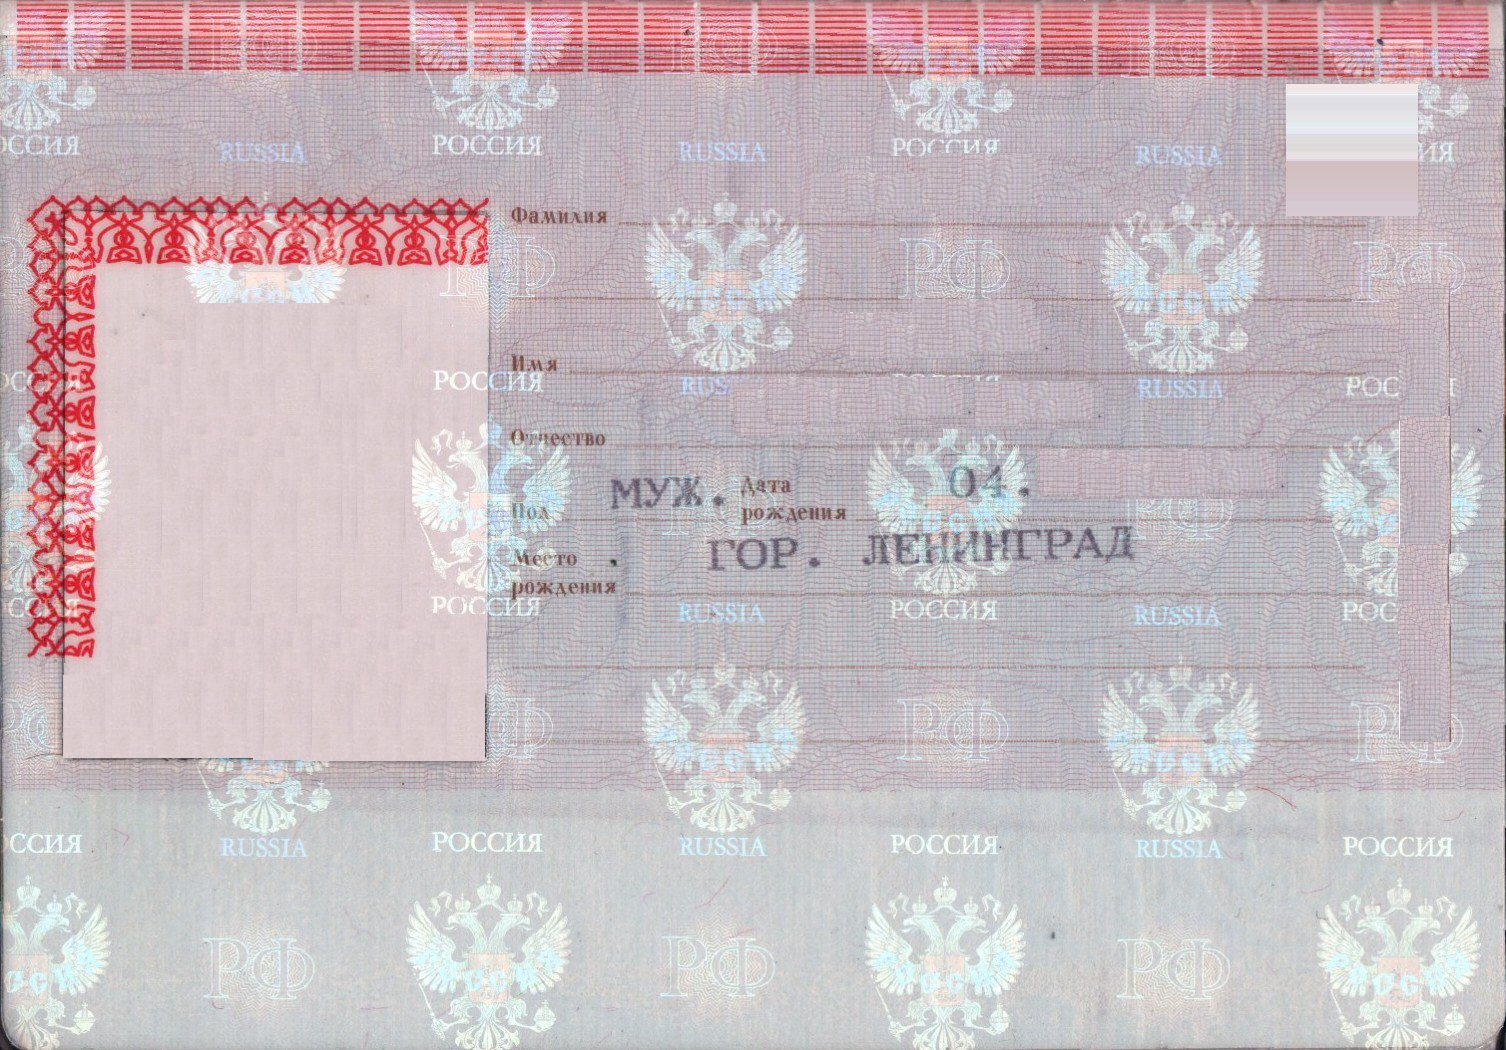
Consider the example of a passport of a citizen of the Russian Federation, on which it is easy to see a periodic holographic pattern.
')
If one learns to find such patterns, it becomes possible to use algorithms for eliminating security elements not on the entire image, but only in the presence of these elements, in order to preserve the maximum of useful information, since such algorithms often degrade the quality of informative image areas. In addition, recognition systems can use the fact that a security element is found in symbol areas to vary settings or reduce the level of confidence in the result.
In the article we will talk about the method of determining the presence (detection) of periodic patterns using the Fourier transform, which showed good results in detecting a holographic pattern on Russian passports.
To begin with, we show the model for the one-dimensional case, which is then easily transferred to the two-dimensional one.
Let I (x) be the original image of length N, consisting of two others: a background image h (x) and an image containing a periodic pattern g (x):

Usually, the background on the documents call everything except textual information; in this case, the background is all but a periodic pattern.
We can assume that the number of single copies (images of one “eagle” on the RF passport) that make up the template is known in advance and is equal to M. If they are evenly distributed, the period between them will be T = N / M. Then the template image g (x ) can be represented by the sum of single copies of f (x) shifted by the corresponding value:

However, the g (x) pattern can be presented in a more convenient way. Delta function is often used in signal processing. equal to one at x = 0 and zero otherwise. Now we will show by example what caused its popularity.
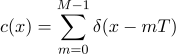
Consider the function c (x), composed of the sum of the delta functions with period T. It has delta functions where the corresponding instance of the pattern f (x) is located, and in other places - zeros. This function is called the Dirac comb (Dirac comb, because it reminds someone a comb) or the Impulse train.
The figure shows an example of the Dirac ridge for N = 256 and M = 8 (T = 256/8 = 32).

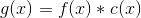
Then, the periodic signal of the pattern g (x) can be represented as a convolution of a single instance of the pattern f (x) with the Dirac crest c (x):
You can be sure that anyone who has just used the words “periodic” and “convolution” in one sentence will now begin to talk about the Fourier transform.
Denote the discrete Fourier transform (DFT) of g (x) as "\ mathcal {F} g (x)") . Recall that the DFT translates an array of numbers of length N into an array of complex numbers of the same length, where the k position contains information (amplitude and phase shift) of a harmonic with a frequency
. Recall that the DFT translates an array of numbers of length N into an array of complex numbers of the same length, where the k position contains information (amplitude and phase shift) of a harmonic with a frequency  constituting the original signal.
One of the most important properties of the Fourier transform is the convolution theorem, according to which the Fourier spectrum of the convolution of the original signals is the product of their Fourier spectra:
 = \ mathcal {F} f (x) \ cdot \ mathcal {F} c (x)")
Consider separately the DFT from the Dirac ridge") . It is known that the DFT of one delta function is equal to:
. It is known that the DFT of one delta function is equal to:
 = e ^ {- 2 \ pi i k x_0 / N}")
DFT is a linear transformation, i.e. The DFT sums of delta functions is the sum of the DFTs of individual delta functions, so we can write , as:
 = \ sum_ {m = 0} ^ {M - 1} {\ mathcal {F} _k \ delta (x - mT)} = \ sum_ {m = 0} ^ {M - 1} {e ^ {- 2 \ pi ikm T / N}} = \ sum_ {m = 0} ^ {M - 1} {e ^ {- 2 \ pi ik \ frac {m} {M}}}")
Integrated Exhibitor is periodic from
  with a period
  , but
, but  equals one. It is easy to see that for k, multiples of M (k = 0, M, 2M, ...), the sum becomes M, since each member of the sum becomes equal to one, and the whole of M. It is more difficult to notice that for the other values of k (not multiples of M) equals zero because all members of the sum cancel each other out. If it is interesting to prove this fact - try to draw on the circle M points with an interval
  (angle for the m-th point
  ), and then separately sum up their coordinates - first x, and then y.
We have obtained an important fact - the Fourier transform of the sum of M evenly distributed delta functions is also the sum of delta functions (multiplied by M), but already with a period of M:
 = M \ cdot \ sum_ {m} {\ delta (k - mM)}")
In other words, if M = 8 delta functions fit in the original signal from the previous illustration, then, regardless of the signal length, the DFT will have “peaks” every 8 positions, as shown in the figure (real parts are shown, since imaginary parts always equal to zero).

Let us return to the formula obtained from the convolution theorem. The final spectrum of the periodic template (for position / frequency k) <// tex.s2cms.ru/png/%5Cmathcal%7BF%7D%20g(x) "title =" \ mathcal {F} g (x) "/> is a product with a function that is zero everywhere except for uniformly distributed peak positions. It turns out that the whole product has a similar appearance:
 = \ begin {cases} M \ cdot \ mathcal {F} _k f (x), & \ text {if} k = 0, M, 2M, \ dots \\ 0, & \ text {otherwise} \ end {cases}")
Thus, we can easily “recognize” the periodic signal by looking only at its DFT.
So far, we have assumed that the first instance of the template is always at zero coordinates, which, of course, is not always the case. Moreover - the DFT of the shifted signal of the sum of the delta functions is not another sum of the delta functions that we showed earlier (non-zero imaginary parts begin to appear), so it’s not so easy to detect the shifted periodic signal ... or, can we? Fortunately, there is a simple way out of this situation.
Recall that each complex number in the DFT encodes the amplitude and phase shift of a single harmonic, and only the phase shift changes during the shift, and the amplitude remains the same. In addition, if the signal starts at zero, then the phase shift in it is zero, and since it consists only of real parts (imaginary ones are zero), then its amplitude is equal to itself. It turns out that even when the original signal is shifted, we can look not just at its DFT, but at the DFT amplitude, and see always the same thing that we would see if there is no shift.
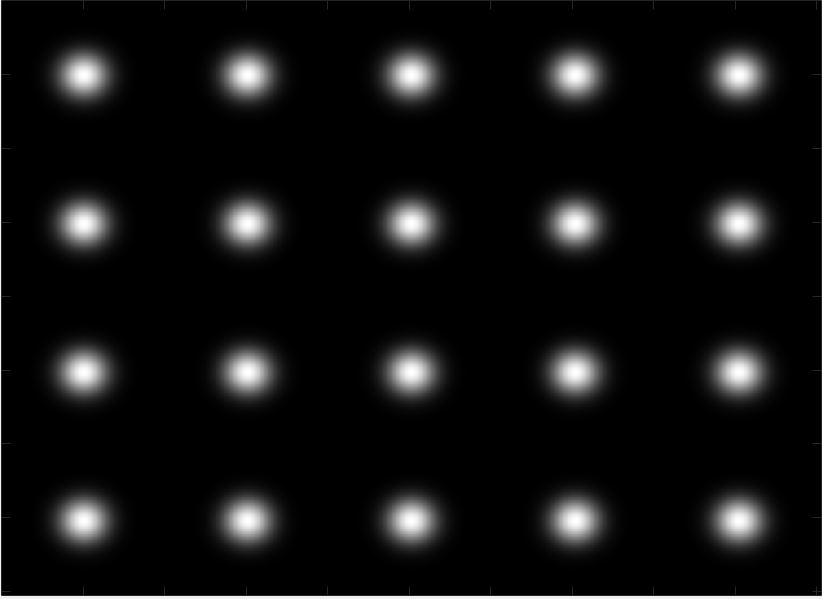
For two-dimensional images on which a periodic pattern is required to be detected, the situation is very similar: a vertical is added to the horizontal period, and a picture with “peaks” is still present on the DFT, but now it is two-dimensional. For example, for a 5x4 lattice from Gaussians, the DFT amplitude looks like this:
 ----> DFT ---->
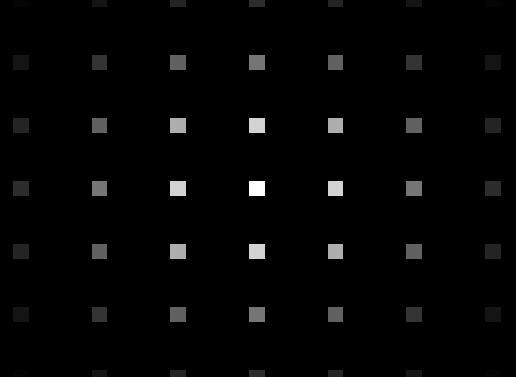
The distance between the peaks at the DFT is 5 horizontally, and 4 vertically, which is equal to the number of “contained” copies in the original image.
On the passports of the Russian Federation, the periodic holographic pattern looks somewhat different and looks like a chessboard:
 ----> DFT ---->
The amplitude of the DFT is also similar to a chessboard with a distance of 4 between the peaks vertically and horizontally, but the horizontal and vertical lines themselves pass through every 2 pixels. This is because the chessboard can be represented as the sum of two grids, one of which is shifted diagonally. Since the DFT is linear, the DFT of a chessboard will be the sum of the DFT of the grids.
Now we have all the necessary knowledge to proceed with the direct detection of a periodic pattern in the image.
The main idea of the method is to check the amplitude of the DFT image and make sure that it contains the expected structure of the peaks.
The first step is to cut out the region of the image that contains the very “chessboard” of holographic elements, with exactly two elements along each horizontal and vertical. Since we do not care how these elements are shifted, we can take any region of the correct size. However, it is useful to select a region of the image where a small amount of noise and the pattern are clearly visible, for example, instead of a region of a passport with a photo, you can take this:

It is important to very accurately determine the required size of the region, because even an error of 5% can severely spoil the DFT amplitude picture - the signal will no longer be periodic.
The next step we want to minimize the difference between each instance of the template, as well as to make the background as monotonous as possible and remove everything except the template itself (text, lines, etc.).
The easiest way is to greatly reduce the size of the image. In our case, we made the reduction to 56x58, when the original size was 910x938, i.e. 16 times on each side of the picture. In addition, you can use morphological closure to remove the remnants of text and other small details on the image:
---->  ---->
----> 
Finally, it's time to see how the DFT amplitude looks from the processed image in the vicinity of the center:
----> DFT ----> 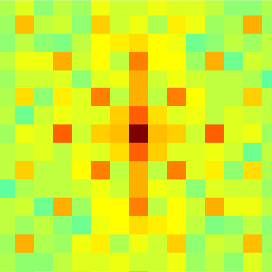
The figure clearly shows the structure of the peaks, which we expected. For clarity, we give an example of the DFT from the region of the image of the passport, which initially did not have a holographic pattern:
 ----> DFT ---->
It can be seen that the above-mentioned peak structure is not here.
To verify the presence of the peak structure, we used a very simple algorithm, which, nevertheless, showed excellent results.
Consider several potential peaks (for example, 3) closest to the center and for each position we calculate the minimum difference (without taking the module) between the values in the peak and its 8 neighbors. The idea is that if it is not a peak, then the minimum difference will be negative. Then, we can calculate the average among the received minima for each peak and compare it with a threshold value, for example, with zero. If the average is greater than the threshold, then we assume that the image has the required peak structure.
Let's once again describe the main steps of the method and their complexity:
It is important to note that all image processing and the subsequent discrete Fourier transform occurs in a strongly reduced picture, which, moreover, has a constant size N *, independent of the original image size. Therefore, we can count and say that the complexity of our algorithm is O (N), where N is the size of the original image, because everything else becomes constant.
Since N * is quite small (approximately 3250 pixels), the most time-consuming operation is actually reducing the size of the image, which works in linear time from the original image size, which, in fact, cannot be asymptotically improved (the image must be read somehow).
We used 3 sets with scanned images of RF passports: one of them is positive, i.e. containing images with holographic patterns, and the other two are negative. On the first of the negative sets there were Russian passports with printed text, and on the second - with a handwritten (yes, these still exist).
It can be seen that the percentage of false-positive and false-negative results is very low, although we didn’t do a subtle “fitting” of the parameters.
We proposed a method for detecting periodic patterns on document images, which uses DFT image analysis, and showed its successful application on RF passports.
Our method solves the problem of detection, i.e. yes / no answer to the question of the presence of a periodic pattern in the image. But is it possible to extend the method so that after positive detection he also said exactly where all the elements of this pattern are located? Yes, it is possible, and we are able to do it, and also through the analysis of the Fourier spectrum (now - the phase, not the amplitude), but about this - another time.
Consider the example of a passport of a citizen of the Russian Federation, on which it is easy to see a periodic holographic pattern.
')
If one learns to find such patterns, it becomes possible to use algorithms for eliminating security elements not on the entire image, but only in the presence of these elements, in order to preserve the maximum of useful information, since such algorithms often degrade the quality of informative image areas. In addition, recognition systems can use the fact that a security element is found in symbol areas to vary settings or reduce the level of confidence in the result.
In the article we will talk about the method of determining the presence (detection) of periodic patterns using the Fourier transform, which showed good results in detecting a holographic pattern on Russian passports.
Image model
To begin with, we show the model for the one-dimensional case, which is then easily transferred to the two-dimensional one.
Let I (x) be the original image of length N, consisting of two others: a background image h (x) and an image containing a periodic pattern g (x):
Usually, the background on the documents call everything except textual information; in this case, the background is all but a periodic pattern.
We can assume that the number of single copies (images of one “eagle” on the RF passport) that make up the template is known in advance and is equal to M. If they are evenly distributed, the period between them will be T = N / M. Then the template image g (x ) can be represented by the sum of single copies of f (x) shifted by the corresponding value:
However, the g (x) pattern can be presented in a more convenient way. Delta function is often used in signal processing.
equal to one at x = 0 and zero otherwise. Now we will show by example what caused its popularity.Consider the function c (x), composed of the sum of the delta functions with period T. It has delta functions where the corresponding instance of the pattern f (x) is located, and in other places - zeros. This function is called the Dirac comb (Dirac comb, because it reminds someone a comb) or the Impulse train.
The figure shows an example of the Dirac ridge for N = 256 and M = 8 (T = 256/8 = 32).
Then, the periodic signal of the pattern g (x) can be represented as a convolution of a single instance of the pattern f (x) with the Dirac crest c (x):
You can be sure that anyone who has just used the words “periodic” and “convolution” in one sentence will now begin to talk about the Fourier transform.
Discrete Fourier transform of a periodic pattern
Denote the discrete Fourier transform (DFT) of g (x) as
constituting the original signal.One of the most important properties of the Fourier transform is the convolution theorem, according to which the Fourier spectrum of the convolution of the original signals is the product of their Fourier spectra:
Consider separately the DFT from the Dirac ridge
. It is known that the DFT of one delta function is equal to:DFT is a linear transformation, i.e. The DFT sums of delta functions is the sum of the DFTs of individual delta functions, so we can write
, as:Integrated Exhibitor
is periodic from with a period , but equals one. It is easy to see that for k, multiples of M (k = 0, M, 2M, ...), the sum becomes M, since each member of the sum becomes equal to one, and the whole of M. It is more difficult to notice that for the other values of k (not multiples of M) equals zero because all members of the sum cancel each other out. If it is interesting to prove this fact - try to draw on the circle M points with an interval (angle for the m-th point We have obtained an important fact - the Fourier transform of the sum of M evenly distributed delta functions is also the sum of delta functions (multiplied by M), but already with a period of M:
In other words, if M = 8 delta functions fit in the original signal from the previous illustration, then, regardless of the signal length, the DFT will have “peaks” every 8 positions, as shown in the figure (real parts are shown, since imaginary parts always equal to zero).
Let us return to the formula obtained from the convolution theorem. The final spectrum of the periodic template (for position / frequency k) <// tex.s2cms.ru/png/%5Cmathcal%7BF%7D%20g(x) "title =" \ mathcal {F} g (x) "/> is a product with a function that is zero everywhere except for uniformly distributed peak positions. It turns out that the whole product has a similar appearance:
Thus, we can easily “recognize” the periodic signal by looking only at its DFT.
DFT when shifting the image of a periodic pattern
So far, we have assumed that the first instance of the template is always at zero coordinates, which, of course, is not always the case. Moreover - the DFT of the shifted signal of the sum of the delta functions is not another sum of the delta functions that we showed earlier (non-zero imaginary parts begin to appear), so it’s not so easy to detect the shifted periodic signal ... or, can we? Fortunately, there is a simple way out of this situation.
Recall that each complex number in the DFT encodes the amplitude and phase shift of a single harmonic, and only the phase shift changes during the shift, and the amplitude remains the same. In addition, if the signal starts at zero, then the phase shift in it is zero, and since it consists only of real parts (imaginary ones are zero), then its amplitude is equal to itself. It turns out that even when the original signal is shifted, we can look not just at its DFT, but at the DFT amplitude, and see always the same thing that we would see if there is no shift.
Two-dimensional case
For two-dimensional images on which a periodic pattern is required to be detected, the situation is very similar: a vertical is added to the horizontal period, and a picture with “peaks” is still present on the DFT, but now it is two-dimensional. For example, for a 5x4 lattice from Gaussians, the DFT amplitude looks like this:
----> DFT ----> The distance between the peaks at the DFT is 5 horizontally, and 4 vertically, which is equal to the number of “contained” copies in the original image.
On the passports of the Russian Federation, the periodic holographic pattern looks somewhat different and looks like a chessboard:
----> DFT ----> The amplitude of the DFT is also similar to a chessboard with a distance of 4 between the peaks vertically and horizontally, but the horizontal and vertical lines themselves pass through every 2 pixels. This is because the chessboard can be represented as the sum of two grids, one of which is shifted diagonally. Since the DFT is linear, the DFT of a chessboard will be the sum of the DFT of the grids.
Now we have all the necessary knowledge to proceed with the direct detection of a periodic pattern in the image.
Periodic pattern detection
The main idea of the method is to check the amplitude of the DFT image and make sure that it contains the expected structure of the peaks.
The first step is to cut out the region of the image that contains the very “chessboard” of holographic elements, with exactly two elements along each horizontal and vertical. Since we do not care how these elements are shifted, we can take any region of the correct size. However, it is useful to select a region of the image where a small amount of noise and the pattern are clearly visible, for example, instead of a region of a passport with a photo, you can take this:
It is important to very accurately determine the required size of the region, because even an error of 5% can severely spoil the DFT amplitude picture - the signal will no longer be periodic.
The next step we want to minimize the difference between each instance of the template, as well as to make the background as monotonous as possible and remove everything except the template itself (text, lines, etc.).
The easiest way is to greatly reduce the size of the image. In our case, we made the reduction to 56x58, when the original size was 910x938, i.e. 16 times on each side of the picture. In addition, you can use morphological closure to remove the remnants of text and other small details on the image:
----> ----> Finally, it's time to see how the DFT amplitude looks from the processed image in the vicinity of the center:
----> DFT ----> The figure clearly shows the structure of the peaks, which we expected. For clarity, we give an example of the DFT from the region of the image of the passport, which initially did not have a holographic pattern:
----> DFT ----> It can be seen that the above-mentioned peak structure is not here.
To verify the presence of the peak structure, we used a very simple algorithm, which, nevertheless, showed excellent results.
Consider several potential peaks (for example, 3) closest to the center and for each position we calculate the minimum difference (without taking the module) between the values in the peak and its 8 neighbors. The idea is that if it is not a peak, then the minimum difference will be negative. Then, we can calculate the average among the received minima for each peak and compare it with a threshold value, for example, with zero. If the average is greater than the threshold, then we assume that the image has the required peak structure.
The complexity of the method
Let's once again describe the main steps of the method and their complexity:
- Reducing the image size from N to N *: O (N)
- Thumbnail processing: O (N *)
- Fast discrete Fourier transform: O (N * log N *)
- Analysis of the presence of the peak structure on the amplitude of the Fourier spectrum: O (1)
It is important to note that all image processing and the subsequent discrete Fourier transform occurs in a strongly reduced picture, which, moreover, has a constant size N *, independent of the original image size. Therefore, we can count and say that the complexity of our algorithm is O (N), where N is the size of the original image, because everything else becomes constant.
Since N * is quite small (approximately 3250 pixels), the most time-consuming operation is actually reducing the size of the image, which works in linear time from the original image size, which, in fact, cannot be asymptotically improved (the image must be read somehow).
results
We used 3 sets with scanned images of RF passports: one of them is positive, i.e. containing images with holographic patterns, and the other two are negative. On the first of the negative sets there were Russian passports with printed text, and on the second - with a handwritten (yes, these still exist).
| Dataset description | Number of images | Accepted | Rejected |
|---|---|---|---|
| Positive | 484 | 99.38% | 0.62% |
| Negative typed text | 522 | 1.72% | 98.28% |
| Negative handwriting | 204 | 0.00% | 100.00% |
It can be seen that the percentage of false-positive and false-negative results is very low, although we didn’t do a subtle “fitting” of the parameters.
Conclusion
We proposed a method for detecting periodic patterns on document images, which uses DFT image analysis, and showed its successful application on RF passports.
Our method solves the problem of detection, i.e. yes / no answer to the question of the presence of a periodic pattern in the image. But is it possible to extend the method so that after positive detection he also said exactly where all the elements of this pattern are located? Yes, it is possible, and we are able to do it, and also through the analysis of the Fourier spectrum (now - the phase, not the amplitude), but about this - another time.
Source: https://habr.com/ru/post/259251/
All Articles