Basic troubleshooting in VMware vSphere or what to do if VM slows down
Something recently technical articles about virtualization (and not only about virtualization) are coming down to the format “in the new version such feature is expected”. It seems that the analysis of mechanisms and the description of experience, problems and solutions are of interest only to foreign experts. On the other hand, there is such a problem with the experts - if you study something, it becomes elementary and is taken for granted, so much so that writing about it is somehow silly. Especially if it was already described by someone somewhere. Sometime In some language. The following is the fruit of the consolidation of personal notes, initially intended for personal ordering of thoughts, but after arranging a considerable amount of text, I thought that it might be useful to someone.
A typical problem of “virtualizers” is the owner of the service, the customer or the user complains that his virtual machine is “slowing down”. Since virtualization involves the consolidation of a large number of VMs based on a single set of hardware resources, oversubscription (overprovision — when we assume that servers do not require the maximum of their resources at the same time, which means, for example, we can not push 10 servers of 4 GB in 40 GB GB of RAM, and 15, using Dynamic Memory), and in addition, servers can slow down due to errors in software components and their settings, then every time you have to decide what to grab and where to look first. Especially if there is no diagnostic information provided with such a capacious description of the problem as the “car slows down”, as it often happens. Under the cut a small guide for this case.
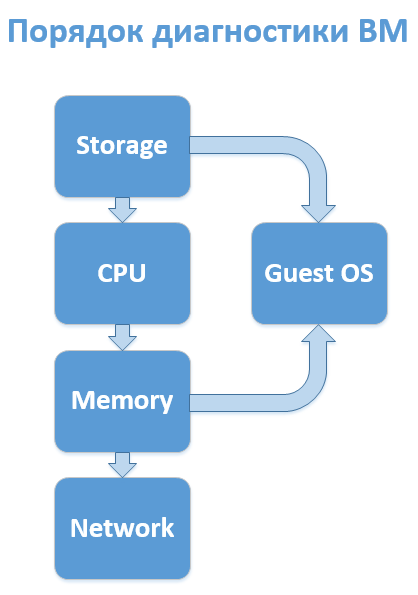
Of course, everything depends on the specificity of the implementation of a specific infrastructure, but practice shows that in most cases the following sequence of analysis of VM subsystems makes sense:
')
In practice, it almost never reaches the 4th stage, after the third (and even after the first) it makes sense to run (or request) a parallel diagnostics of the guest OS, but the disks should be checked right away - the most significant part of performance complaints is related to them. Unless, of course, you have an All-Flash array.
And now a little more on each item.
The key indicator here is Latency. Delay response time. It consists of a large number of intermediate elements and depends on a large number of factors. This includes the response time of the hypervisor, the signal transit time through cables and intermediate devices (switches, adapters and controllers), the time spent in queues on all these devices, if the load on them exceeds the norm, and some other details, such as equipment damage. However, leaving the nuances for the advanced diagnostics required in rare cases, we can distinguish a simple general indicator - the delay time from VM to disk.
Diagnostic Tools:
(Performance tab in vSphere Client and performance counters).
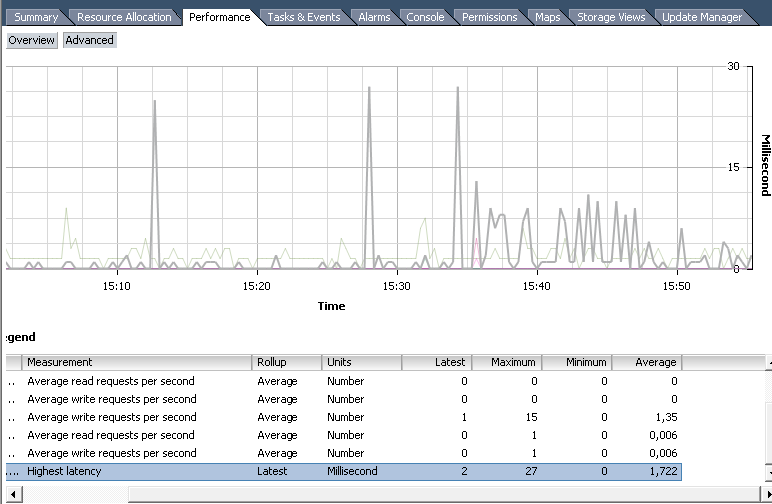
The most commonly used Disk group counters:
Highest Latency - the norm up to 10-15 ms. If regularly higher, you need to change something, although one-time peaks are not terrible;
Average write requests per second ;
Average read requests per second .
The most commonly used counters of the Virtual Disk group:
Read / Write latency ;
Average number of outstanding read / write requests - the number of simultaneous IO requests (if their number stays above 30 in total per datastor or per server, this will lead to additional delays);
Console utility ESX / ESXi. Provides a whole bunch of diagnostic information about an individual ESXi. Basic usage information can be obtained by pressing h after running the utility.

In terms of diagnosing the disk subsystem, the context of virtual disks will be useful (press v) and the context of HBA adapters (press d). In the latter case, you should pay attention to the following indicators:
KAVG (Kernel Latency Avg) - hypervisor response time (the norm is up to 1 ms);
DAVG (Device Latency Avg) - response time from HBA to disks (the norm is 10-15ms);
GAVG (Guest Latency Avg) - response time for the guest system = the sum of KAVG and DAVG
By the way, in the same area of research, you should immediately check if VM has a snapshot. And even a few. They can be a problem not only in performance, but also in the failures of backup operations, cloning and migration.
Here, an indicator similar in importance to disk delays is CPU Ready. Also pay attention to Used, Wait and Co-Stop. You can also monitor via the Performance Tab or ESXtop.
CPU Ready (% RDY) -% of the time when the VM is ready to perform some calculations, but the physical processors are currently busy with other processes (system or other VMs) and the virtual machine vCPUs are in standby mode. The norm is a value up to 10%. With the growth of this indicator above 40%, a high probability of failures and freezes of the guest OS develops. The cause of forced downtime can be:
Wait (% WAIT) -% of the time during which the VM waits for the end of some VMkernel activity. Most often this is disk IO activity. High indicators of this counter can speak about insufficiently fast response from the datastor. Also, the problem may be caused by incorrect operation of USB or COM ports or virtual CD / DVD-drives, in which the currently missing ISO is mounted.
Used (% USED) -% of the time during which the machine actually worked. If it is near zero, then the machine simply stands or is redesigned by processors. If it is about 100 (for each vCPU), then either it is undersized, or something is stuck in it (if it still doesn’t respond at the same time), or now some kind of quarterly report is being shoved there. This indicator is worth studying when thinking about “whether to give VMs more processors to work faster?”. If it has 4 cores and none is involved by more than 50%, then 8 cores will most likely not accelerate it. It may even slow down (see CPU Ready).
The diagnostic tools are the same.

Conveniently, you can see the data not only for the machine as a whole, but also for each core. In addition, statistics are available for the period. However, the information is provided not in percent, but in milliseconds. Since the data is not collected in real-time, but for a certain interval, it shows how much exactly the mc processor was in one or another state. You can convert to percents by dividing the value by the length of the interval and multiplying by 100%.
Example: in the figure a diagram with an interval of 20 seconds (real-time), that is, 20 000 ms. That is, the average CPU Ready will be 50288/20000 * 100% = 251.44%. Since the machine has 4 cores, not just one, we divide the result by 4 and we get almost 63%. The car suffers a lot. And all because it lies on the third level of nesting Resource Pools with low shares on each.
Once again, the conversion formula: <CPUReady value> / <statistics interval in ms> / <vCPU number> * 100% . It turns out 5% for 1000 ms for one core.

Here the value is indicated immediately in%. Only it is indicated immediately in the sum for all cores, so do not be afraid of numbers greater than 100. Divide by the number of vCPU machines.
The basic diagnosis here is simple - yes or no. If there is a balooning fact, then the host lacks memory and guest OS processes suffer because the paging file is actively used. If there is a swapping fact at the hypervisor level, it is necessary to take urgent measures - a machine caught in a swap falls into a coma in 100% of cases (at least in my practice). The above facts allow to determine such counters as
Balloon (MCTLSZ) - the amount of memory pulled by the baloon driver from the guest OS.
Swapped (SWCUR) is the amount of memory placed in .vswp (that is, on the hard disk).
For problems to be at the network level, in the case of complaints about a separate virtual machine, I remember in my practice only one case - when VDI used some kind of cheap webcam that drove an uncompressed video stream and scored 100 MB / s.
It is worth monitoring such counters:
Transmit Dropped Packets (% DRPTX) - the number (or percentage in the case of esxtop) of sent packets that have been dropped;
Receive Dropped Packets (% DRPRX) - The number (percentage) of received packets dropped.
A non-zero value that occurs on a regular basis indicates incorrect operation of network devices or incorrect configuration.
For basic diagnostics, covering more than half (perhaps up to 90%) of requests or their own needs in diagnostics and testing, this is enough.
A typical problem of “virtualizers” is the owner of the service, the customer or the user complains that his virtual machine is “slowing down”. Since virtualization involves the consolidation of a large number of VMs based on a single set of hardware resources, oversubscription (overprovision — when we assume that servers do not require the maximum of their resources at the same time, which means, for example, we can not push 10 servers of 4 GB in 40 GB GB of RAM, and 15, using Dynamic Memory), and in addition, servers can slow down due to errors in software components and their settings, then every time you have to decide what to grab and where to look first. Especially if there is no diagnostic information provided with such a capacious description of the problem as the “car slows down”, as it often happens. Under the cut a small guide for this case.
Of course, everything depends on the specificity of the implementation of a specific infrastructure, but practice shows that in most cases the following sequence of analysis of VM subsystems makes sense:
')
- Discs.
- CPU.
- RAM.
- Network
In practice, it almost never reaches the 4th stage, after the third (and even after the first) it makes sense to run (or request) a parallel diagnostics of the guest OS, but the disks should be checked right away - the most significant part of performance complaints is related to them. Unless, of course, you have an All-Flash array.
And now a little more on each item.
1. Disks (storage subsystem)
The key indicator here is Latency. Delay response time. It consists of a large number of intermediate elements and depends on a large number of factors. This includes the response time of the hypervisor, the signal transit time through cables and intermediate devices (switches, adapters and controllers), the time spent in queues on all these devices, if the load on them exceeds the norm, and some other details, such as equipment damage. However, leaving the nuances for the advanced diagnostics required in rare cases, we can distinguish a simple general indicator - the delay time from VM to disk.
Diagnostic Tools:
Performance tab
(Performance tab in vSphere Client and performance counters).
The most commonly used Disk group counters:
Highest Latency - the norm up to 10-15 ms. If regularly higher, you need to change something, although one-time peaks are not terrible;
Average write requests per second ;
Average read requests per second .
The most commonly used counters of the Virtual Disk group:
Read / Write latency ;
Average number of outstanding read / write requests - the number of simultaneous IO requests (if their number stays above 30 in total per datastor or per server, this will lead to additional delays);
ESXTop
Console utility ESX / ESXi. Provides a whole bunch of diagnostic information about an individual ESXi. Basic usage information can be obtained by pressing h after running the utility.
In terms of diagnosing the disk subsystem, the context of virtual disks will be useful (press v) and the context of HBA adapters (press d). In the latter case, you should pay attention to the following indicators:
KAVG (Kernel Latency Avg) - hypervisor response time (the norm is up to 1 ms);
DAVG (Device Latency Avg) - response time from HBA to disks (the norm is 10-15ms);
GAVG (Guest Latency Avg) - response time for the guest system = the sum of KAVG and DAVG
By the way, in the same area of research, you should immediately check if VM has a snapshot. And even a few. They can be a problem not only in performance, but also in the failures of backup operations, cloning and migration.
2. Processor
Here, an indicator similar in importance to disk delays is CPU Ready. Also pay attention to Used, Wait and Co-Stop. You can also monitor via the Performance Tab or ESXtop.
CPU Ready (% RDY) -% of the time when the VM is ready to perform some calculations, but the physical processors are currently busy with other processes (system or other VMs) and the virtual machine vCPUs are in standby mode. The norm is a value up to 10%. With the growth of this indicator above 40%, a high probability of failures and freezes of the guest OS develops. The cause of forced downtime can be:
- intensive consumption of processor resources by a large number of VMs, and the total number of vCPU significantly exceeds the number of logical cores (oversubscription).
- The presence of oversized VMs (virtual machines with a large number of underloaded vCPUs, for example, if the machine has 16 cores, each of which runs at 1-20% of power). The problem here is that with a large number of vCPUs, the hypervisor scheduler has to synchronize their work, which leads to periodic freezing of some cores or even the entire machine, until the total number of logical cores corresponding to the number of vCPUs required for a certain operation is released. The mechanism is called Co-Stop, and the corresponding counter will grow in this case. This is the main argument against tamping the virtual machine with virtual processors (the second argument is NUMA, but it is beyond the scope of the article). Better 2 cores loaded at 80% than eight cores at 20% each. In most cases.
- If CPU usage for a virtual machine is limited at the level of the Resource Pool or the machine itself. Upon reaching a certain threshold, the machine will not receive processor resources and will accumulate CPU Ready. In this case, the value of the Max-Limited counter (% ML) will increase.
Wait (% WAIT) -% of the time during which the VM waits for the end of some VMkernel activity. Most often this is disk IO activity. High indicators of this counter can speak about insufficiently fast response from the datastor. Also, the problem may be caused by incorrect operation of USB or COM ports or virtual CD / DVD-drives, in which the currently missing ISO is mounted.
Used (% USED) -% of the time during which the machine actually worked. If it is near zero, then the machine simply stands or is redesigned by processors. If it is about 100 (for each vCPU), then either it is undersized, or something is stuck in it (if it still doesn’t respond at the same time), or now some kind of quarterly report is being shoved there. This indicator is worth studying when thinking about “whether to give VMs more processors to work faster?”. If it has 4 cores and none is involved by more than 50%, then 8 cores will most likely not accelerate it. It may even slow down (see CPU Ready).
The diagnostic tools are the same.
Performance tab
Conveniently, you can see the data not only for the machine as a whole, but also for each core. In addition, statistics are available for the period. However, the information is provided not in percent, but in milliseconds. Since the data is not collected in real-time, but for a certain interval, it shows how much exactly the mc processor was in one or another state. You can convert to percents by dividing the value by the length of the interval and multiplying by 100%.
Example: in the figure a diagram with an interval of 20 seconds (real-time), that is, 20 000 ms. That is, the average CPU Ready will be 50288/20000 * 100% = 251.44%. Since the machine has 4 cores, not just one, we divide the result by 4 and we get almost 63%. The car suffers a lot. And all because it lies on the third level of nesting Resource Pools with low shares on each.
Once again, the conversion formula: <CPUReady value> / <statistics interval in ms> / <vCPU number> * 100% . It turns out 5% for 1000 ms for one core.
ESXTop
Here the value is indicated immediately in%. Only it is indicated immediately in the sum for all cores, so do not be afraid of numbers greater than 100. Divide by the number of vCPU machines.
3. RAM
The basic diagnosis here is simple - yes or no. If there is a balooning fact, then the host lacks memory and guest OS processes suffer because the paging file is actively used. If there is a swapping fact at the hypervisor level, it is necessary to take urgent measures - a machine caught in a swap falls into a coma in 100% of cases (at least in my practice). The above facts allow to determine such counters as
Balloon (MCTLSZ) - the amount of memory pulled by the baloon driver from the guest OS.
Swapped (SWCUR) is the amount of memory placed in .vswp (that is, on the hard disk).
4. Network
For problems to be at the network level, in the case of complaints about a separate virtual machine, I remember in my practice only one case - when VDI used some kind of cheap webcam that drove an uncompressed video stream and scored 100 MB / s.
It is worth monitoring such counters:
Transmit Dropped Packets (% DRPTX) - the number (or percentage in the case of esxtop) of sent packets that have been dropped;
Receive Dropped Packets (% DRPRX) - The number (percentage) of received packets dropped.
A non-zero value that occurs on a regular basis indicates incorrect operation of network devices or incorrect configuration.
For basic diagnostics, covering more than half (perhaps up to 90%) of requests or their own needs in diagnostics and testing, this is enough.
Source: https://habr.com/ru/post/259087/
All Articles