New to Wolfram SystemModeler: FMI Import
Functional Mock-up Interface (FMI) - an increasingly popular standard - was quickly adopted by industry. It is an independent standard and makes it possible to exchange models between different environments. We introduced FMI export to SystemModeler version 4.0. Exporting models in the format Functional Mock-up Unit (FMU) has various applications. First of all, FMU can be used in other environments and programming languages. FMU also protects your intellectual property by compiling the model code into a binary file, which can be useful when exchanging models with customers and colleagues. We are pleased to announce that Version 4.1 SystemModeler now supports FMI imports.

FMI import allows you to use subsystems from other environments in the modeling process in SystemModeler and Wolfram Language . You can explore imported models in SystemModeler by changing parameters and observing results, perform post-processing and visualization of simulation results from imported models using Wolfram Language. With automatic reports and cloud technologies, sharing results and analyzing simulation results becomes simple tasks.
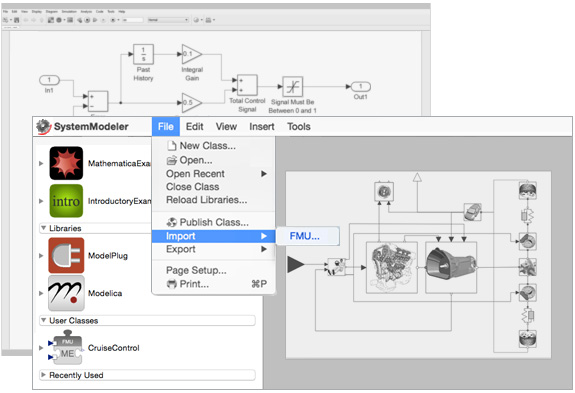
Let's take a look at what import and use of FMUs are. Drag an item into SystemModeler and follow the instructions in the dialog boxes to import the model into the class browser . Here's what the import of a model exported from Simulink using FMI Toolbox from Modelon looks like:
')

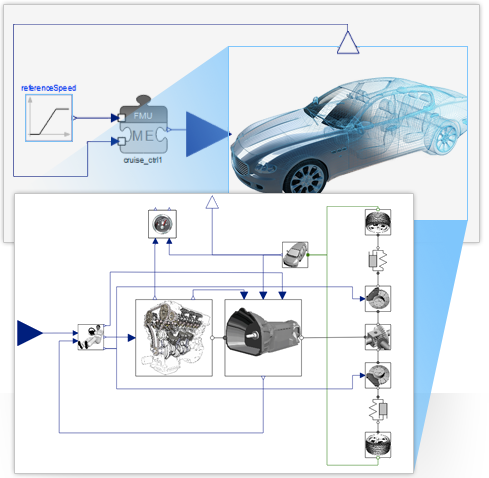
Now this item is available in SystemModeler and we can connect it with other components. In this case, this is a cruise control model. We connect it with a car model to see how it can control the speed of the car.

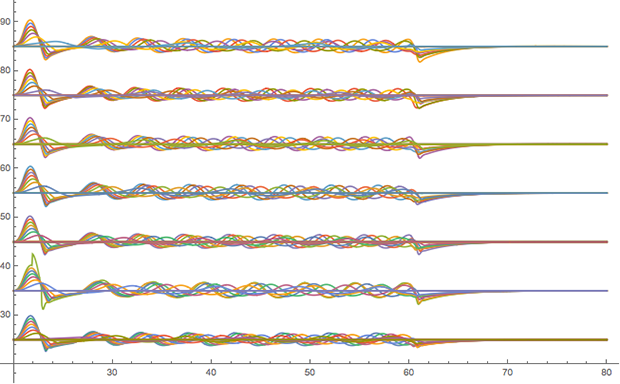
Next, we can parameterize Wolfram Language to analyze deviations when setting different speeds. These graphs show the speed deviations for the car when it goes down the slide:

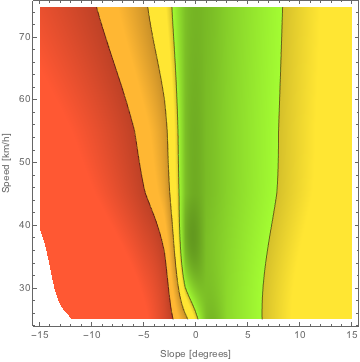
Another way to visualize the data is the DensityPlot function, which will show the relative speed deviation from the required one.

The graph shows that cruise control works best on a plane and small ascents. This area is shaded green - this color corresponds to a speed deviation of less than one percent. If you go at a speed of 40 km / h at an angle of two degrees, the deviation will be in this area. Red areas correspond to a speed deviation of more than 5%. If you go at a speed of 30 km / h at an angle of three degrees, then the deviation will be in this area.
FMI imports and exports are built into SystemModeler and do not require any additional purchases or special add-ons. With FMI, models created by experts in their fields can be presented to a wide range of consumers who will use them for some of their tasks in the field of modeling and analysis. There is an example of how to export a model from SystemModeler for use in other environments.

FMI import allows you to use subsystems from other environments in the modeling process in SystemModeler and Wolfram Language . You can explore imported models in SystemModeler by changing parameters and observing results, perform post-processing and visualization of simulation results from imported models using Wolfram Language. With automatic reports and cloud technologies, sharing results and analyzing simulation results becomes simple tasks.
Let's take a look at what import and use of FMUs are. Drag an item into SystemModeler and follow the instructions in the dialog boxes to import the model into the class browser . Here's what the import of a model exported from Simulink using FMI Toolbox from Modelon looks like:
')

Now this item is available in SystemModeler and we can connect it with other components. In this case, this is a cruise control model. We connect it with a car model to see how it can control the speed of the car.

Next, we can parameterize Wolfram Language to analyze deviations when setting different speeds. These graphs show the speed deviations for the car when it goes down the slide:

Another way to visualize the data is the DensityPlot function, which will show the relative speed deviation from the required one.

The graph shows that cruise control works best on a plane and small ascents. This area is shaded green - this color corresponds to a speed deviation of less than one percent. If you go at a speed of 40 km / h at an angle of two degrees, the deviation will be in this area. Red areas correspond to a speed deviation of more than 5%. If you go at a speed of 30 km / h at an angle of three degrees, then the deviation will be in this area.
FMI imports and exports are built into SystemModeler and do not require any additional purchases or special add-ons. With FMI, models created by experts in their fields can be presented to a wide range of consumers who will use them for some of their tasks in the field of modeling and analysis. There is an example of how to export a model from SystemModeler for use in other environments.
Source: https://habr.com/ru/post/259071/
All Articles