Blood vessel segmentation
Introduction
The retina, like any other object, has its symptoms. Its main features are blood vessels, the optical disk and the macular region (Fig. 1).
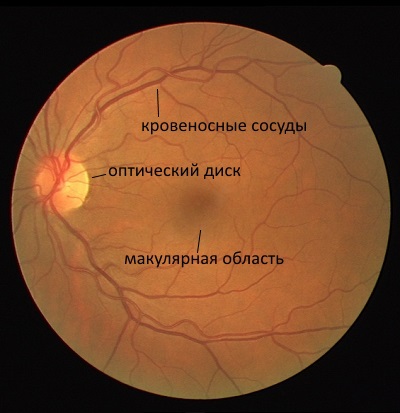
Fig. 1. The structure of the retina
As a rule, during authentication, only blood vessels or signs associated with them are compared, since their uniqueness is easily distinguishable. The disk can serve only as an additional parameter for comparison, however, it is used quite rarely. The macular area is not used for authentication purposes at all.
Blood vessel segmentation
Before proceeding to segmentation, in order to obtain more accurate results, it is necessary to improve the contrast between the background and the segmented object.
')
Improved contrast between background and blood vessels
When segmentation of blood vessels, the green channel is used instead of the usual gray one (fig. 2). This is done because the green channel contains the maximum local contrast between the background and the object.
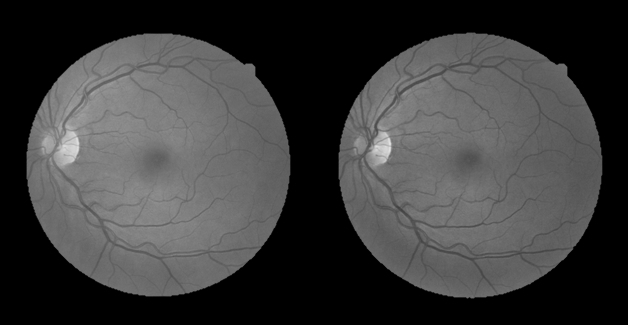
Fig. 2. An example from the DRIVE database (the gray channel is on the left, the green channel is on the right)
In addition to using the green channel, a contrast-limited adaptive histogram equalization (clahe) is used. The result of the algorithm is shown in Fig. 3
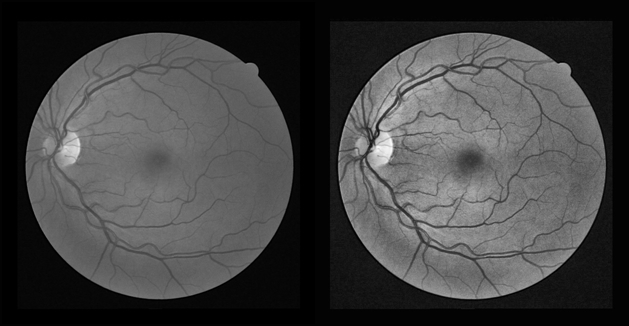
Fig. 3. Clahe (on the left - the original image, on the right - the image after applying the algorithm)
Fig. 2. An example from the DRIVE database (the gray channel is on the left, the green channel is on the right)
In addition to using the green channel, a contrast-limited adaptive histogram equalization (clahe) is used. The result of the algorithm is shown in Fig. 3
Fig. 3. Clahe (on the left - the original image, on the right - the image after applying the algorithm)
Remove background with average filter
To simplify vessel segmentation, the background is first removed. This is done by subtracting the original image from the smoothed average filter image. The size of the filter window is chosen equal to the maximum thickness of the vessels in pixels.
To remove the boundaries of a circle, its mask is calculated (Fig. 4) using a threshold transform and morphological discovery and subtracted from the image obtained at the previous step. Then again clahe is applied. The result is shown in Fig. five.

Fig. 4. Retina mask
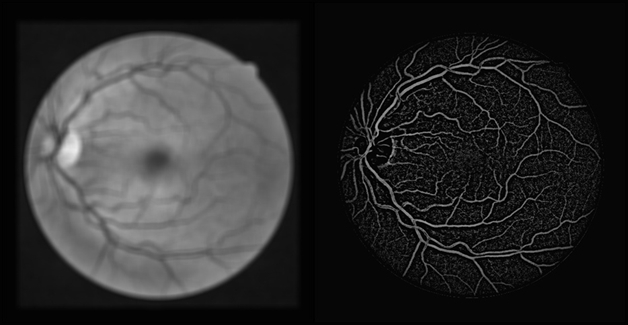
Fig. 5. Background removal (on the left - the result of the average filter, on the right - after subtraction and clahe)
Next, apply the automatic threshold conversion method Otsu, the median filter and the filter length. The result of the segmentation algorithm and the standard are shown in Fig. 6
For convenience, this segmentation algorithm and the background removal algorithm will both be referred to as background exclusion.
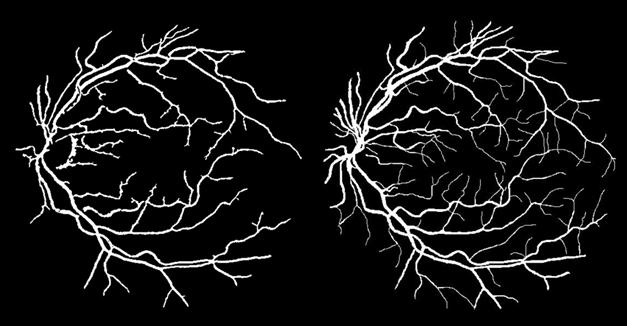
Fig. 6. Segmentation result (on the left - the result of the algorithm, on the right - the standard, manually marked by an expert)
Gabor filter
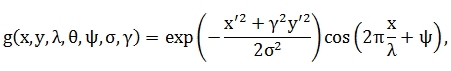
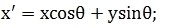
This segmentation method is based on the use of the Gabor filter series. A distinctive feature of this filter is that it is able to select straight lines of a certain size and at a certain angle.
The real part of this filter is as follows:
Where

 ,
,  - coordinates of the nucleus in predetermined limits;
 - core period in pixels;
 - the slope of the core;
 - Gaussian dispersion;
 - core phase shift;
 - gaussian compression.
Thus, to select the vessels, you need to apply a Gabor filter with different angles of inclination of the core and count the maximum response of each pixel to a series of filters.
As seen in fig. 7, most of the noise disappeared, but the optical disk, the background and the macular area still remained. To eliminate them, a background removal algorithm with the same parameters as in the previous section is applied before the Gabor filter series. The result is shown in Fig. eight.
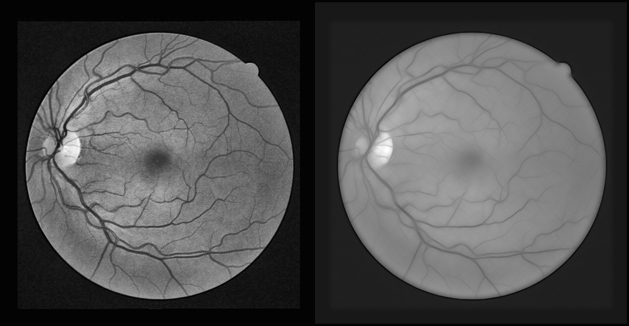
Fig. 7. Gabor filter (on the left - the original image after clahe, on the right - the result of applying a series of Gabor filters)

Fig. 8. Background removal + Gabor filter (on the left - the original image obtained using the background exclusion algorithm, on the right - the result of applying a series of Gabor filters)
The next step in the algorithm is the threshold transform.
In order for the Otsu method to show more accurate segmentation results, it is necessary to convert all the background colors into one color. To do this, consider the histogram of the right image in Fig. 8 (fig. 9):

Fig. 9. Histogram of the image obtained using the Gabor filter series
From the graph it is clear that the peak number of pixels falls on a gray background. Therefore, the pixels whose color is to the right of the peak can be repainted in a different color. However, a slight noise will still be present on the segmented image. To eliminate it, you can shift the threshold threshold from the peak to the left.
We introduce the sensitivity parameter of the algorithm from 0 to 100. The threshold for the conversion will be the closest color, the number of pixels of which does not exceed the value of the sensitivity parameter to the left of the peak. The value found will be the new value of the intensity of the pixels to the right of the border. The result is shown in Fig. ten.
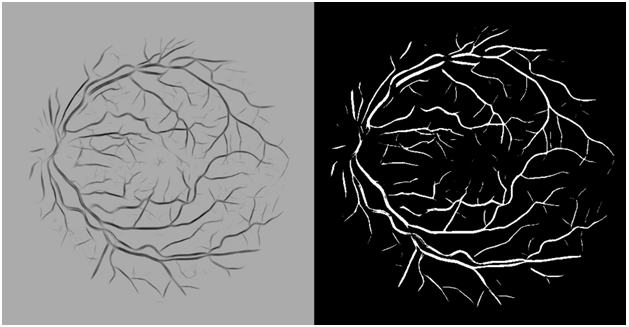
Fig. 10. Threshold conversion of the image intensity (on the left - the original image obtained after repainting pixels in accordance with the sensitivity parameter, on the right - the result of the Otsu method)
In the implementation, the Gabor filter was used with the following parameters:
- core size - 15 x 15;
- - four;
- - from 0 to 170 degrees in increments of 10;
- - one;
- - 0;
- - 0.15.
The above parameters were selected for the DRIVE database.
Testing segmentation algorithms
The algorithm was tested on two databases: DRIVE and STARE. The first base consists of 40 images captured with a Canon CR5 camera in a 24-bit color space and with a resolution of 565 x 584. The second database consists of 20 images captured with a TopCon TRV-50 camera in a 24-bit color space and c 700 x 605 resolution. Both databases provide manually marked out standards for vascular segmentation.
Algorithm performance parameters:
Efficiency of various blood vessel segmentation algorithms based on DRIVE database
Efficiency of various blood vessel segmentation algorithms based on STARE data
Algorithm performance parameters:
- P is the number of pixels corresponding to the vessels;
- N is the number of pixels corresponding to the background;
- TP is the number of pixels that are part of the vessel and defined as the pixel of the vessel;
- TN is the number of pixels that are not part of the vessel and are defined as background;
- FP - the number of pixels that are not part of the vessel and defined as the pixel of the vessel;
- FN - the number of pixels that are part of the vessel and defined as the background;
- Sensitivity = TP / (TP + FN);
- Specificity = TN / (TN + FP);
- Accuracy = (TP + TN) / (P + N).
Efficiency of various blood vessel segmentation algorithms based on DRIVE database
| Segmentation method | Accuracy | Sensitivity | Specificity |
|---|---|---|---|
| Human observer | 0.9473 | 0.7761 | 0.9725 |
| Staal et al. | 0.9442 | 0.7345 | 0.9773 |
| Niemeijer et al. | 0.9416 | 0.7145 | 0.9801 |
| Zana and klein | 0.9377 | 0.6971 | 0.9769 |
| Jiang and mojon | 0.9212 | 0.6399 | 0.9625 |
| Vlachos and Dermatas | 0.9285 | 0.7468 | 0.9551 |
| Wang et al. | 0.9461 | N / A | N / A |
| Martinez-Perez et al. | 0.9181 | 0.6389 | 0.9496 |
| Szpak and Tapamo | 0.9299 | N / A | N / A |
| Chaudhuri et al. | 0.8773 | 0.3357 | 0.9794 |
| Soares et al. | 0.9466 | N / A | N / A |
| Akram and Khan | 0.9469 | N / A | N / A |
| Mendonca and Campilho | 0.9463 | 0.7315 | N / A |
| Marin et al. | 0.9452 | 0.7067 | 0.9801 |
| Ricci and Perfetti | 0.9595 | N / A | N / A |
| Xiao et al. | 0.9529 | 0.7513 | 0.9792 |
| Yin et al. | 0.9267 | 0.6522 | 0.9710 |
| Chakraborti et al. | 0.9370 | 0.7205 | 0.9579 |
| Background exclusion | 0.9501 | 0.7183 | 0.9722 |
| Background exclusion + Gabor | 0.9580 | 0.7174 | 0.9809 |
Efficiency of various blood vessel segmentation algorithms based on STARE data
| Segmentation method | Accuracy | Sensitivity | Specificity |
|---|---|---|---|
| Human observer | 0.9354 | 0.8949 | N / A |
| Hoover | 0.9275 | 0.6751 | 0.9567 |
| Staal et al. | 0.9516 | 0.6970 | N / A |
| Jiang and mojon | 0.9009 | N / A | N / A |
| Marin et al. | 0.9526 | 0.6944 | 0.9819 |
| Ricci and Perfetti | 0.9584 | N / A | N / A |
| Soares et al. | 0.9480 | N / A | N / A |
| Akram and Khan | 0.9502 | N / A | N / A |
| Wang et al. | 0.9521 | N / A | N / A |
| Mendonca and Campilho | 0.9479 | 0.7123 | N / A |
| Xiao et al. | 0.9476 | 0.7147 | 0.9735 |
| Yin et al. | 0.9412 | 0.7248 | 0.9666 |
| Chakraborti et al. | 0.9379 | 0.6786 | 0.9586 |
| Background exclusion | 0.9562 | 0.7379 | 0.9742 |
| Background exclusion + Gabor | 0.9381 | 0.7918 | 0.9502 |
List of used sources and literature
- Marwan D. Saleh, C. Eswaran, and Ahmed Mueen. Annotated Blood Vessel Segmentation Algorithm Using Histogram, Vol. 24, No 4 (August), 2011, pp 564-572
- PC Siddalingaswamy, K. Gopalakrishna Prabhu. Retinal images // J. Biomedical Science and Engineering, 2010, 3, pp 101-107
- www.isi.uu.nl/Research/Databases/DRIVE
- www.ces.clemson.edu/~ahoover/stare
Continuation of feature matching
Source: https://habr.com/ru/post/259017/
All Articles