Recalculation of images for different cartographic projections in webGL
A post on his blog “gdal_translate and gdalwarp for reproducing images” described the process of obtaining images for different projections using GDAL utilities. I used the resulting images as substrates for maps in the examples of the dbCartajs project. Later, working on porting the canvas version of my planetarium to webGL, described in the article “Starry sky on webGL using three.js” on Habré, I had the idea to transfer not only the globe, but also flat ones to maps on webGL, using instead texture background. That is, to create a map to do only using a browser and javascript without using server components.
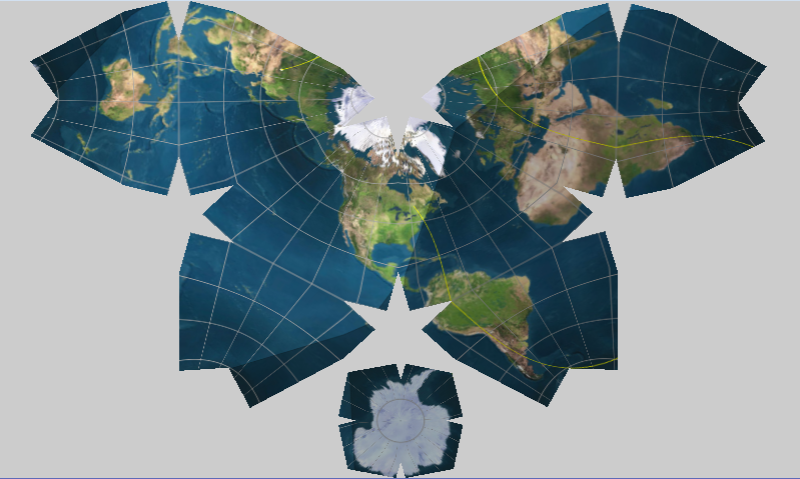
The thought remained a thought until I became acquainted with a very interesting example of displaying a picture in different projections on the webGL Spinnable World Maps by Marco Tarini. This example was shown by a work colleague a year ago, but I became interested in them recently. The example code is also interesting for the author’s original comments in Italian, such as punto centrale , mostra / nasconde griglia , movimento .
The Tarini code was saturated with calculations of just about anything: screen sizes, mouse cursor coordinates in pixels and triangles, coordinates of projection geometries, geometry rotation matrices. At the same time, the whole picture with meridians and colors is formed in shaders. I wanted to draw something on this map, say, the borders of the countries. But for this, we would have to insert the code for computing the line pixels into the shader code, as with the case of meridians, and this is too much. Therefore, the idea arose to combine the image of the map in the canvas 2d with the reprojection through webGL and Tarini formulas. That is, use canvas as a source of texture to overlay geometry. The source code for Three.js contains such examples.
')
From the Spinnable Maps code I took mainly computational functions:
* to calculate the coordinates of vertices (geometry.vertices) and triangles (geometry.faces) of geometry: buildEquirectangular, buildCircleMap, buildLambert, ...
* to calculate coordinates from the VertexOnSphere array: f_equirectangular, f_lambert, f_orthographic, ... The VertexOnSphere array is transferred to the vertex shader, where the XYZ coordinates are converted to XY to cut the texture into triangles. Actually here is the reproducing of the picture. The formulas are similar to the calculations from the Proj4js module, which was used for the 2d card.
From examples dbcartajs - logic of creating a map by layers, recalculation of mouse coordinates in pixels, timer. The result of the merger of the two projects can be seen in the example “Projection 3d” .
You can control the map with the mouse. When dragging with the mouse, the map rotates along a sphere along 3 axes, and not a displacement on a plane. This gives rise to the effect of infinite looping of the map along the X axis. Switching projections, as well as managing layers and devices, is available through lists.
Source: https://habr.com/ru/post/258415/
All Articles