5 tools to help analyst
Data is becoming more and more, so now more than ever it is important to have the necessary tools for data analysis and decision making. Today we will talk about five popular analytical systems.

Content
Power Query is a tool for integrating data into Excel from external sources.
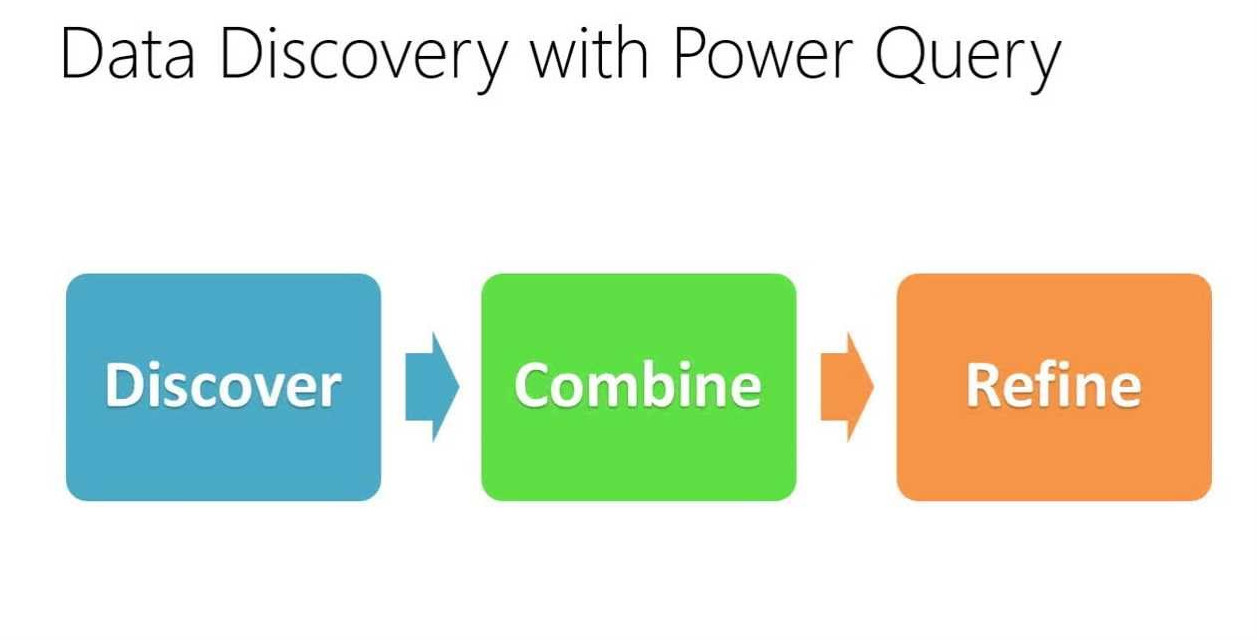 Power Query allows you to search and discover data from various sources available online and through corporate networks. He can load data of different types, formats and structures into Excel, as well as from completely different sources:
A detailed description can be found here .
')
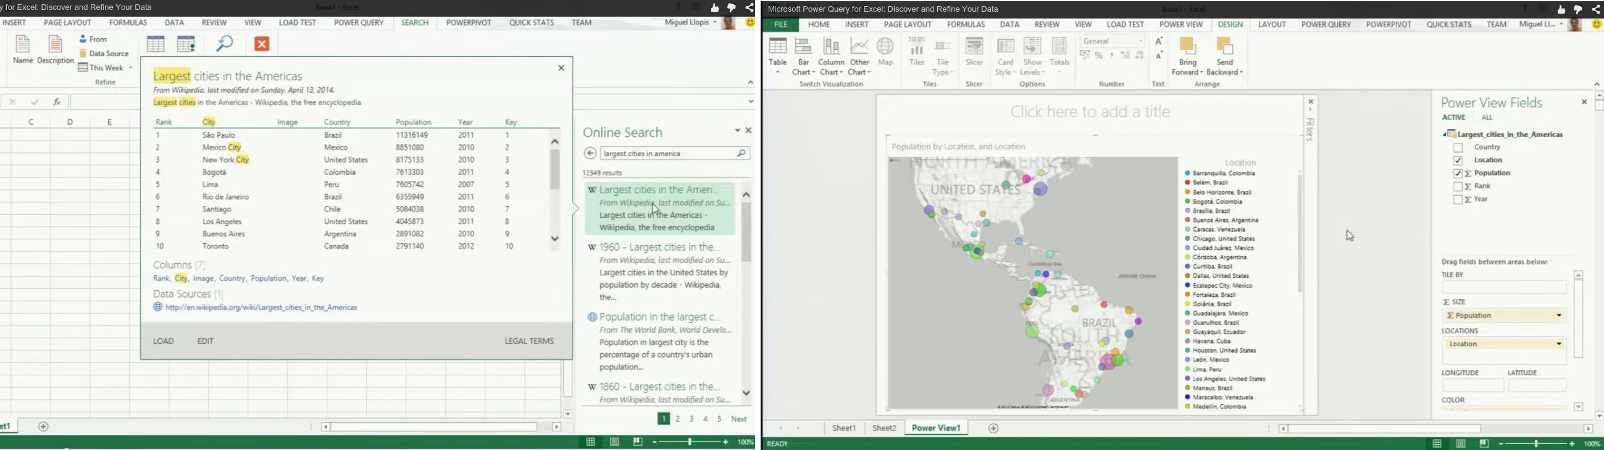
Power Query allows you to import external (seven) -structured data sources and process them in Excel. The example below shows the largest cities in North and South America on a map according to their population.
(clickable)
It is also possible to import letters as a data source and analyze them in Outlook. The example below demonstrates the import of mail and creates a histogram by the number of letters from a person, that is, with whom the correspondence occurs most often.

(clickable)
Pros : PowerQuery is one of the most powerful tools, with broad functionality for analysis on the one hand, on the other hand it is rather difficult to learn, and is used mainly by analysts. Works with both tabular models and multidimensional. Able to connect additional sources
Cons : Not suitable for "ordinary" users, difficult to learn, rather slow. There is no possibility of separation of access, restrictions on the size of files / records, etc.
Additional materials
Download here
Power BI is a tool for creating interactive business reports with the possibility of collaboration, visualization and interactive work.

Key features:
An example of a report that can be published on the web and is available for interaction and research by other participants.

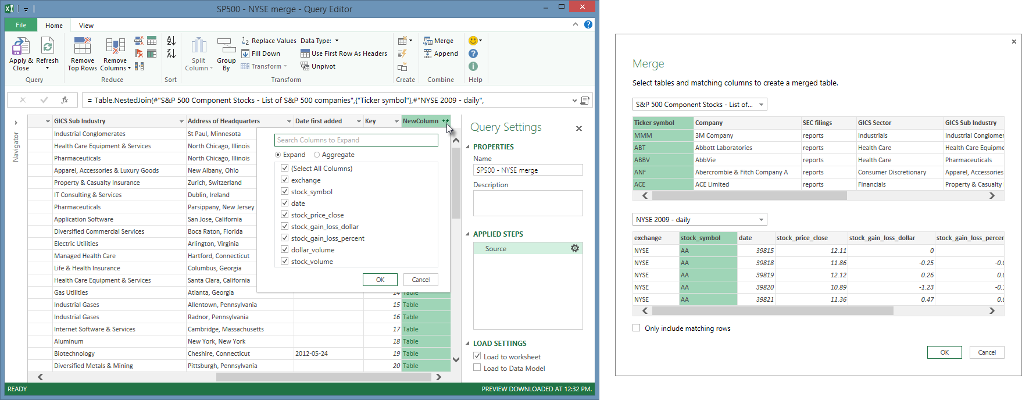
Example with queries and pooling sources: combining sources from the New York Stock Exchange and the S & P 500 financial index.
(clickable)
Read more here .
Pros : new modern product, user-friendly interface, easy to learn, online solution.
Disadvantages : the solution is “raw” (some components may work unstable), does not work with OLAP cubes, reduced functionality in comparison with competitors.
Additional materials:

Pyramid Analytics is a cloud-based business intelligence platform; It has three key components:
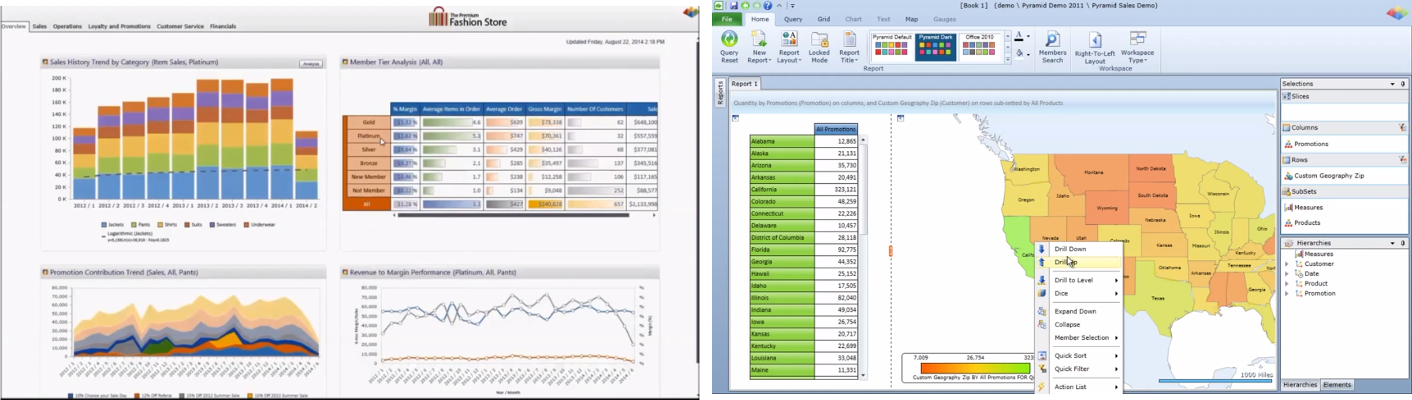
Report examples with geo-visualization and data mining capability.
Intro video:
( Pyramid Analytics youtube channel )
The platform has the ability to collaborative analytics and data modeling , as well as a number of other useful features:
PyramidAnalytics is the most powerful tool we use.
Pros : easy to learn, works with a huge number of sources, very wide functionality.
Cons : price.
SQL Server allows you to analyze inside your ecosystem. It has an extensive set of components and we will focus on the three most famous ones.
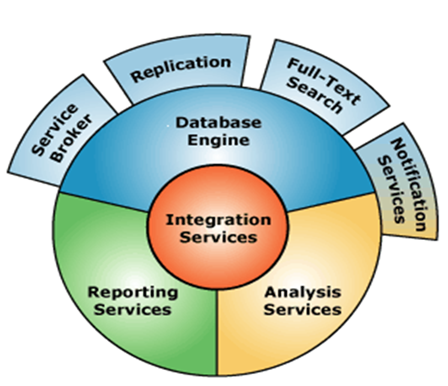
Master Data Services - processes and tools for managing the company's master data. Read more here .
(Master data is business data: about clients, products, services, personnel, technologies, materials, etc.)
SQL Server Integration Services - data migration and integration. Read more here .
SQL Server Analysis Services OLAP and data mining within SQL Server. Read more here .
Probably difficult to confuse the four graphs shown below. However, if instead of visualization, we would calculate the average value, variation, correlation and build a regression based on them, then we would be surprised to get exactly the same result.
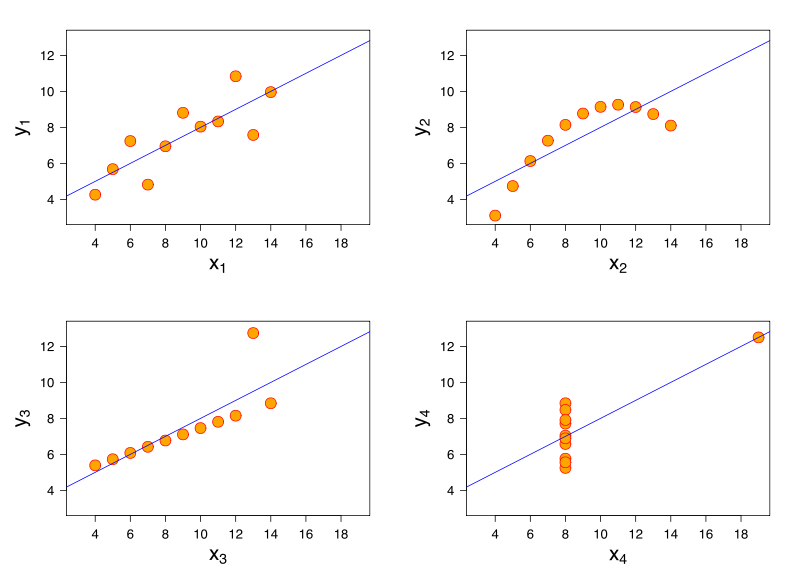
( Anscombe's quartet )
This is a clear example of the fact that no matter how we optimize the decision making process, the analyst needs to carry out Exploratory Data Analysis. For this, he also needs tools, but in a slightly different way. This is primarily the possibility of interactive work and data processing, as well as their transformation and visualization. Imagine a brief selection of available tools and materials on the example of the python language and visualization works (with typical errors indicated).
Data Visualization:
Interactive work with data in python:
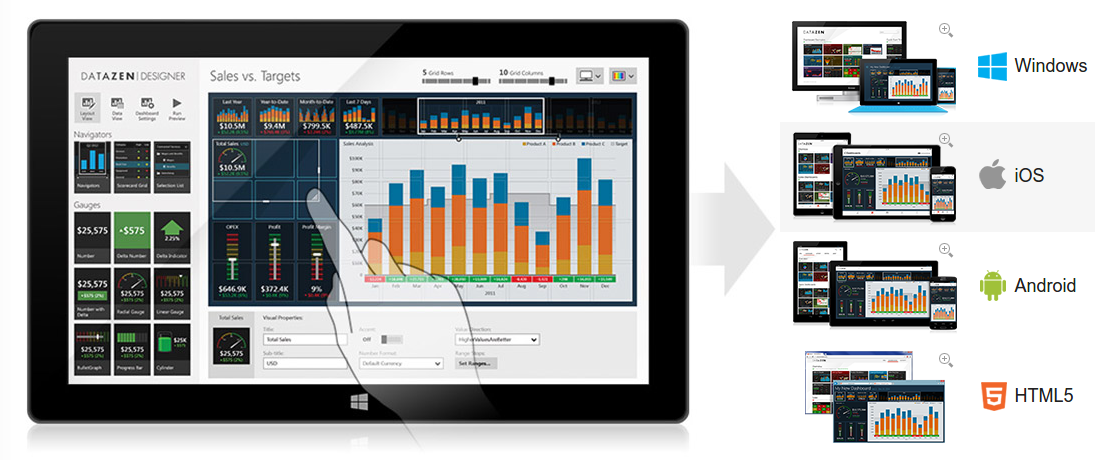
In the process of writing the article, Microsoft announced the purchase of an analytics tool from Datazen , so it would be useful to briefly mention it.
Datazen is a multi-platform solution that allows you to build reports, regardless of platform (PC, iOS, Android, Windows Phone). A distinctive feature of the product is wide integration and the possibility of full-fledged work of the analytical platform through mobile devices.
Pros : supports a wide range of platforms, supported and developed MS, works with a large number of sources.
Minuses : Does not work with OLAP directly (you need to create MDX queries yourself), has a number of limitations (starting from interface capabilities and ending with customization of functionality), is not sold separately, comes bundled with MS SQL Enterprise Edition.
In the next article, we will look at Datazen and Pyramid Analytics in detail, and also figure out how to create reports on their basis.
Content
- MS Excel Power Query
- MS Power BI
- Pyramid Analytics
- Analytics components MS SQL server (MDS, SSIS, SSAS)
- Main analyst tool
MS Excel Power Query
Power Query is a tool for integrating data into Excel from external sources.
Power Query allows you to search and discover data from various sources available online and through corporate networks. He can load data of different types, formats and structures into Excel, as well as from completely different sources:- From the network
- From file (Excel, CSV, XML, text or folder with metadata and links)
- From a database file (SQL Server, Access, Oracle, IBM DB2, MySQL, PostgreSQL etc)
- From public data sources and corporate data repositories (ETL support is built in)
- From a number of other sources, SharePoint List, OData feed, Active Directory, Facebook etc
A detailed description can be found here .
')
Wiki source
Power Query allows you to import external (seven) -structured data sources and process them in Excel. The example below shows the largest cities in North and South America on a map according to their population.
(clickable)
Import and analyze emails in Outlook
It is also possible to import letters as a data source and analyze them in Outlook. The example below demonstrates the import of mail and creates a histogram by the number of letters from a person, that is, with whom the correspondence occurs most often.
(clickable)
Pros : PowerQuery is one of the most powerful tools, with broad functionality for analysis on the one hand, on the other hand it is rather difficult to learn, and is used mainly by analysts. Works with both tabular models and multidimensional. Able to connect additional sources
Cons : Not suitable for "ordinary" users, difficult to learn, rather slow. There is no possibility of separation of access, restrictions on the size of files / records, etc.
Additional materials
- Intro video
- Deep Dive into the Query language (video)
- Compilation of video one and two
- Selection of articles from Microsoft
Download here
MS Power BI
Power BI is a tool for creating interactive business reports with the possibility of collaboration, visualization and interactive work.
Key features:
- Rapid development of informative business reports and panels (online) - with the ability to interact and research data.
- Automatic update of BI reports and visualization when data changes
- Query language support, including Power Query. The possibility of interaction between participants at the request level.
- Creating a data directory with indexes to search.
- Query language close to natural (for business analyst) and the possibility of interactive work.
- Mobile support
An example of a report that can be published on the web and is available for interaction and research by other participants.
Example with queries and pooling sources: combining sources from the New York Stock Exchange and the S & P 500 financial index.
(clickable)
Read more here .
Pros : new modern product, user-friendly interface, easy to learn, online solution.
Disadvantages : the solution is “raw” (some components may work unstable), does not work with OLAP cubes, reduced functionality in comparison with competitors.
Additional materials:
- Introductory video in Power BI
- Online demo
- An example of using Power BI for financial analysis
- Feature Overview (video)
- World Cup history analysis using Excel and Power BI
Pyramid Analytics
Pyramid Analytics is a cloud-based business intelligence platform; It has three key components:
- Data Mining - Data Discovery
- Interactive work with data and visualization - Dashboards
- Audience Data Presentation - Publisher
Report examples with geo-visualization and data mining capability.
Intro video:
( Pyramid Analytics youtube channel )
The platform has the ability to collaborative analytics and data modeling , as well as a number of other useful features:
PyramidAnalytics is the most powerful tool we use.
Pros : easy to learn, works with a huge number of sources, very wide functionality.
Cons : price.
Analytics components MS SQL server (MDS, SSIS, SSAS)
SQL Server allows you to analyze inside your ecosystem. It has an extensive set of components and we will focus on the three most famous ones.
Master Data Services - processes and tools for managing the company's master data. Read more here .
(Master data is business data: about clients, products, services, personnel, technologies, materials, etc.)
SQL Server Integration Services - data migration and integration. Read more here .
SQL Server Analysis Services OLAP and data mining within SQL Server. Read more here .
The main tool is the brain
Probably difficult to confuse the four graphs shown below. However, if instead of visualization, we would calculate the average value, variation, correlation and build a regression based on them, then we would be surprised to get exactly the same result.
( Anscombe's quartet )
This is a clear example of the fact that no matter how we optimize the decision making process, the analyst needs to carry out Exploratory Data Analysis. For this, he also needs tools, but in a slightly different way. This is primarily the possibility of interactive work and data processing, as well as their transformation and visualization. Imagine a brief selection of available tools and materials on the example of the python language and visualization works (with typical errors indicated).
Data Visualization:
Interactive work with data in python:
- IPython smart interactive console
- Pandas analysis
- Visualization inside the python environment of Matplotlib
- The interaction between R and python R2py
- Interactive web graphics in plotly
Bonus tool
In the process of writing the article, Microsoft announced the purchase of an analytics tool from Datazen , so it would be useful to briefly mention it.
Datazen is a multi-platform solution that allows you to build reports, regardless of platform (PC, iOS, Android, Windows Phone). A distinctive feature of the product is wide integration and the possibility of full-fledged work of the analytical platform through mobile devices.
Pros : supports a wide range of platforms, supported and developed MS, works with a large number of sources.
Minuses : Does not work with OLAP directly (you need to create MDX queries yourself), has a number of limitations (starting from interface capabilities and ending with customization of functionality), is not sold separately, comes bundled with MS SQL Enterprise Edition.
In the next article, we will look at Datazen and Pyramid Analytics in detail, and also figure out how to create reports on their basis.
Source: https://habr.com/ru/post/258151/
All Articles