Bluetooth heart rate monitor or photoplethysmograph device. Part 1
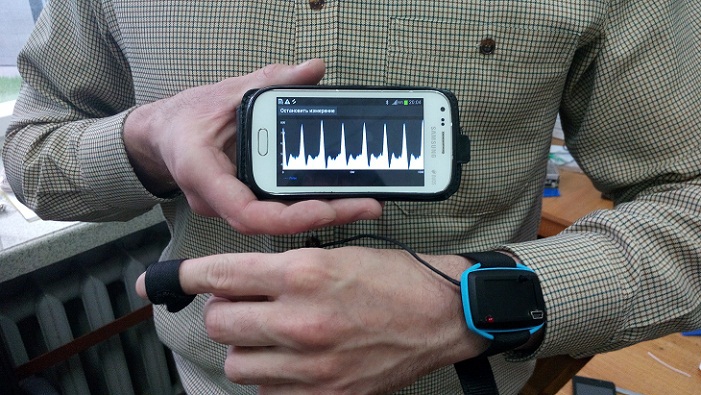
In this article you will learn about the design of the device, which allows to measure the pulse wave and transmit data via radio to the android device.
Lyrical introduction
Photoplethysmograph - a device that determines the change in the size of human organs using photosensitive elements. It can be used to measure the pulse. In this case, a change in the intensity of light from an artificial source due to the passage of a pulse wave is recorded. As a rule, the last phalanx of the finger, the earlobe, the wrist, or the temple is used for registration. Very often the principle of photoplethysmography is used in various sports accessories.
To register photoplethysmogram you need a light source and a photodetector. The source is usually an LED, and the receiver is a phototransistor or photodiode. The light emitted by the source is absorbed by the human body. In the first approximation, we can say that the degree of absorption depends on the amount of blood in the point of the body where the sensor is located. When the amount of blood changes, the absorption of light and the signal at the output of the photodetector change.
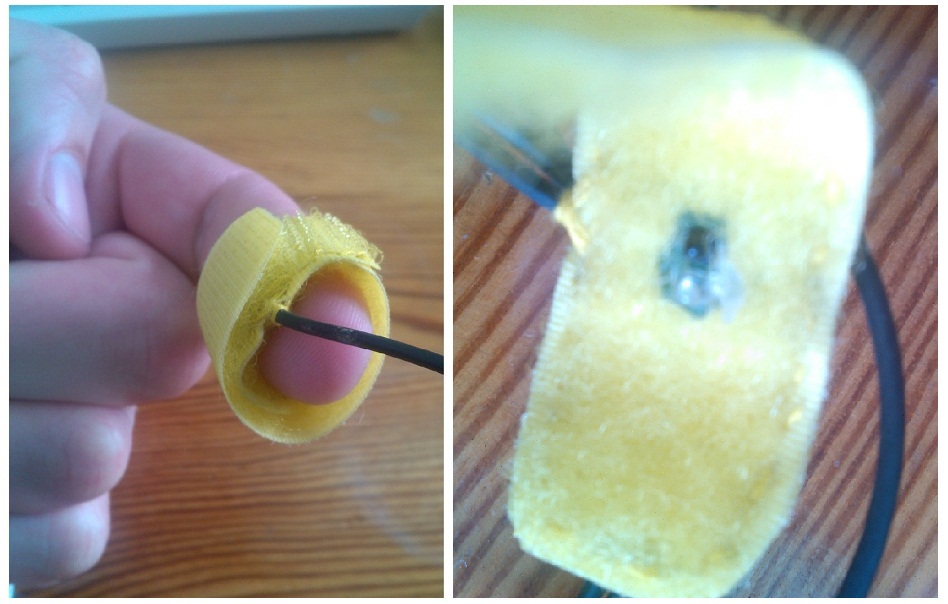
In relation to each other, the source and receiver can be arranged in two ways. These methods are called "reflection" and "light". In the case of "reflection" receiver and source are located in the same plane. Light from the source hits the skin, is partially absorbed and, reflected, hits the receiver. The following figure is a self-produced sensor. It consists of a printed circuit board, with a phototransistor and a LED soldered to it. The wire goes to the measuring box.
')
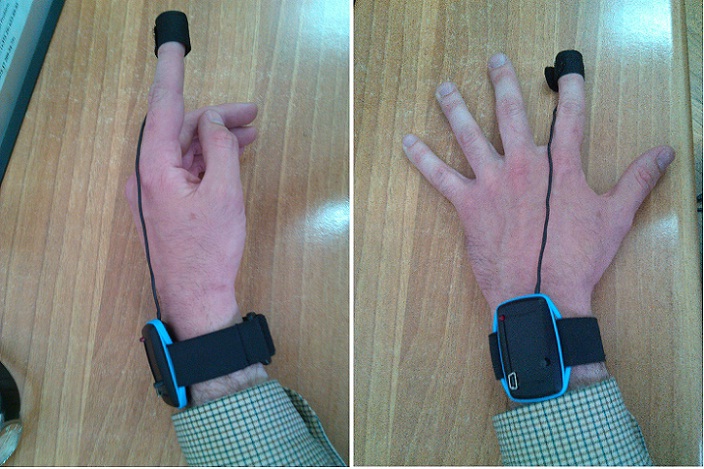
In the variant "on the lumen," the source and receiver are located on opposite sides of the body part. In the following picture, they are in different halves of the pulsator clip. The emitted light passes through the finger and enters the photodetector. This clip is designed to measure the pulse from the earlobe. There is a finger in the picture, because it is more convenient to photograph it.

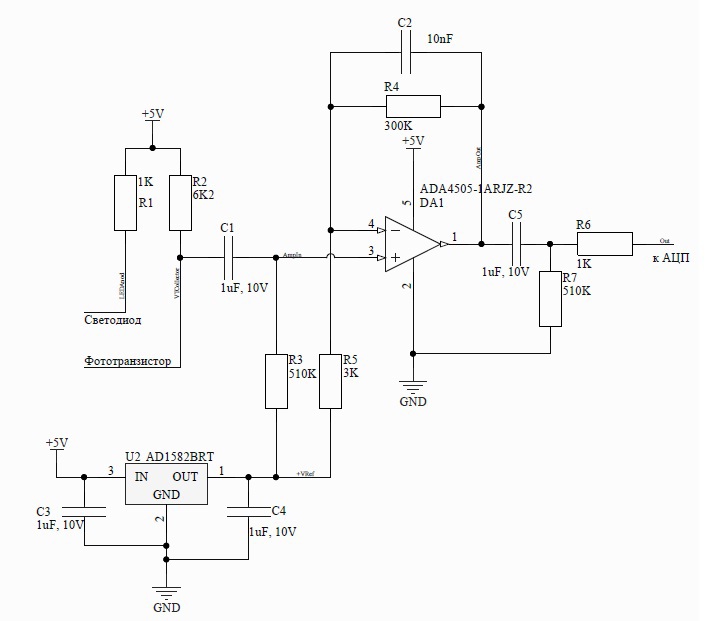
The signal from the photodetector enters the amplification and filtering circuit. An example of such a scheme is shown in the following figure. Resistors R1 and R2 set the LED current and the operating point of the phototransistor, respectively. The separation capacitor C1 removes the constant component, which occurs due to the illumination of the room where the measurement takes place. Pull-up resistor R3 shifts the voltage in the positive region (as the amplifier is unipolar). The shear stress is also fed into the feedback of the amplifier to avoid saturation. After amplification, the signal enters another separation stage to finally remove the shear stress. Then the data is digitized using an ADC.
This scheme is common, but not the only one. Anyone can follow the link to an interesting article of the company Microchip. In addition to measuring the pulse using photodiodes, you will read there about the principles of measuring blood oxygen saturation (oxygenation), it also shows the typical circuit solutions used, and programs for the microcontroller. By the way, quite recently, the Microchip has a demo board for pulse metering.
Description of photoplethysmograph
To increase the mobility of the pulsogram measurement, a device was developed that contains a “reflection” sensor, an amplification circuit, a microcontroller, and a radio module HC-05 of the bluetooth standard.


Operating principle
The main element of the sensor is the PIC16F1705 microcontroller. He has onboard a built-in operational amplifier, an ADC, a DAC, a COM port and enough resources to carry out simple calculations. The originally developed circuit for switching on the amplifier corresponded to the one given above. After testing, some nodes have been changed. In particular, a 47 μF capacitor was added to the feedback instead of the bias voltage. It performs the function of eliminating the DC component, which is created by a voltage divider. To reduce power consumption, the LED is connected to the output of the DAC, which only works at the time of sampling ADC data. The supply voltage comes from a Li-Ion LP502030 battery with a capacity of 250 mAh. Charging takes place via the mini-USB connector and the circuit implemented on the MCP73831 charge controller. Radio communication is provided by the module HC-05. To communicate with a computer or smartphone using a character protocol. The sensor is located in the OKW minitec case , complete with which can come with a wrist strap.

The sensor has the following characteristics:
- pulse wave measurement;
- sampling frequency 200 Hz;
- 250 mAh battery, charge from USB;
- at least five hours of continuous work;
- dimensions 50 x 45 x 16 mm;
- weight 20 g
Android program, data processing
To display the pulse wave on the graph and save the data, an android application was developed. The routine for working with the Bluetooth module uses codes from the freely distributed program of the BlueTerm terminal. From the bluetooth adapter, the data is transmitted to the decoder class for decoding, and then to the handler class to form an array of samples and, possibly, to perform the necessary calculations. Currently, libraries for calculating heart rate and other relevant parameters are not connected. After the handler, the data goes to the main application window, where it is displayed on a graph and saved to a file that can be opened by a third-party application. While working on the project, I came across a good LabChart program that works with several file formats, including text files. There are paid and free versions of this program. Free displays data on a graph and allows for mathematical processing: smoothing, filtering and Fourier analysis. The following figure shows the window of this program with a graph of data received from the sensor. A high pass filter has been applied.

The paid version of the program has not yet come into my hands. The developer’s site describes some very interesting characteristics. The program allows you to calculate heart rate, mode, amplitude mode, build intervalograms and much more.
To be continued
In the following articles I will talk about some of the details that need to be taken into account when designing the hardware of the photoplethysmograph, data processing methods, elimination of noise and artifacts.
PS
You can familiarize yourself with the drawings and the sensor program , as well as the source code of the android application .
Added (05/20/2015)
- a file with a pulsogram record in 10 minutes was added to the repository in the info / folder;
- added the frequency response of the analog part of the sensor, its original file is also in the repository;

Source: https://habr.com/ru/post/258115/
All Articles