LeakCanary - an assistant in the search for memory leaks
Nobody likes crashes with OutOfMemoryError
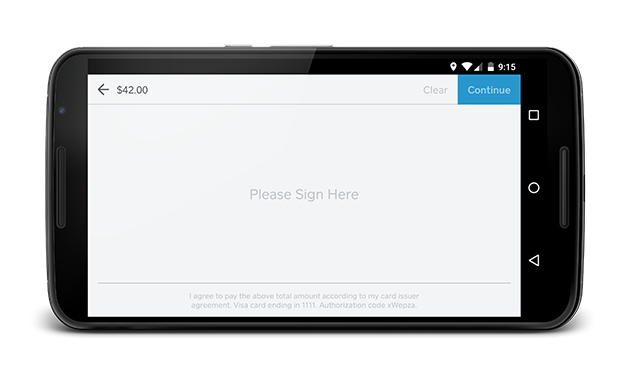
Working on Square Register, we draw a client signature using a bitmap cache. Since this bitmap is the size of a device screen, we had a lot of OutOfMemory crashes when creating it.
We tried several approaches, none of which solved the problem:
- Used Bitmap.Config.ALPHA_8
- We caught OutOfMemoryError, called garbage collection and tried again (peeped in GCUtils ),
- We did not consider the option of placing bitmaps outside the Java heap. Fortunately, Fresco did not exist yet,
')
We went the wrong way
The problem was not the size of the bitmap. When memory is almost completely used, OOM can occur anywhere. Of course, the likelihood that this will happen during the allocation of large objects, such as bitmaps, increases. OOM is only a symptom of a deeper problem: memory leaks.
What is a memory leak?
Many objects have a limited lifetime. When their lifetime ends, it is expected that they will be collected by the garbage collector. If a chain of links points to an object in memory, after the expected completion of the lifetime of the object, then this creates a memory leak. When accumulating a certain amount of leaks, the program starts running out of memory.
For example, after Activity.onDestroy was called, activations, the entire hierarchy of views, and the associated bitmaps should be available for garbage collection. If the background thread during operation holds a link to the activation, the memory occupied by it cannot be freed. Sooner or later this will result in an OutOfMemoryError overrun.
Leak hunt
A hunt for memory leaks is a manual process, well described in the Raizlabs Wrangling Dalvik series.
Here are the key steps:
- Find out about OutOfMemoryError crashes via Bugsnag , Crashlytics or the developer console
- Try to reproduce the problem. You may need to buy, borrow or steal a specific device prone to crashes (Not all leaks appear on all devices!). It is also necessary to restore the sequence of actions leading to the leakage, possibly by brute force search.
- Make a memory dump with OutOfMemoryError ( Here you can find out how).
- Examine the memory dump using MAT or YourKit and detect objects that should have been collected by the garbage collector.
- Find the shortest path exiled links from the object to the roots of the garbage collector (GC Roots).
- Find a link that should not be and fix a memory leak.
What if there was a library that could do this all, even before the OOM occurred and would allow it to focus on fixing a memory leak?
Introducing LeakCanary
LeakCanary is an open source Java library for detecting memory leaks in debug builds.
Let's take a look at the following example:
class Cat { } class Box { Cat hiddenCat; } class Docker { static Box container; } // ... Box box = new Box(); Cat schrodingerCat = new Cat(); box.hiddenCat = schrodingerCat; Docker.container = box; Then you create the RefWatcher object and provide it with the object to track:
// schrodingerCat ( ). . refWatcher.watch(schrodingerCat); After the leak has been detected, you get a good leak trace.
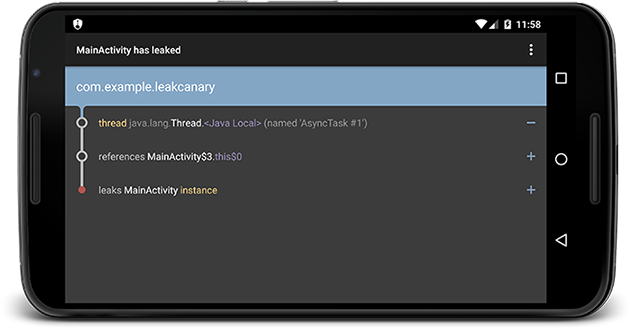
* GC ROOT static Docker.container * references Box.hiddenCat * leaks Cat instance Since we know that you are constantly involved in new features, we have made installation very simple. With just one line of code, LeakCanary will automatically detect leaks of activation:
public class ExampleApplication extends Application { @Override public void onCreate() { super.onCreate(); LeakCanary.install(this); } } You receive a notice in a good form:
Conclusion
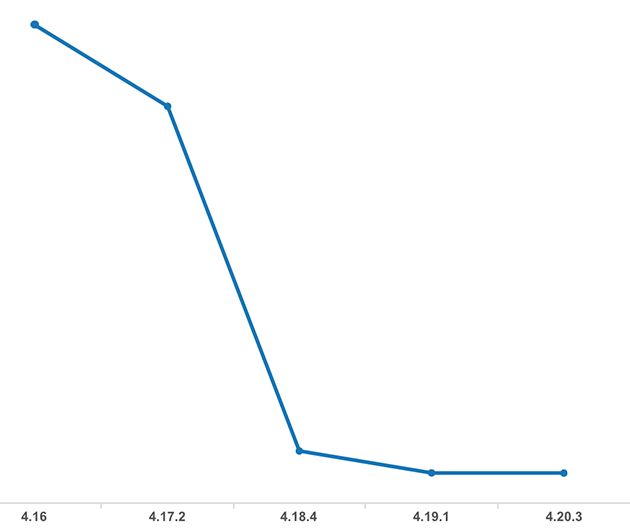
After starting to use LeakCanary, we found and fixed many leaks in our application. We even found a few leaks in the Android SDK .
The results are amazing: 94% less OutOfMemoryError kreshy!
If you want to get rid of OOM kreshy, install LeakCanary now !
Source: https://habr.com/ru/post/257633/
All Articles