Demonstration of the EMC ViPR SRM IT Infrastructure Monitoring System
We bring to your attention the system EMC ViPR SRM - monitoring of the computing infrastructure of the customer, built on the equipment of various manufacturers.
This solution was demonstrated at the EMC stand at the MUK-Expo exhibition; the demonstration was “live”, not slides, using the example of a mounted stand.
Video demo.
For those who do not want to watch the video, under the cut decoding and screenshots (we apologize for the quality of the screenshots, as they are taken from the monitor video) .
')
What is this product? Just a couple of slides. Existing infrastructures grow rather quickly, a lot of virtualization appears. Very often there is a growth due to the equipment of various vendors, it is not always possible to monitor all components of [infrastructure]. Therefore, administrators of large infrastructures are faced with the tasks of managing and monitoring the infrastructure. The product that the EMC offers, in addition, allows you to monitor the heterogeneous heterogeneous infrastructures consisting of storage systems, servers, backup systems, you can also analyze the use of resources and you can draw conclusions: - How does the infrastructure grow? - where are the bottlenecks? - What you should pay attention to?
I will now show the interface itself.
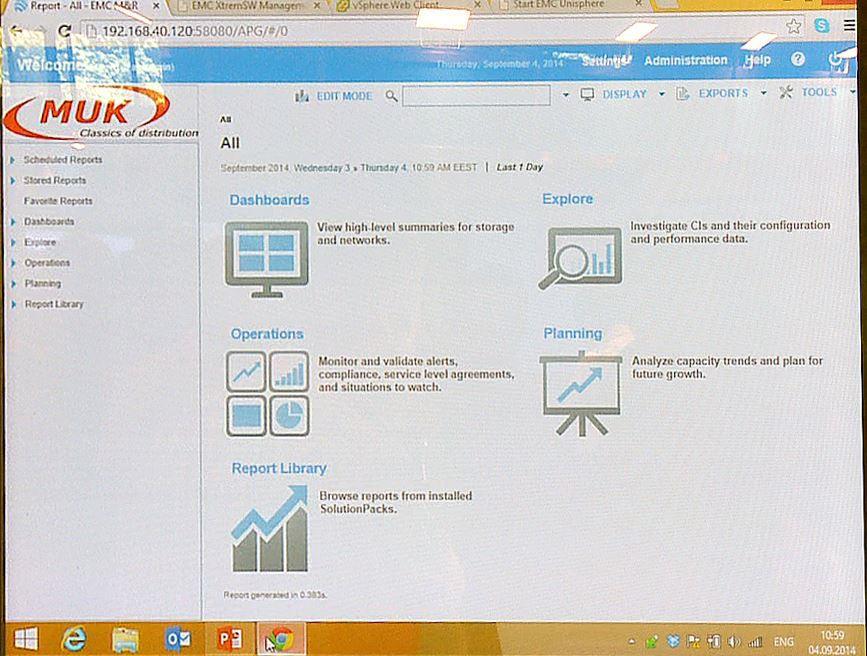
You see that there are opportunities for customization of the interface - the MUK logo has been added. The interface is divided into several sections. The Dashboard section allows you to get information collected from various sources on the state of the infrastructure and storage system. The Explore section allows us to obtain, by object, for each device, the extended information inherent to this component. The Operation section allows us to collect status information, warnings about errors in infrastructure devices that are added to the control system interface. The planning section is designed to analyze various indicators and identify trends in infrastructure in various aspects. PortLibrary - specialized reports that have been prepared by the EMC company to obtain information on a specific type of equipment.
Let's go through all the interfaces [more]. The current presentation, as the equipment presented at our booth, is not so much [as is usually the case in infrastructure]. We now have: - EMC VNX storage system, Data Domain backup storage system, - a pair of virtualization servers. We did not add a switch to the management infrastructure, so it is not visible here.
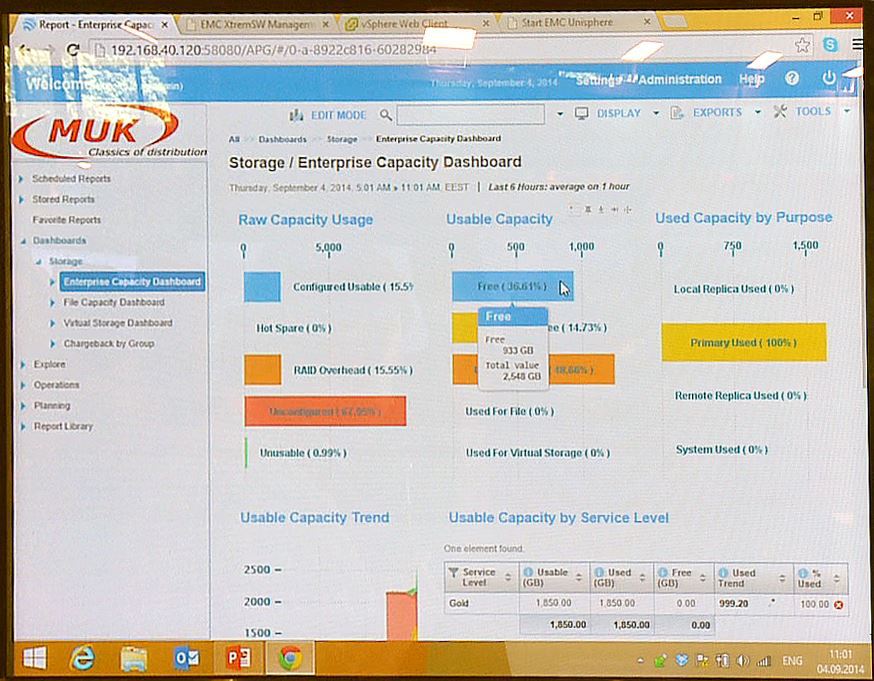
To begin with, we connected the VNX system and we can get the following information from it. Everything is summarized in visual graphs, which can be a report for the supervisor if necessary. We see: - how much raw space we have, - how much usable space we have, - how much is free, - and how much is actually used.
Then there is a graph that allows you to see the trends in the use of our storage resources. We do not have many resources now, but we can describe our components according to certain parameters: to allocate them into groups of resources with certain characteristics, we can divide [visually] these resources in order to understand how they are used. For each section, we can get the relevant information by simply clicking on them.
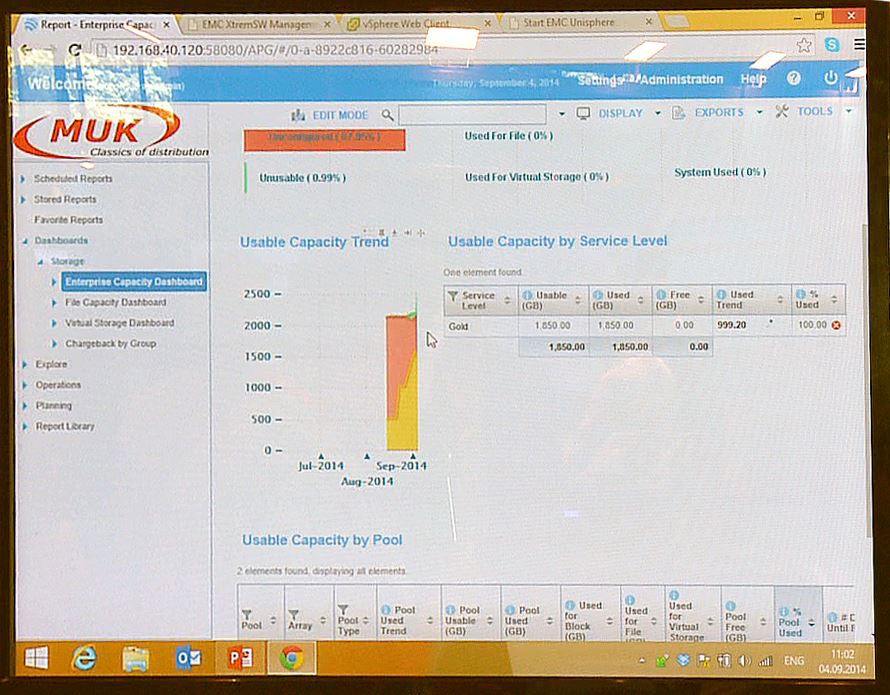
Graphs can also be customized, we can remove some of the parameters. For example - usable capacity, display only what we need. Well, and so on.
Let me go back to the dashboard again. For example, for two resources that we have in our storage system, we see: - what kind of resource is this, - what are the tendencies for its use, - and the forecast about when we will exhaust our space, according to our management system: in 5 days we fill the space and will continue to grow.
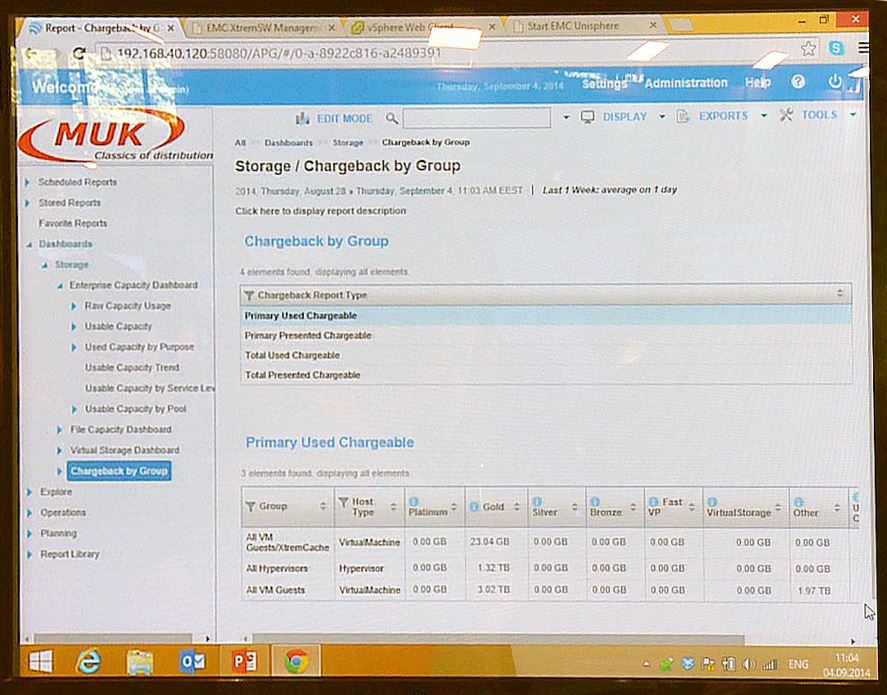
There is also an opportunity, if we have a number of consumers that are in our infrastructure, [we can see how they] use resources. We can provide payment, or billing for the use of resources, for these units. We can describe in our management system the corresponding components that are used by one or another department. And then determine how resources are utilized and how much it all can cost.
Then go to the section Explore. For example, our infrastructure has the following number of components.
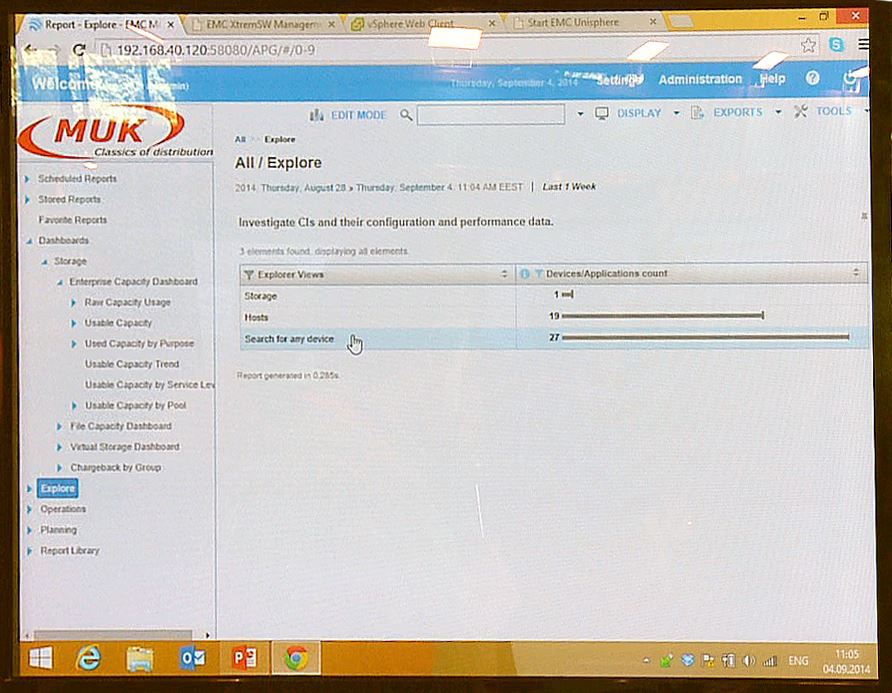
There is one repository, a number of hosts, and the total value of all components in our infrastructure.
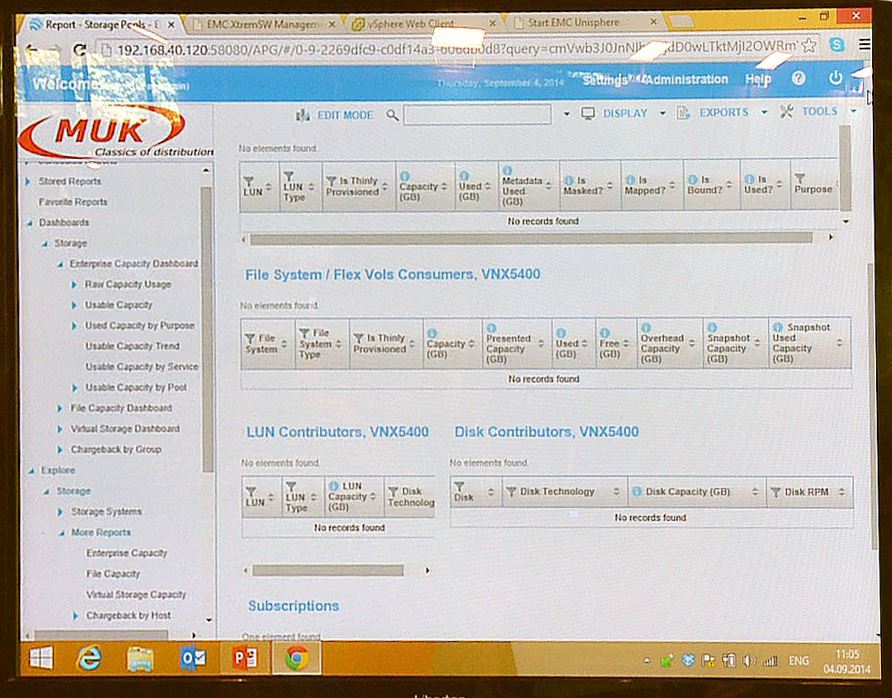
For example, we can get information on inventory by clicking on the appropriate item, and go to the page with information on this device.

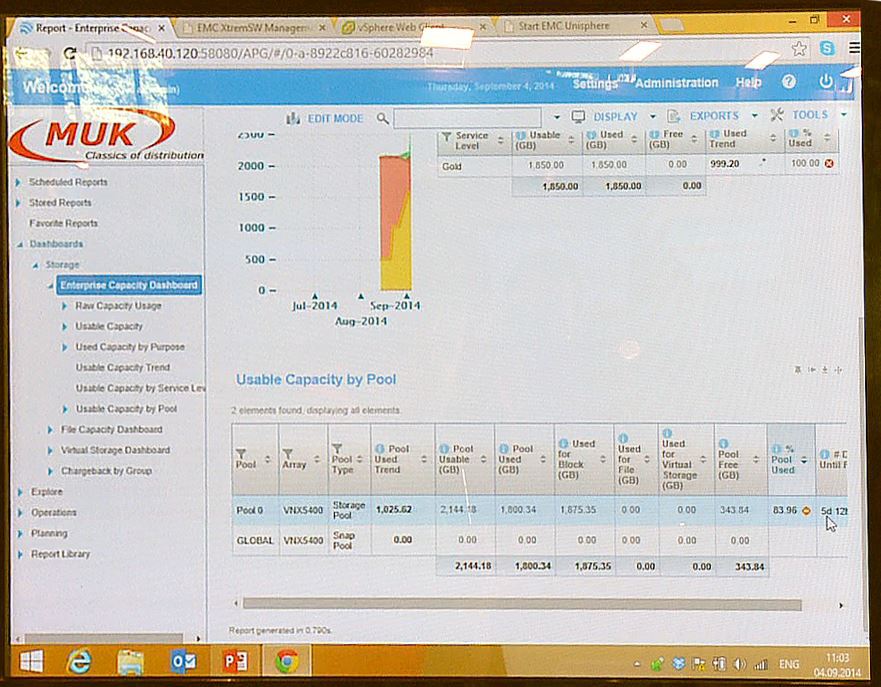
We see that this is a block type device, model 5400, corresponding to the firmware. The amount of raw space we can get by configuring all the resources. And depending on what properties the device possesses, VNX systems are unified systems, they can work both with block data and with file data, we have the corresponding sections. We looked at the storage pool with a configured storage system.
The moment to which I would like to pay attention. The system is designed in such a way that by clicking the corresponding items, we move from the section to the section responsible for a specific device for each of the reports.
Section Operation. Since our infrastructure [at this stand] is very small, we will not see [much information]. No error notifications, messages.
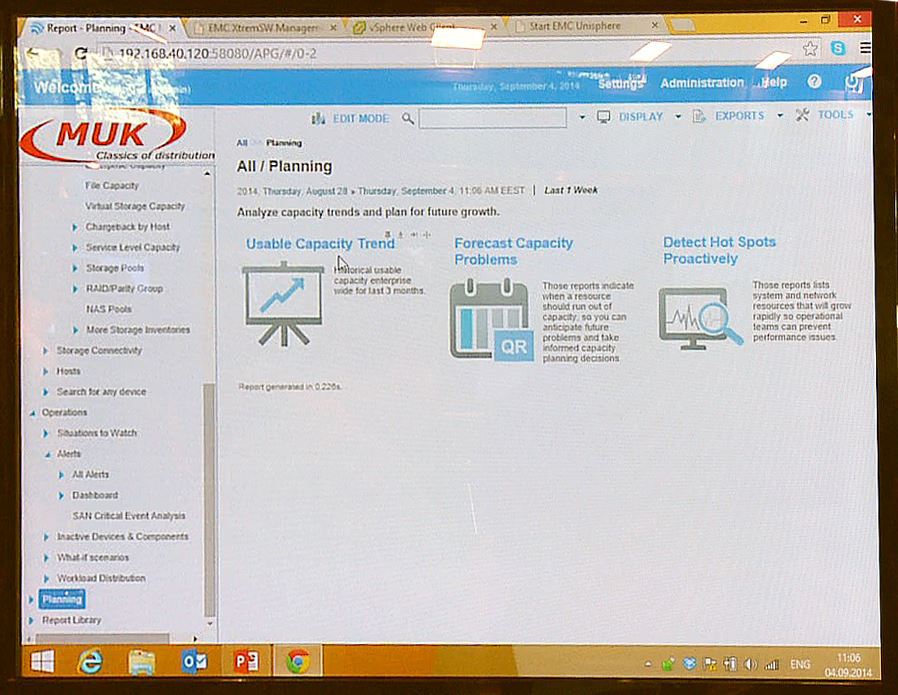
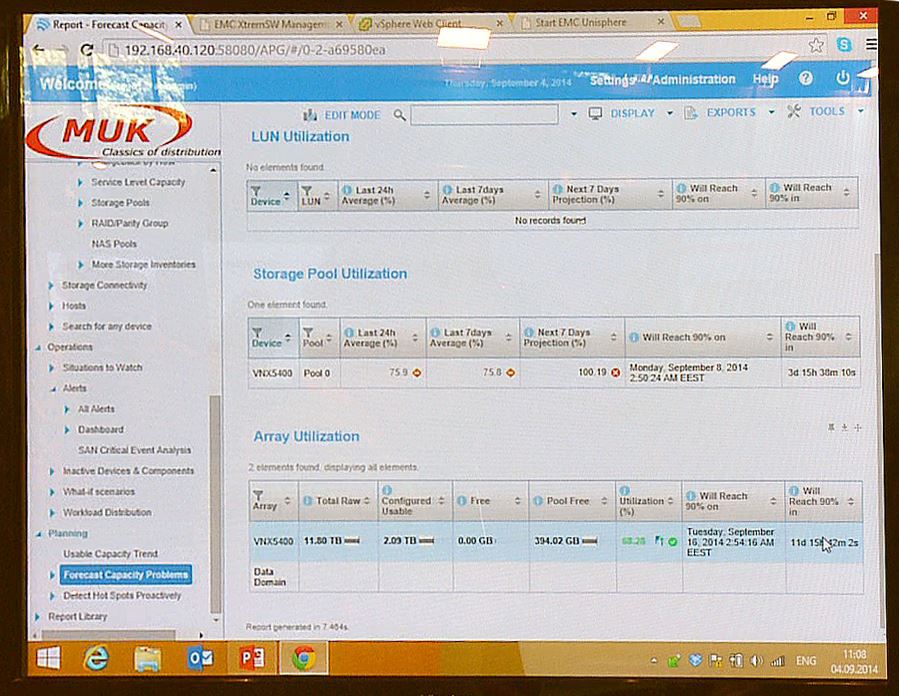
Section Planning. Responsible for obtaining information about current trends in our infrastructure regarding, say, storage capacity.
The graph contains information on all parameters: - free space, free space in the pool, - how much is used from it for block access resources, - for file access, etc. Here is information on forecasting

Here we have the second Data Domain backup system, which shows those who [use resources].
Let's return to 5400. The digit of the total space available in the storage system - 11 TBt, configured - 2.9. Based on the observations of the observation system, we will reach 100% filling within 11 days, if we use the storage system as we use now.
The next section is the Report Library. In the ViPR SRM system there are a large number of ready reports that we can use. Some of them I will now demonstrate. Here are ready-made reports and modules for monitoring the infrastructure.
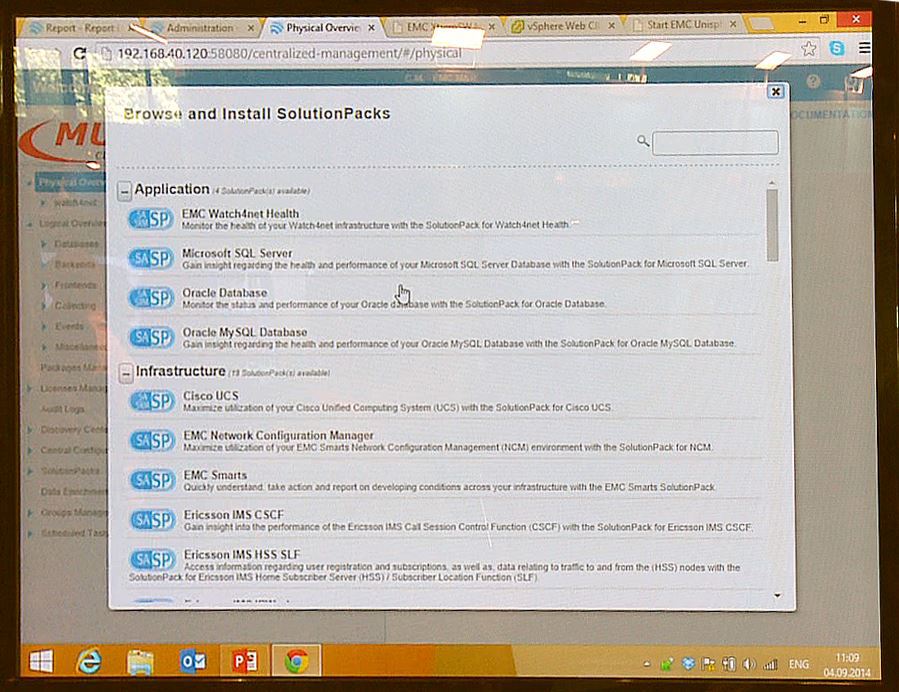
We see that we can monitor Microsoft's SQL servers, Oracle servers, MySQL DB, Cisco UCS infrastructure solutions, that is, we can connect through the server management interface, or to the UCS manager, and receive lots of information about the status of Cisco infrastructure servers. UCS. [Patterns] Ericson, physically hosts - via SNMP we can receive information and consolidate in our management console; UPS, IBM Ris technology, [various] virtualization systems: - Microsoft Hyper-V, VMware vCenter, and lots of others. [There are templates] of various storage devices from both the EMC and third-party vendors: - Hitachi, HP EVA, NetApp, etc. These are various modules that you can purchase, they are licensed by functionality, [with the help of which] you can observe behind the infrastructure.
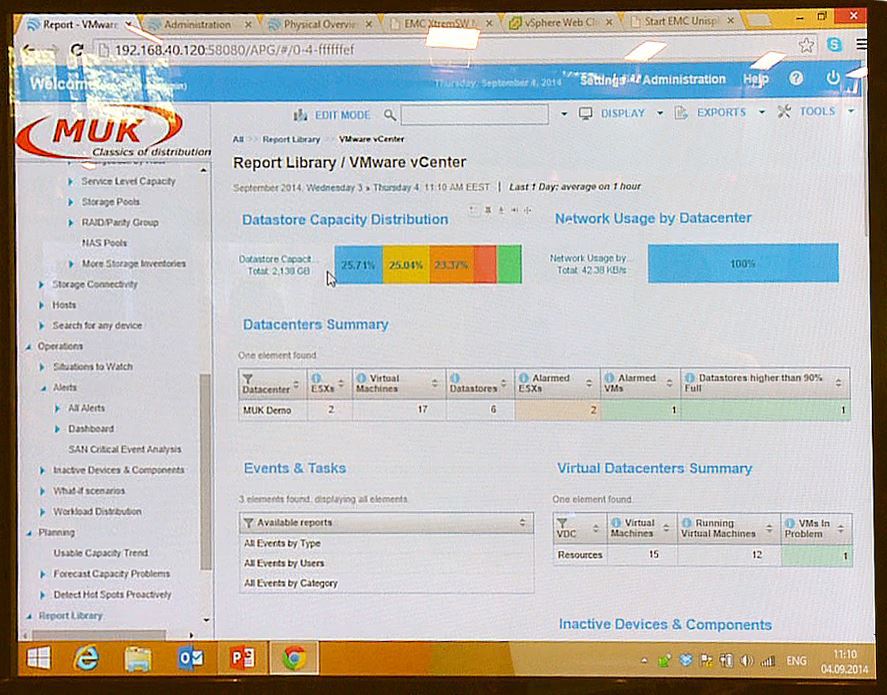
Let's go back to the reports. I would like to pay attention to monitoring the virtualization infrastructure. We have a summary of the use of resources, we can see our events, our virtual machines, what operating systems they are under.
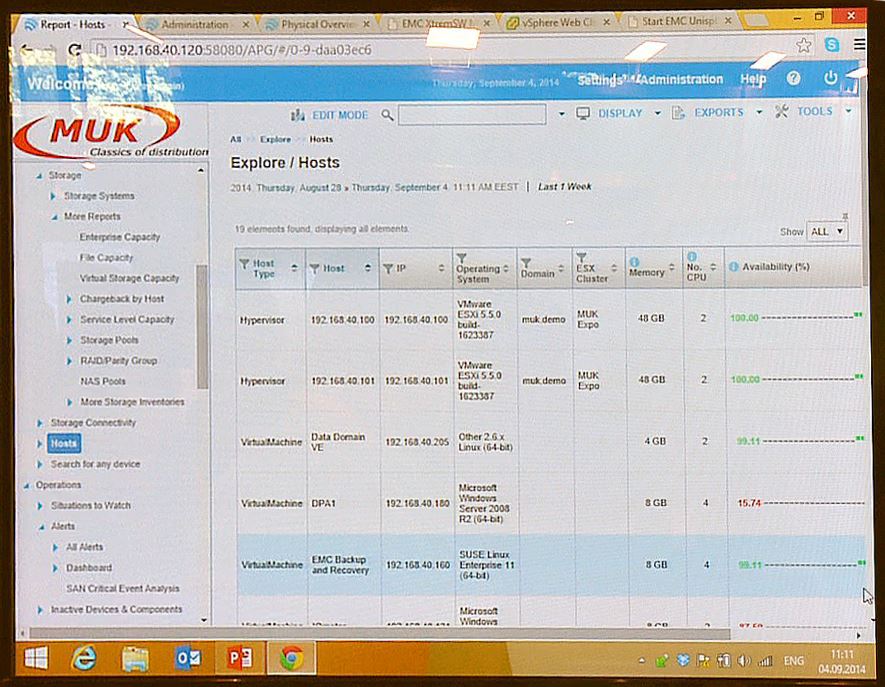
Here are our hypervisor hosts. We see the availability of this resource in the time interval from the beginning of the observation. A number of cars are available at 100%.
It is possible to download and use this utility for 30 days for free. Actually, we use this trial license and use - all the functionality is available. Then after the trial period expires, you can purchase the licenses you need, only the ones you need to monitor the relevant infrastructure.
The installation is extremely simple, there are, as I said, ready templates that we can use. If there is no what we need, we can use SNMP to collect information from devices, and customize for our own needs as we please. At the same time, there is a set of possibilities for generating reports: - according to a schedule, - sending by mail, - exporting data in various formats. Suppose we are interested in this report, we make a PDF out of it, and we schedule it by e-mail as, for example, confirming the need to purchase new equipment, or make any changes to this infrastructure.
There are various representations: Exel, all kinds of pictures. The system allows us to export any report manually, or on the basis of a schedule. Actually, everything I wanted to tell you [as part of this short demonstration].
Distribution of EMC solutions in Ukraine and Tajikistan.
MUK-Service - all types of IT repair: warranty, non-warranty repair, sale of spare parts, contract service
This solution was demonstrated at the EMC stand at the MUK-Expo exhibition; the demonstration was “live”, not slides, using the example of a mounted stand.
Video demo.
For those who do not want to watch the video, under the cut decoding and screenshots (we apologize for the quality of the screenshots, as they are taken from the monitor video) .
')
What is this product? Just a couple of slides. Existing infrastructures grow rather quickly, a lot of virtualization appears. Very often there is a growth due to the equipment of various vendors, it is not always possible to monitor all components of [infrastructure]. Therefore, administrators of large infrastructures are faced with the tasks of managing and monitoring the infrastructure. The product that the EMC offers, in addition, allows you to monitor the heterogeneous heterogeneous infrastructures consisting of storage systems, servers, backup systems, you can also analyze the use of resources and you can draw conclusions: - How does the infrastructure grow? - where are the bottlenecks? - What you should pay attention to?
I will now show the interface itself.
You see that there are opportunities for customization of the interface - the MUK logo has been added. The interface is divided into several sections. The Dashboard section allows you to get information collected from various sources on the state of the infrastructure and storage system. The Explore section allows us to obtain, by object, for each device, the extended information inherent to this component. The Operation section allows us to collect status information, warnings about errors in infrastructure devices that are added to the control system interface. The planning section is designed to analyze various indicators and identify trends in infrastructure in various aspects. PortLibrary - specialized reports that have been prepared by the EMC company to obtain information on a specific type of equipment.
Let's go through all the interfaces [more]. The current presentation, as the equipment presented at our booth, is not so much [as is usually the case in infrastructure]. We now have: - EMC VNX storage system, Data Domain backup storage system, - a pair of virtualization servers. We did not add a switch to the management infrastructure, so it is not visible here.
To begin with, we connected the VNX system and we can get the following information from it. Everything is summarized in visual graphs, which can be a report for the supervisor if necessary. We see: - how much raw space we have, - how much usable space we have, - how much is free, - and how much is actually used.
Then there is a graph that allows you to see the trends in the use of our storage resources. We do not have many resources now, but we can describe our components according to certain parameters: to allocate them into groups of resources with certain characteristics, we can divide [visually] these resources in order to understand how they are used. For each section, we can get the relevant information by simply clicking on them.
Graphs can also be customized, we can remove some of the parameters. For example - usable capacity, display only what we need. Well, and so on.
Let me go back to the dashboard again. For example, for two resources that we have in our storage system, we see: - what kind of resource is this, - what are the tendencies for its use, - and the forecast about when we will exhaust our space, according to our management system: in 5 days we fill the space and will continue to grow.
There is also an opportunity, if we have a number of consumers that are in our infrastructure, [we can see how they] use resources. We can provide payment, or billing for the use of resources, for these units. We can describe in our management system the corresponding components that are used by one or another department. And then determine how resources are utilized and how much it all can cost.
Then go to the section Explore. For example, our infrastructure has the following number of components.
There is one repository, a number of hosts, and the total value of all components in our infrastructure.
For example, we can get information on inventory by clicking on the appropriate item, and go to the page with information on this device.
We see that this is a block type device, model 5400, corresponding to the firmware. The amount of raw space we can get by configuring all the resources. And depending on what properties the device possesses, VNX systems are unified systems, they can work both with block data and with file data, we have the corresponding sections. We looked at the storage pool with a configured storage system.
The moment to which I would like to pay attention. The system is designed in such a way that by clicking the corresponding items, we move from the section to the section responsible for a specific device for each of the reports.
Section Operation. Since our infrastructure [at this stand] is very small, we will not see [much information]. No error notifications, messages.
Section Planning. Responsible for obtaining information about current trends in our infrastructure regarding, say, storage capacity.
The graph contains information on all parameters: - free space, free space in the pool, - how much is used from it for block access resources, - for file access, etc. Here is information on forecasting
Here we have the second Data Domain backup system, which shows those who [use resources].
Let's return to 5400. The digit of the total space available in the storage system - 11 TBt, configured - 2.9. Based on the observations of the observation system, we will reach 100% filling within 11 days, if we use the storage system as we use now.
The next section is the Report Library. In the ViPR SRM system there are a large number of ready reports that we can use. Some of them I will now demonstrate. Here are ready-made reports and modules for monitoring the infrastructure.
We see that we can monitor Microsoft's SQL servers, Oracle servers, MySQL DB, Cisco UCS infrastructure solutions, that is, we can connect through the server management interface, or to the UCS manager, and receive lots of information about the status of Cisco infrastructure servers. UCS. [Patterns] Ericson, physically hosts - via SNMP we can receive information and consolidate in our management console; UPS, IBM Ris technology, [various] virtualization systems: - Microsoft Hyper-V, VMware vCenter, and lots of others. [There are templates] of various storage devices from both the EMC and third-party vendors: - Hitachi, HP EVA, NetApp, etc. These are various modules that you can purchase, they are licensed by functionality, [with the help of which] you can observe behind the infrastructure.
Let's go back to the reports. I would like to pay attention to monitoring the virtualization infrastructure. We have a summary of the use of resources, we can see our events, our virtual machines, what operating systems they are under.
Here are our hypervisor hosts. We see the availability of this resource in the time interval from the beginning of the observation. A number of cars are available at 100%.
It is possible to download and use this utility for 30 days for free. Actually, we use this trial license and use - all the functionality is available. Then after the trial period expires, you can purchase the licenses you need, only the ones you need to monitor the relevant infrastructure.
The installation is extremely simple, there are, as I said, ready templates that we can use. If there is no what we need, we can use SNMP to collect information from devices, and customize for our own needs as we please. At the same time, there is a set of possibilities for generating reports: - according to a schedule, - sending by mail, - exporting data in various formats. Suppose we are interested in this report, we make a PDF out of it, and we schedule it by e-mail as, for example, confirming the need to purchase new equipment, or make any changes to this infrastructure.
There are various representations: Exel, all kinds of pictures. The system allows us to export any report manually, or on the basis of a schedule. Actually, everything I wanted to tell you [as part of this short demonstration].
Distribution of EMC solutions in Ukraine and Tajikistan.
MUK-Service - all types of IT repair: warranty, non-warranty repair, sale of spare parts, contract service
Source: https://habr.com/ru/post/257543/
All Articles