Power profiling of microcontrollers (EFM32, SiLabs series)
Prehistory
 Two years ago, Silicon Labs swallowed another smaller company - this time the Norwegian manufacturer of low-power ARM controllers EnergyMicro. Since then SiLabs actively develops and promotes EFM32 series microcontrollers with a funny lizard on the body.
To business
If you had to read reviews on modern microcontrollers, then you will agree - among other things, there will be surely said about record high performance and about record low power consumption. It seems that this is just a rule of good taste in the club of the producers of MK, but it happens that the marketing phrases have a common meaning.
According to the documentation, the power consumption of the EFM32 is really low, you can check it in practice using the utility for profiling the power consumption of microcontrollers from Silicon Labs.
')

Under the review review utility and practical tips for its use.
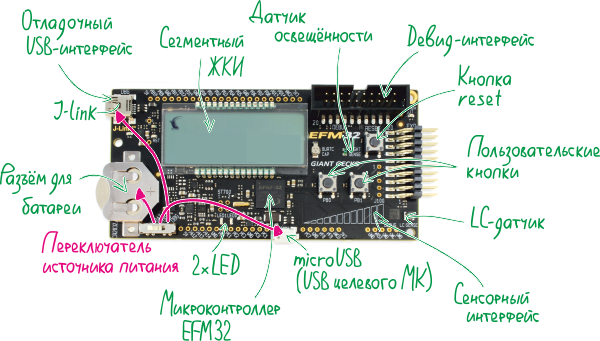
Hardware : debug board EFM32WG-STK3800.
EFM32 microcontrollers are based on ARM Cortex-M0 +, Cortex-M3 and Cortex-M4 cores and differ in the set of peripherals and the amount of internal memory. Each series of microcontrollers has a separate debugging board, but all the boards are very similar and are priced at 42 USD. I have a kit for EFM32 Wonder Gecko controllers.
Software : a platform for developing and debugging the Simplicity Studio project.
This is something like an aggregator of development tools for Silicon Labs microcontrollers (by the way, not only EFM32, but also good old C8051Fxxx, Zigbee modules, etc.). Here is the IDE (gnu ARM eclipse), documentation, and a dozen different auxiliary utilities, including the desired Energy Profiler. The full-fledged distribution of Simplicity Studio (Windows, MAC, Ubuntu) can be downloaded for free at silabs.com .
Main menu Simplicity Studio immediately after installation:
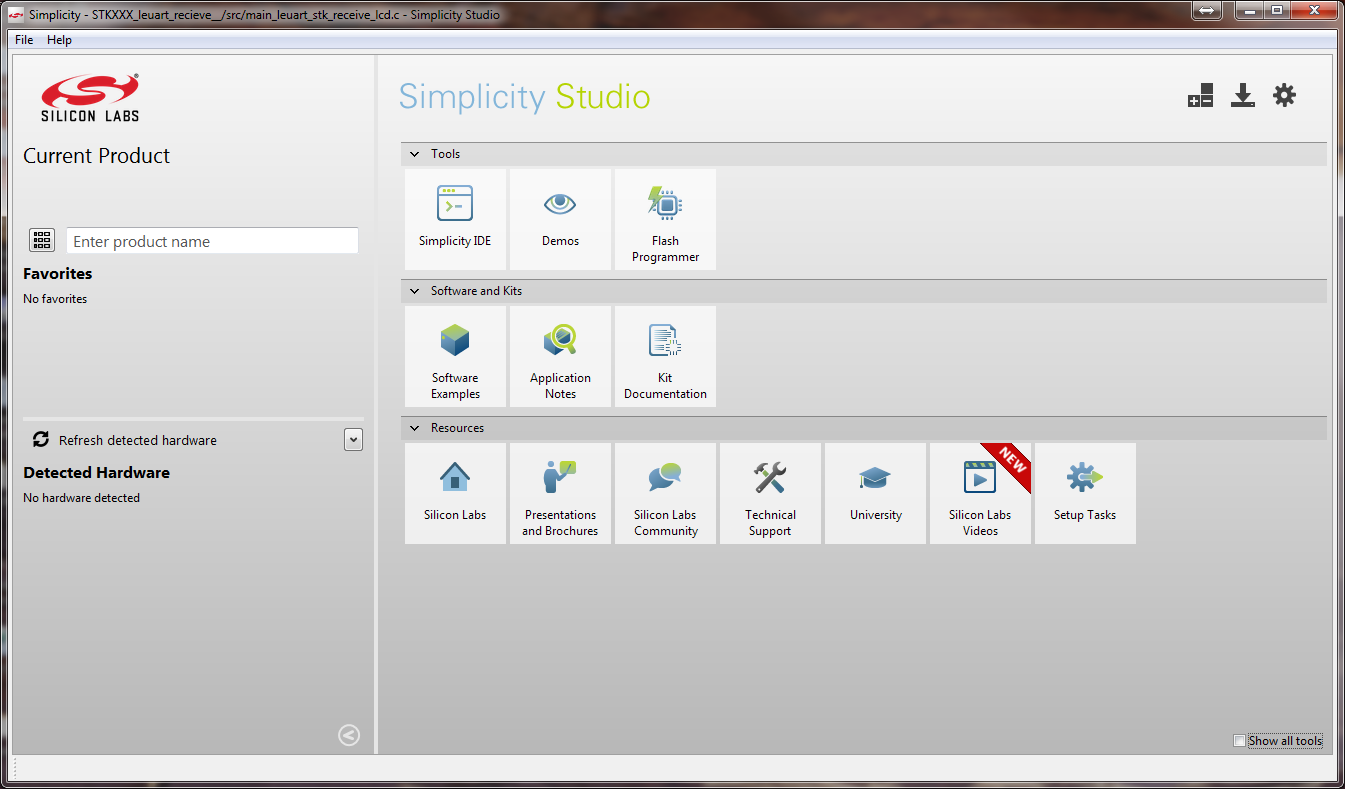
Relatively few tools are available before connecting the debugging board, but you can already look around a bit: on the left, a parametric search is available for microcontrollers (only SiLabs, of course), there are three icons in the upper right corner that are used to configure the components included in Simplicity Studio. In general, the program itself monitors the release of new utilities and updates of its components, but the configuration can be done manually.
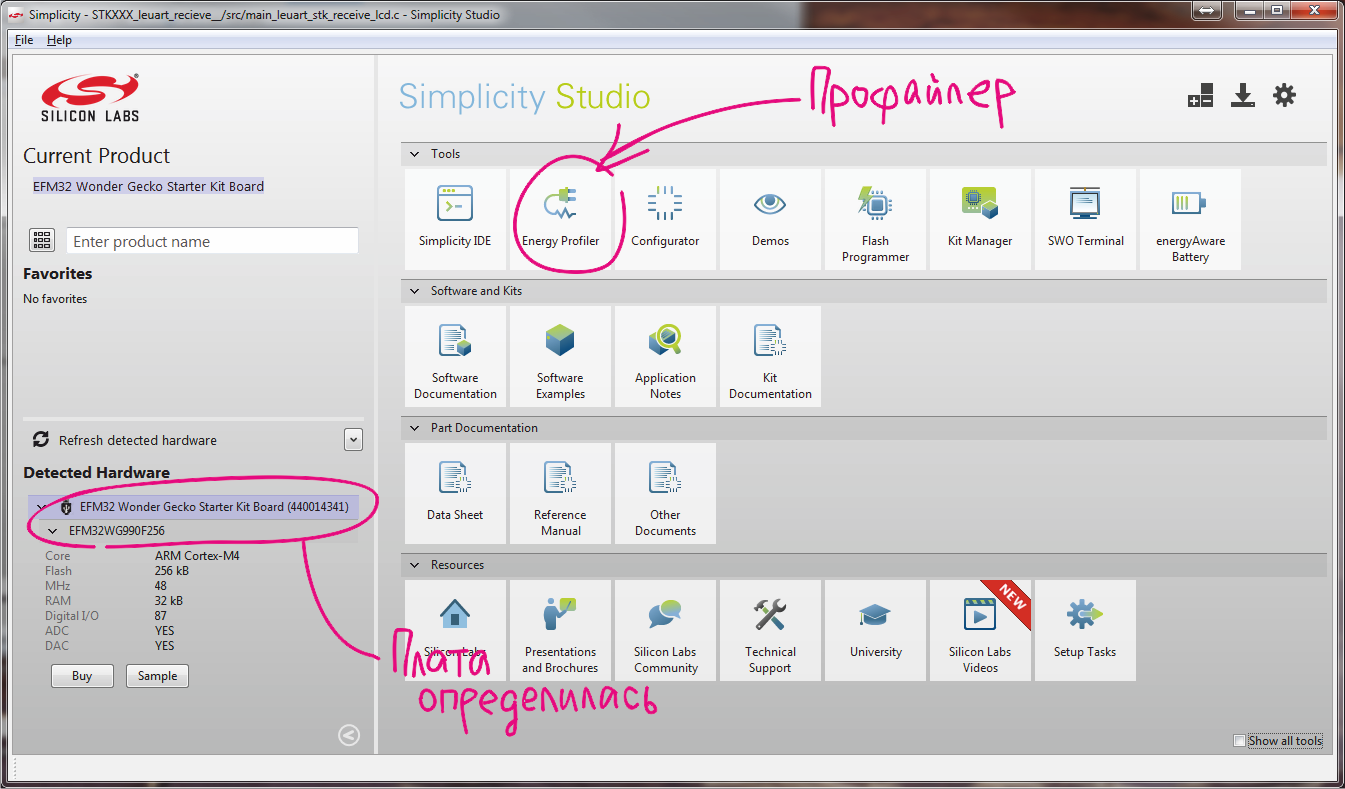
To start working with the board, it is enough to connect it to the computer via USB and select the debug USB board as the power source (battery power is also available from the target microcontroller's USB).
After connecting, the board is detected by the computer and all components intended for the corresponding series of controllers (EFM32WGxxx) become available.
Getting started is the easiest way to start with a demo, since there are a lot of them in Simplicity Studio.
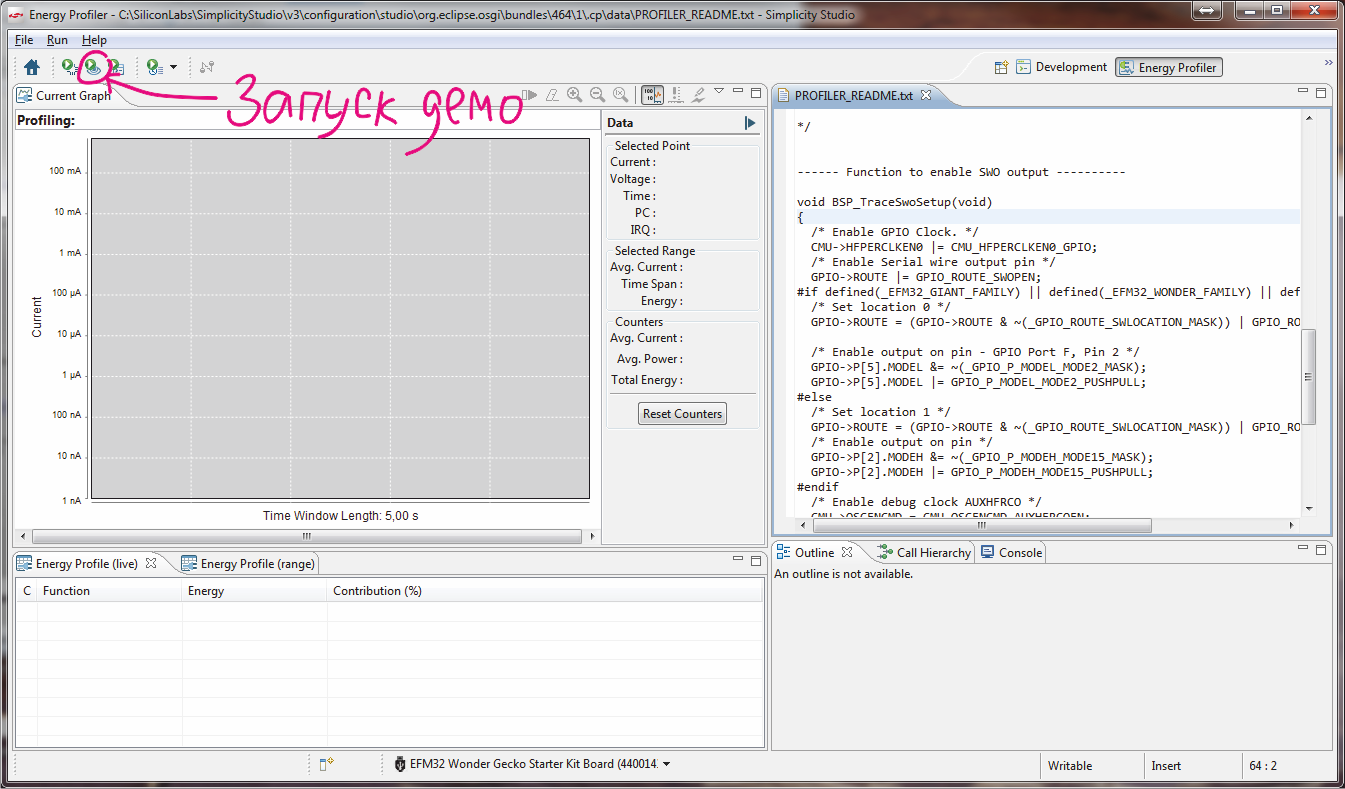
I choose one of the examples for the EFM32WG-STK3800 - a simple program for working with the LCD-display - and run it with the default settings.

Simultaneously with the launch of the program on the microcontroller, the measurement of the energy consumption of the crystal begins. In real time, a graph of energy consumption versus time is plotted; this is perhaps the most visual part of the profiler.
First, the graph shows the dynamics of changes in consumption in the course of execution of the program. Secondly, for the point selected on the chart and for the chosen time interval, exact and average values of the measured indicators are available.
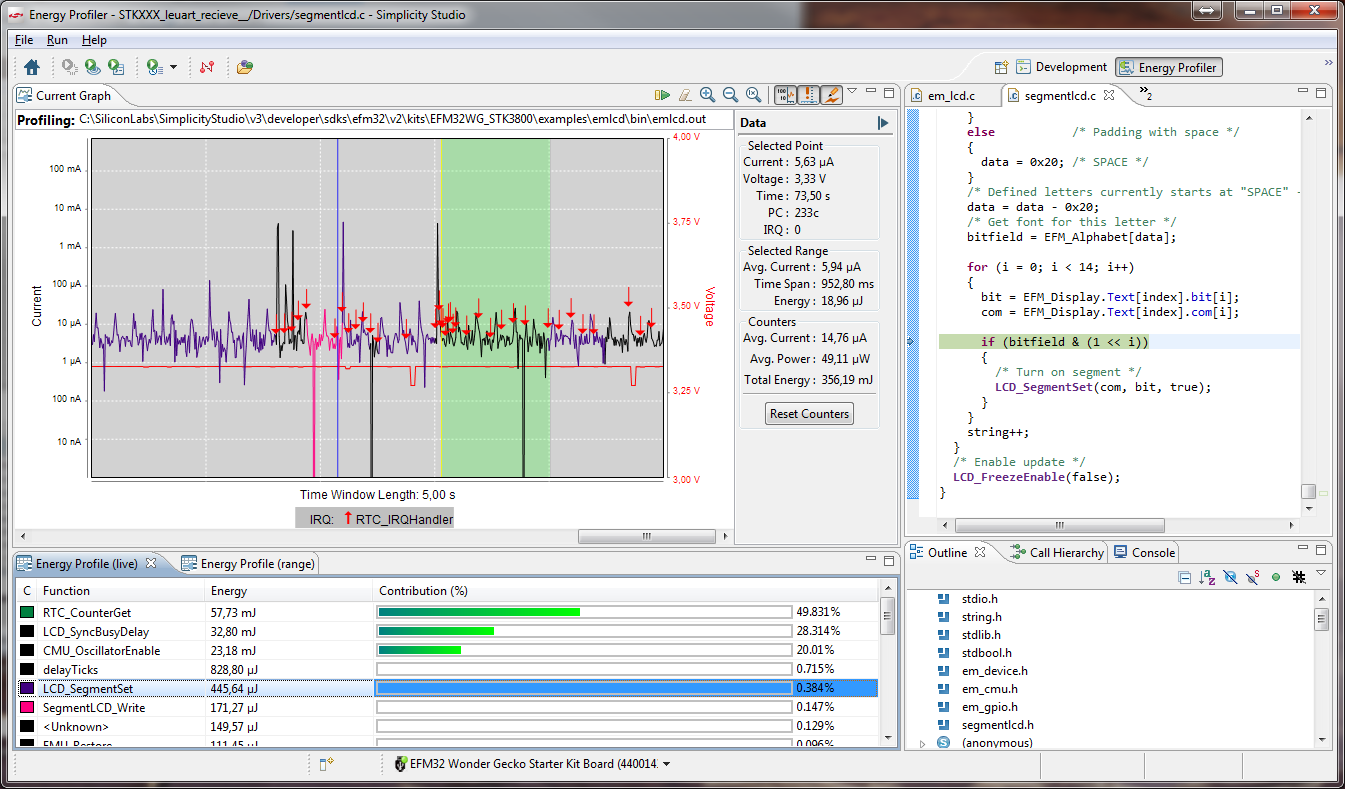
* The screenshot captures the moment when all available profiler functions are enabled. When you first start the picture does not look so bright
Plotting can be stopped and resumed, the plot has the function of scaling on a time scale, and a linear and logarithmic scale can be set along the vertical axis. The logarithmic scale is a convenient tool for small currents, but the ability to simply scale the graph vertically is sometimes not enough.
Several other useful functions are also available: displaying graphs of inputs to interrupt handlers (multi-colored vertical arrows) and supply voltage levels, exporting measurement results to excel, etc.
But the most delicious thing is the correlation of graphics with executable code. If the processor core supports tracing (Cortex-M3 and M4 are suitable), then any point on the Energy Profiler chart will match the line of code — by clicking on the chart, the line in the listing on the right will be highlighted. To determine too “gluttonous” functions and procedures, also serves the statistics of the work of individual functions of the program - under the graph you can see the distribution of energy consumed between them. Each function can be assigned a specific color, then it will be clear on the graph where it begins and ends.
All this beauty, if briefly, is implemented as follows :
The measuring module is built into the microcontroller power supply circuit on the debug board. Through it, the current and voltage values are sent to the computer, as well as the value from the timer built into the measuring module. Together with the value of the command counter (SWO line), the data is processed and interpreted by the profiler.
The current, voltage and time from the beginning of the measurements allow you to build a graph of energy consumption versus time, and the value of the command counter allows you to correlate each point with the line number and the name of the source code file.
Energy Profiler uses an .axf object file with debugging data in DWARF (Debug With Arbitrary Record Format) format, which is created when the project is compiled in debug mode and the libelf and libdwarf libraries to determine the desired line in the code.

About profiling your own project
Above was considered a demo example built into Simplicity Studio. When using the Energy Profiler pitfalls too little.
So, to profile your own project, you need to do the following in the Simplicity IDE window:
- Add the tracing function SWOTraceSetup () to the project and call it when the controller is initialized.
- After compiling create a new profiler configuration:
- Run-> ProfilingConfigurations menu ...
- click on Simplicity Energy Profiler for ARM -> New
- specify the * .afx file in the Executable field
- check the Enable Code Correlation checkbox on the Profiler tab
SWOTraceSetup ()
the function can be found in any example from the manufacturer, in the help, and many more where, but here I will add it too
void BSP_TraceSwoSetup(void) { /* Enable GPIO Clock. */ CMU->HFPERCLKEN0 |= CMU_HFPERCLKEN0_GPIO; /* Enable Serial wire output pin */ GPIO->ROUTE |= GPIO_ROUTE_SWOPEN; #if defined(_EFM32_GIANT_FAMILY) || defined(_EFM32_WONDER_FAMILY) || defined(_EFM32_LEOPARD_FAMILY) /* Set location 0 */ GPIO->ROUTE = (GPIO->ROUTE & ~(_GPIO_ROUTE_SWLOCATION_MASK)) | GPIO_ROUTE_SWLOCATION_LOC0; /* Enable output on pin - GPIO Port F, Pin 2 */ GPIO->P[5].MODEL &= ~(_GPIO_P_MODEL_MODE2_MASK); GPIO->P[5].MODEL |= GPIO_P_MODEL_MODE2_PUSHPULL; #else /* Set location 1 */ GPIO->ROUTE = (GPIO->ROUTE & ~(_GPIO_ROUTE_SWLOCATION_MASK)) | GPIO_ROUTE_SWLOCATION_LOC1; /* Enable output on pin */ GPIO->P[2].MODEH &= ~(_GPIO_P_MODEH_MODE15_MASK); GPIO->P[2].MODEH |= GPIO_P_MODEH_MODE15_PUSHPULL; #endif /* Enable debug clock AUXHFRCO */ CMU->OSCENCMD = CMU_OSCENCMD_AUXHFRCOEN; while(!(CMU->STATUS & CMU_STATUS_AUXHFRCORDY)); /* Enable trace in core debug */ CoreDebug->DHCSR |= 1; CoreDebug->DEMCR |= CoreDebug_DEMCR_TRCENA_Msk; /* Enable PC and IRQ sampling output */ DWT->CTRL = 0x400113FF; /* Set TPIU prescaler to 16. */ TPI->ACPR = 0xf; /* Set protocol to NRZ */ TPI->SPPR = 2; /* Disable continuous formatting */ TPI->FFCR = 0x100; /* Unlock ITM and output data */ ITM->LAR = 0xC5ACCE55; ITM->TCR = 0x10009; } After that, you can start profiling (with preliminary assembly and compilation of the project and firmware of the microcontroller) with one click.

Since the utility uses absolute paths to the source code files, it is better to compile the project before each profiling, out of harm's way.
Speaking about setting up tracing, you need to remember that it uses the auxiliary RC-generator AUXHFRCO. In theory, it is configured and started when performing the trace setup function, however, if it is assumed that the microcontroller often uses “deep sleep” modes, in which this auxiliary generator turns off, there are different glitches. If EM2 and lower modes of operation are used, it makes sense to manually adjust the AUXHFRCO power:
EMU -> CTRL |= _EMU_CTRL_EMVREG_FULL; The auxiliary generator, providing the transfer of the value of the command counter via the SWO line, increases the power consumption by ~ 400 µA and noises the measuring channel a little. If the program optimization is finished and you want to get accurate measurement results, you should disable measurement correlation with executable code (read the kernel trace), i.e. remove the SWOTraceSetup () function call.
Profiling can also be carried out for the original target board, in which case the SiLabs branded board will serve as a measurement module between the target board and the computer. For this you will need:
- Power the target board from the VMCU line on the Starter Kit board and connect the SWO pins of the target microcontroller to the proprietary board.
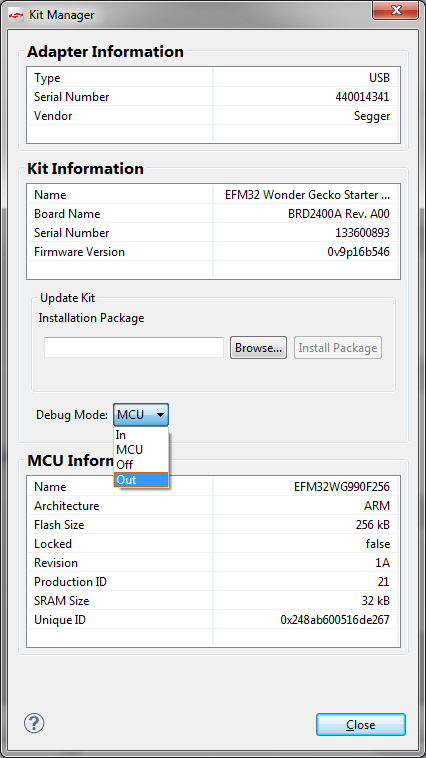
- Change the operation mode of the board - from the debug mode of the microcontroller on board to work in the external debugger mode. Setup is carried out in another utility that is part of Simplicity Studio - Kit Manager.Kit manager
Source: https://habr.com/ru/post/257503/
All Articles