Solar eclipses: from past to future, from Earth to Jupiter (research conducted using the Wolfram Language)
Download the article as a CDF file .
I express my deep gratitude to Kirill Guzenko for his help in translating.
You may have heard that March 20 was a solar eclipse. Whether a solar eclipse is visible or not depends on where you are on the planet. If a solar eclipse is visible, it will always be possible to find out from the media, which usually create some sensation around this event - the weather conditions at the time of the eclipse, other details are reported. If a solar eclipse is not visible in the place where you are, most likely you will not even know about it. However, often people from the Wolfram Community from all parts of the world, both experienced and novice developers, take part in the discussion of such things. And it is very cool to observe how knowledge of the subject and technologies of Wolfram are transmitted to each other from people from all over the world.
Not so long ago, five discussions were created in the Wolfram Community, in which the last solar eclipse was discussed. Below they are presented in the order in which they appeared within the community. The posts contain data on observations of a recent eclipse and their analysis, forecasts of future eclipses, and a little about how eclipses pass on other planets.
- Topographic survey of total solar eclipse March 20, 2015
- From Ukraine: photo and map of the solar eclipse March 20, 2015
- The consequence of a solar eclipse
- Movement of the 2017 total solar eclipse region through the USA
- Solar eclipses on other planets
Almost everything presented below is taken from the Wolfram Community discussions, but some interesting thoughts, code snippets and visualizations were slightly added. If you are interested in the details, you can read the original posts.
')
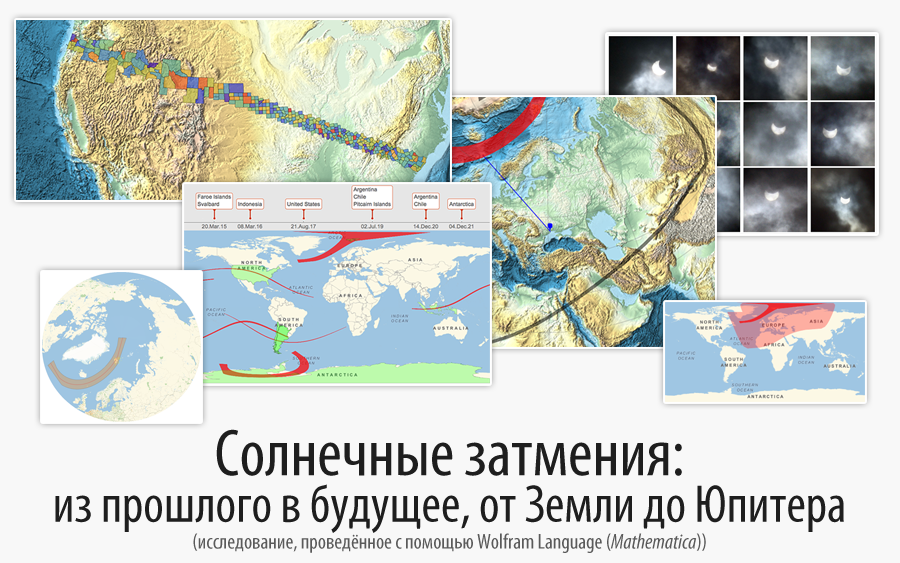
First, before a solar eclipse happened, on March 20, 2015, Wolfram staff members Jeff Bryant and Francisco Rodríguez told where, how and in what completeness a solar eclipse can be seen. Using GeoEntities , Francisco highlighted green countries in which a solar eclipse will be at least partially visible.


Jeff Bryant is from the USA , and Francisco Rodriguez is from Peru , so that, as you can see, none of them could see a solar eclipse in their edges. Areas highlighted in rich red - a total solar eclipse was visible in them. Lighter red is a partial eclipse. I comforted them by saying that pretty soon - in the next decade - people from almost all countries of the world, including the United States and Peru, could observe at least a partial phase of a total solar eclipse:


A very convenient way to visualize some events in chronological order is to use the new Wolfram Language - Wolfram Language function, TimelinePlot . I combined data on past years and forecasts for the future and visualized (in accordance with ISO 3166-1 ) how, when and in which countries (in which territories) a total solar eclipse will be observed:


The image above demonstrates the impressive power of computational infographics. It can be immediately noticed that a total solar eclipse will be observed practically throughout the US on August 21, 2017 (the discussion on this topic is presented below). You can also notice that people from Argentina and Chile are very lucky - they will see a total solar eclipse twice in a row. Quite uniquely, the recent solar eclipse almost completely covered two territories: the Faroe Islands and Svalbard .
That is, any person who was on this territory could observe an eclipse from anywhere within this territory. It usually happens the other way around: the area of observation of a total eclipse is much smaller than the area of the territory it covers, and most people would have to go somewhere to observe it (fortunately, no visas would be required). The behavior of the solar system is very complex. NASA has data on solar eclipses only for 1000 years ahead and back, and more distant periods of time are not available for research due to the influence of randomness of complex systems.
During a solar eclipse, I was in Odessa (Ukraine), where the eclipse was only partially observed. Here you can see my position relative to the solar eclipse zone. I managed to take some photos of him. With the use of GeoProjection, you can simply show that the total solar eclipse zone practically does not include any densely populated places and is concentrated mainly above the water surface. The black line shows the limit of visibility of a partial eclipse. In this area there are many populated areas:


The Faroe Islands were in the zone of total solar eclipse and, as can be seen above, the shortest (geodesic) path to my location is indicated. In a separate report (see further discussion below), Marco Thiel laid out a link to the impressive coverage of the total solar eclipse, which was captured on video by the BBC team from an airplane (to avoid cloudiness issues) in flight over the Faroe Islands (something about this will be said below ). Francisco commented on how to calculate the distance from Odessa to the border of a partial solar eclipse.

Of course, my photos, taking on the "toy" camera, can not be compared with the photos and videos of the BBC. Because of the weather in Ukraine, it was possible to observe only occasionally fragments of the sun appearing from behind the clouds. Many images were clouded, but the ImageAdjust feature fixed the situation by removing the veil. Unedited photos can be downloaded from my post in the Wolfram Community :


By the way, what do you think, why did I have a photo of the candy below? As it was said in my post, I noticed that some children in Ukraine, where I watched a solar eclipse, looked at it through the wrappers of chocolates. Candies are inexpensive, and the wrapper is dense enough to protect your eyes from the rays of the sun when it comes from behind the clouds. Remember the floppy? While they were diskettes, they were sometimes used to look at them through the sun. Many people can remember this.

And then the conversation was picked up by members of the community. Sander Huisman, a physicist from the University of Twente in the Netherlands, asked a wonderful question: “Wouldn’t it be great to know where the photo was taken, only from the image file itself? After all, it is possible to calculate how much the sun was hidden for each of the photos, plus the time when it was taken is stored inside each photo. If we have both data and other data, then we can find out where the photo was taken, right? ” I did not know how to make such calculations, however, Marco Thiel, an expert in applied mathematics from the University of Aberdeen in the UK (Marco Thiel, University of Aberdeen, UK) created another discussion - the consequences of a solar eclipse . Marco and Henrik Schachner , a physicist from the Radiation Therapy Center in Weilheim, Germany, tried to at least calculate the percentage of how hidden the Sun was using image processing and computational geometry. This is the first part of the problem. If you have an idea how to deal with the second part - determining your location based on the time of the photo and the percentage of how hidden the Sun is - please join the discussion in the Wolfram Community. Marco and Henrik used photographs from Aberdeen, which was very close to the zone of total eclipse.

habrastorage.org/getpro/habr/post_images/8d8/64c/d38/8d864cd38f3e090a45286adde38b7985.png
Even though he was so close, Marco had no chance of capturing the eclipse due to high clouds. How ironic and lucky that the photos he used came from an American student from Cornell University (Cornell University) - from Tanvi Chheda , who spent a semester abroad at Marco University. She took pictures on her iPad, but what wonderful images came out with birds and an eclipse! Thank you very much, Tanvi, for putting them in the Wolfram Community! Here they are:

Here it is, the restless nature of the Wolfram Community - something interesting happens all the time, and then it develops rapidly. I can convey the main essence of the message to Marco (see the original message in the community with a large number of images and details of the estimated eclipse overlap factors), but I will convey his words: “Even before the current eclipse, warnings appeared in the network that in Europe Cascade power outages occur due to a lack of solar energy in the power grid. Therefore, I decided to use Mathematica to analyze data on the impacts on the power system in the UK. I also used data from the Netatmo Meteorological Station to analyze the temperature fluctuations in Europe caused by the eclipse. ”
Marco - the owner of this weather station - wrote about it in an earlier report . He used the API to get data from various stations from all over Europe, and also got access to publicly available data on the power system. One of his interesting observations is the strong correlation between the eclipse time and the amount of energy produced by hydroelectric power plants:

More various observations, code, analytics you can find in the original . There, Marco also deals with the topic of global warming and the relevance of obtaining high-quality crowdsourced data. To visualize everything that was discussed, I imported all the text and used the new Wolfram Language - WordCloud function :


It's great that the code in Wolfram Language is parsed as easily as plain text, and you can see the functions that are used most often. In the code above, three very useful tricks are used. First, the WordOrientation option has different settings for the direction of spelling of the word. The second is that the ScalingFunctions option can add some visual appeal, and the simple power law I chose is often more flexible than logarithmic. The third trick is more subtle. Make the selection of the background color as the lower color layer of the ColorFunction function. Then not only the sizes of the letters will be displayed according to their weight, but also because of their color they will merge with the background.
Above in the TimelinePlot infographic, you can see that a total eclipse, which will occur on August 21, 2017, will cover the territory of the United States from north-west to south-east. In the Wolfram Community, I created another post , in which are some calculations related to this eclipse. It lists the states of America from which it will be possible to observe a total eclipse. In order to learn the details, you can refer to the original. Each region is colored according to cloud data in 2000–2015. This is an estimate of the probability of a good eclipse visibility. The colder the color, the higher the chance that the sky will be clear. It is worth noting that this is quite approximate, especially given the fact that the data of weather stations are not particularly reliable. GeoEntities is a very convenient feature. It selects only those geographical objects that are included in the area of total eclipse. Below is excellent graphics, which, I think, can be created with just a few lines of code only in the Wolfram Language:


And now, when we looked into the past and the future of total solar eclipses, do we still have any other questions to discuss? Of course - extraterrestrial solar eclipses! We live in a unique time on a unique planet - with the only Moon and Sun, whose diameters to the observer seem almost the same. I mentioned above a documentary program where the BBC team filmed a video of a total solar eclipse from an airplane over the Faroe Islands. At the conclusion of the show, Liz Bonnin (Liz Bonnin), who was on the plane, said: “There is no other planet in the solar system where an eclipse occurs just like ours. Even in spite of the fact that the Sun is 400 times larger than the Moon, at the time of the eclipse it is 400 times closer to the Earth than the Sun, and therefore they appear to be the same size. ”
So can we verify that our planet is unique in this sense? Jeff Bryant asked this question in a not so long ago published Community post . He made some calculations using the PlanetData function (data on planets) and PlanetaryMoonData (data on satellites (moons) of planets) to study solar eclipses on other planets. The main goal is to compare the angular diameter of the Sun with the angular diameter of a particular satellite, when it is observed from the surface of a given planet. He used the semi-major axis of the satellite’s orbit to estimate its distance from the planet. The full code is in the original message. Here I give the final results. For the Earth, the coefficient of overlap is almost unity, that is, the Moon completely covers the Sun during a total solar eclipse:

Here is the data of Mars. The largest satellite of Mars - Phobos - covers the Sun during an eclipse by only 60% (when observing an eclipse from Mars):

When a man’s flight to Mars is getting closer to reality, isn't it curious how the solar eclipses look like there? Here are some spectacular photos of Phobos taken by NASA's Curiosity rover passing right in front of the Sun:

NASA / JPL-Caltech / Malin Space Science Systems / Texas A & M Univ.
These are the clearest images of the solar eclipse that have ever been made on Mars. As you can see, Phobos covers the Sun only partially (according to our calculations by 60%), when viewed from the surface of Mars. Such a solar eclipse is called a ring or ring-type eclipse. Jupiter’s data is more promising:

The satellite of Jupiter - Amalthea - covers the Sun by a factor of 0.9, that is, by 90%. This means that the spectacular corona, which is visible from Earth during a solar eclipse, most likely will not be visible from Jupiter. During a total solar eclipse on Earth, the solar corona can be observed with the naked eye:

Image courtesy of Luc Viatour
Source: https://habr.com/ru/post/257455/
All Articles