Processing and display of signals at the conversion frequency of the ADC
Objective: To consider the features of the input and display of broadband signals.
The task of the work: Construction of the channel input, processing and display of signals at the maximum frequency conversion of the ADC controller Arduino.
Instruments and accessories: Arduino UNO controller, SimLink MatLAB package (R2012).
Developing software for monitoring, analyzing and processing signals at the controller level is time consuming. Connecting the controller to a high-level specialized environment (Fig. 1) significantly reduces the design time of the algorithm for the controller, taking into account the limitations of its resources.
A good example of a powerful specialized environment for working with signals is MatLAB. Signal analysis often requires observing its spectrum in the widest possible frequency band. For this, the controller must receive signals at the maximum conversion frequency of the ADC.
')
The construction of the working channel “Arduino UNO - MatLAB” for observing and processing signals in real time at the limiting frequency of the ADC conversion is described in detail in this work. A feature of this channel is that the real-time ticks are not set by MatLAB, but by the Arduino controller. Such a construction does not require compiling Simulink models with real-time (rtwin.tlc), which allows using virtually any blocks of the Simulink library in the model.
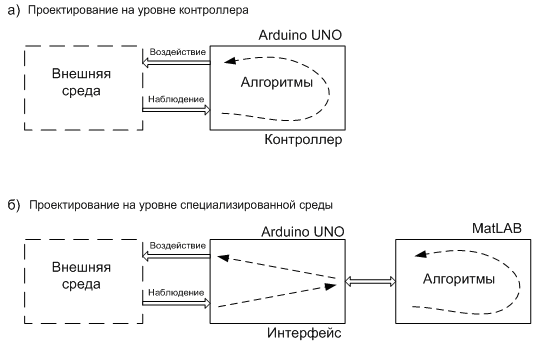
Fig. 1. Comparison of algorithm development tools. For designing algorithms at the level of a specialized environment, a data channel is required between the controller and the design environment.
Means of accumulation, analysis, processing and display of signals
This work uses the Simulink environment to receive and display Arduino controller data.
Simulink is an interactive environment and programming language for simulation modeling, which allows building dynamic models of processes using block diagrams. Simulink is integrated into MatLAB. The integration allows using ready-made block libraries, built-in mathematical algorithms, powerful tools for processing and graphical data display for solving the entire spectrum of problems from developing a concept of a model to testing, checking, code generation and hardware implementation.
The composition of the Simulink library expansion packs is shown in Fig. 4 by the example of the “DSP System Toolbox” digital signal processing package. 2

Fig. 2. An example of an additional Simulink extension package for modeling signal processing systems: DSP System Toolbox [1]. The package uses the latest spectral analysis algorithms. The contents of the Power Spectrum Estimation section are highlighted - blocks for spectral signal evaluation.
Streaming data
The use of two buffers for data accumulation and transmission allows you to organize the collection, processing and visualization of data without interruption (to avoid data loss, the speed of the subsequent process should not be lower than the speed of the previous process).
An example of such an organization could be the E14-440 module [2] for multichannel input, output and processing of analog and digital information that is connected to a computer via the USB bus.
Input data is first entered into the first half of the FIFO buffer of the ADC. After it is filled, the data begins to be transmitted to the PC, at the same time, data collection into the second half of the FIFO buffer does not stop. After the accumulation of data in the second half of the FIFO buffer, the data transfer to the PC begins again and in parallel the data collection continues to the first half.
Maximum data accumulation rate of the ADC
Using the output of the result on the monitor of the Arduino editor at the maximum frequency (57600 bps) we will write a program for calculating the conversion of ADC for a fixed period.
The program for measuring the conversion rate of the ADC:
const int adc_5 = A5; // ADC port number
unsigned long time_start; // Start of capturing, ms
unsigned long time_end; // End of capturing, ms
void setup () {
Serial.begin (57600); // 9600, 19200, 38400, 57600 and 115200 bit / s
}
void loop () {
time_start = millis ();
for (int i = 0; i <1024; i ++) {
int val = analogRead (adc_5);
}
time_end = millis ();
int period = time_end - time_start;
Serial.println (period);

Fig. 3. Time (in ms) 1024 and 512 ADC conversions. Average ADC conversion time: 0.1123 ms (as 115/1024).
ADC data scaling time
To convert 10 bit ADC data to 8 bit, use the function
map (val, 0, 1023, 0, 255);
where val is an int variable with 10 significant digits.
Program for measuring the conversion time of the ADC with scaling and writing to an array:
const int adc_5 = A5; // ADC port number
unsigned long time_start; // Start of capturing, ms
unsigned long time_end; // End of capturing, ms
byte adc_bytes [1024]; // Buffer for ADC data
void setup () {
Serial.begin (57600); // bit / s
}
void loop () {
time_start = millis ();
for (int i = 0; i <1024; i ++) {
int val = analogRead (adc_5);
adc_bytes [i] = map (val, 0, 1023, 0, 255);
}
time_end = millis ();
int period = time_end - time_start;
Serial.println (period);
}

Fig. 4. Time (in ms) 1024 ADC conversions, translation 10 p. data in 8 bit and write to the array. The ADC conversion period with scaling: 0.1611 ms (as 165/1024).
Since the conversion time of the ADC is 0.13 ms, one transfer of 10-bit data to byte format (scaling) is 0.0424 ms.
Serial data rate
To determine the rate of byte transfer to the serial channel, the code of the symbol Serial.write (1) is transmitted in a loop, which is not displayed on the monitor.
The main block of the program for determining the transmission rate:
void loop () {// Do stuff here
unsigned long time = millis ();
Serial.write (1);
rate = rate + 1;
if (time> set_time) {
set_time = set_time + 30; // 30 ms RT clock
Serial.println (rate);
rate = 0;
}
}

Fig. 5. Test data: the number of bytes transferred to the serial channel in 30 ms at 57600 bps.
The test showed that the transmission of 173 bytes takes 30 ms, on the other hand, for 30 ms at a speed of 57600 bps, 1728 bits can be transmitted. Consequently, the transmission of one byte consumes a transmission time of 10 bits. Using this relationship for transmit mode
• Data bits: 8
• Parity: none
• Stop bits: 1
• Flow control: none
You can calculate the time of streaming a dataset at different speeds.
Transmission, for example, 256 bytes at a speed of 9600 baud (bit / s) takes 267 ms, at a speed of 57600 baud - 44 ms; and at a speed of 115200 baud - 22 ms (as 256 * 10/115200).
The size of the array for the accumulation and transmission of data
The size of operational (SRAM) memory Arduino UNO is 2 KB. Testing the program for cyclic readout of the ADC, scaling 10 bit data to 8 bit, clocking and byte-by-bit data showed that the maximum size of the array for accumulating and sending data should not exceed 1800 bytes.
More complex programs may require more additional SRAM memory. Therefore, the array for accumulating and transmitting ADC data is limited to 1024 bytes or 512 words.
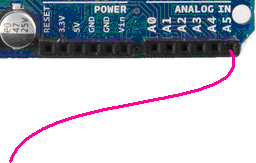
Fig. 6. A piece of wire connected to the analog input A5 of the Arduino controller to enhance the observed network pickup 50 Hz.
Table 1 . Times of program operations taking into account cycle instability

An example of setting the display channel 256 scaled ADC values at the maximum rate of accumulation and transmission of data.
Arduino controller program code:
const int adc_5 = A5; // ADC port number
unsigned long set_time; // Time of next clock
byte adc_bytes [256]; // Buffer for scaled ADC data
void setup () {
Serial.begin (115200); // bit / s
}
void loop () {
unsigned long time = millis (); // Current time in ms
// ADC data capturing
for (int i = 0; i <256; i ++) {
int val = analogRead (adc_5);
adc_bytes [i] = map (val, 0, 1023, 0, 255);
}
// send ADC data into serial port
Serial.print ("A"); // "A" is header
for (int i = 0; i <256; i ++) {
Serial.write (adc_bytes [i]);
}
if (time> set_time) {
set_time = set_time + 70; // RT clock is 70 ms
}
}
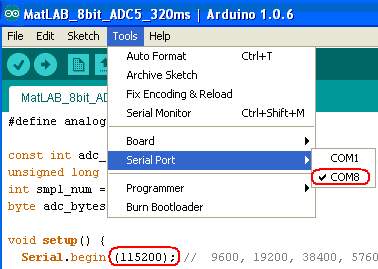
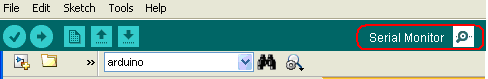
Fig. 7. Determine the port number in the Arduino environment.
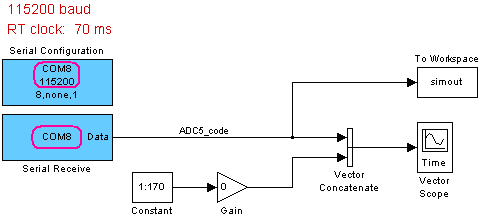
Fig. 8. Simulink model for receiving the controller's ADC data, scaling the vector of data over time, displaying data in real time and saving the data flow in the workspace.

Fig. 9. COM port parameters in Simulink environment (model block: Serial Configuration)

Fig. 10. Parameters of the Simulink model and simulation mode blocks.
The model is launched by pressing the Start simulation button:

Fig. 11. Start button model.
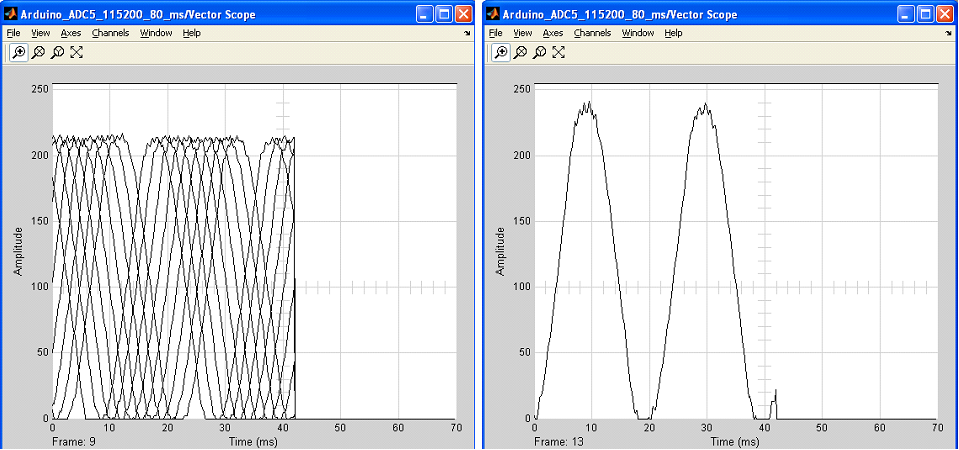
Fig. 12. Type of network pickup (connection is shown in Fig. 6) with overlapping frames (left window) and in a separate frame (right window). The reason for the signal offset when overlaying frames is the lack of display synchronization. Note: Simulink has enough tools to build a sync channel.
Task 1 . The accumulation, transmission and display of scaled data (see an example and a table of times on page 8).
1. Write for the Arduino UNO controller a program for cyclic reading of ADC readings, scaling, writing data to a 1024 byte array, and transmitting the array to a serial channel. The program must run at maximum speed. Symbol A is the header of the transmitted array.
Sample program:
const int adc_5 = A5; // ADC port number
unsigned long set_time; // Time of next clock
byte adc_bytes [1024]; // Buffer for ADC data
void setup () {
Serial.begin (115200); // bit / s
}
void loop () {
unsigned long time = millis (); // Current time in ms
// ADC data capturing
for (int i = 0; i <1024; i ++) {
int val = analogRead (adc_5);
adc_bytes [i] = map (val, 0, 1023, 0, 255);
}
// send ADC data into serial port
Serial.print ("A"); // "A" is header
for (int i = 0; i <1024; i ++) {
Serial.write (adc_bytes [i]);
}
if (time> set_time) {
set_time = set_time + 270; // RT clock is 270 ms
}
}
2. In the Matlab environment, compose a program of Simulink blocks for receiving and displaying controller data in real time. The speed, packet size, the period of received data and the cycle of the model should correspond to the corresponding parameters of the controller. Scale the time of the displayed data.

Fig. 13. Simulink model for receiving data at maximum frequency: 115200 baud. Vector concatenate is used to scale the signal along the frame time scale.
3. Check the quality of the channel “ADC Input - MatLAB Display”, for example, by the period of 50 Hz mains pickup at the ADC input. To increase the pickup amplitude, connect a piece of wire to the ADC input (see Fig. 6). The amplitude of the pickup depends on the distance between the wire and your hand.
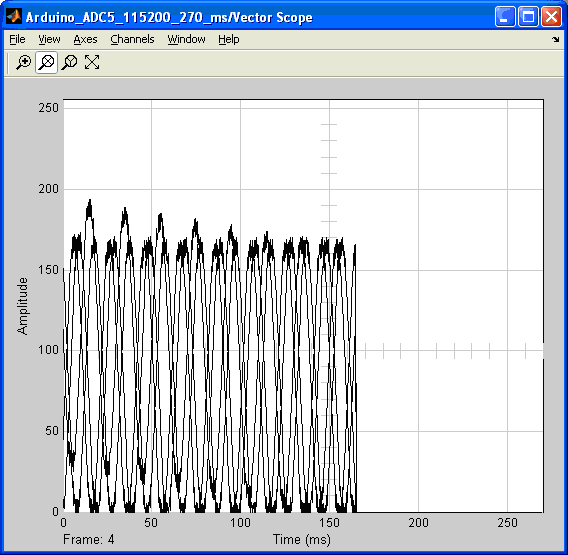
Fig. 14. Overlay 4 frames when scanning the frequency of 50 Hz at the input of the Arduino controller's ADC.

Fig. 15. Network frequency at the input of the ADC controller, 4 frame.
Task 2 . The accumulation, transmission and display of 10-bit ADC data.
1. For the Arduino UNO controller, write a program for cyclic reading of ADC readings, writing data to an array of 512 words, and byte-by-byte data transfer of the array to a serial channel. The program must run at maximum speed.
Sample program:
const int adc_5 = A5; // ADC port number
unsigned long set_time; // Time of next clock in ms
word adc_int [512]; // Buffer for ADC data
int val;
byte val_Lo, val_Hi;
void setup () {
Serial.begin (115200); // bit / s
}
void loop () {
unsigned long time = millis ();
// ADC data capturing
for (int i = 0; i <512; i ++) {
adc_int [i] = analogRead (adc_5);
}
// send ADC data into serial port
// first low bytes then high bytes
Serial.print ("A"); // "A" is header
for (int i = 0; i <512; i ++) {
val = adc_int [i];
val_Lo = (val << 1) & 0xFE;
Serial.write (val_Lo); // Lo byte
}
for (int i = 0; i <512; i ++) {
val = adc_int [i];
val_Hi = (val >> 6) & 0xE;
Serial.write (val_Hi); // Hi byte
}
if (time> set_time) {
set_time = set_time + 160; // RT clock is 160 ms
}
}
2. Create a Simulink program to accept the recovery and display the controller's ADC data. The speed, the packet size and the period of received data must match the corresponding parameters of the controller. Scale the time of the displayed data.

Fig. 16. Simulink program for receiving, restoring and displaying the data array of the Arduino UNO controller ADC.
3. Record network 50 Hz pickups.

Fig. 17. The imposition of 15 frames when scanning a 50Hz network pickup at the input of the controller's ADC. Program period: 160 ms. Time to fill the array with ADC data: 58 ms. The transmission time is 512x2 bytes at a frequency of 115200 baud: 89 ms.
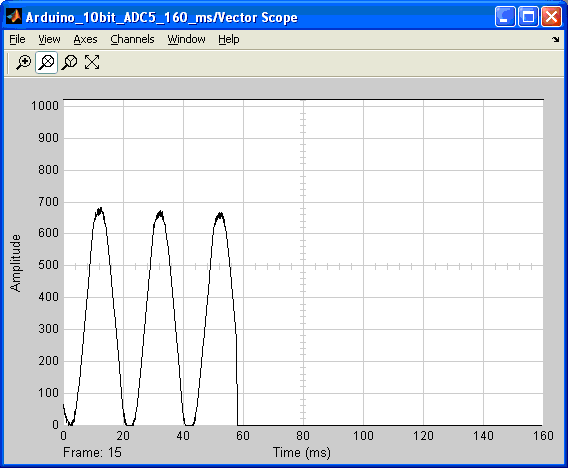
Fig. 18. The last 15 frames. Time 3.5 cycles 50 Hz signal: 70 ms.
Task 3 . Signal processing by MatLAB m-program
1. Save the real-time data in the MatLAB memory workspace, for example, using the simout block (see Fig. 13).
2. Copy the saved data to the working directory, for example:
save ('simout_50Hz', 'simout');
3. Develop the MatLAB m-program to display the archived ADC signal of the controller.
Code example:
clear all
load ('simout_50Hz');
d_frame = simout.Time (2) -simout.Time (1);
size_frame = size (simout.Data, 1);
sampling = d_frame / (size_frame + 163 * 4); % dt
data_size = size (simout.Data, 1) * size (simout.Data, 2) * size (simout.Data, 3);
% time = (0: data_size-1) * sampling;
time = [];
for i = 1: length (simout.Time)
time = [time (0: 1023) * sampling + simout.Time (i)];
end
adc = uint8 ([]);
for i = 1: size (simout.Data, 3)
adc = [adc simout.Data (:,:, i) '];
end
% frame_num = length (simout.Time)% or size (adc, 3)% is 54 frame
if 1%
figure
plot (time, adc, 'b')
grid on
xlabel ('Time, s');
ylabel ('ADC [0 ... 255], bit');
title ('8 bit ADC frame against Time');
end

Fig. 19. Frame-by-frame change of 50 Hz pickup at the input of the ADC controller Arduino UNO: 24 frames of 0.27 seconds.
4. Develop an m-program for calculating the signal parameters, for example, the period in a given frame.
Code example:
clear all
load ('simout_50Hz');
d_frame = simout.Time (2) -simout.Time (1);
sampling = d_frame / ((256 + 176) * 4); % dt
data_size = size (simout.Data, 1) * size (simout.Data, 2) * size (simout.Data, 3); % <256 x 1 x 54>
% FRAME number
i = 5;
time = (0: 1023) * sampling + simout.Time (i);
adc = simout.Data (:,:, i) ';
if 1%
figure
plot (time, adc, 'b')
grid on
xlabel ('Time, s');
ylabel ('ADC [0 ... 255], bit');
title ('8 bit ADC frame against Time');
end
% period
comp_level = 60;
j = 1;
for i = 2: length (adc)
if (adc (i)> = comp_level) && (adc (i-1) <comp_level)
cell_num (j) = i;
j = j + 1;
end
end
s_period = diff (time (cell_num));

Fig. 20. Continuous and pointwise change of the signal in the selected frame. Time 5 frames: 1.08 ... 1.24 sec. Vector size: 1024 bytes. Therefore, the time of one readout and scaling of the signal of the ADC: 0.156 ms.
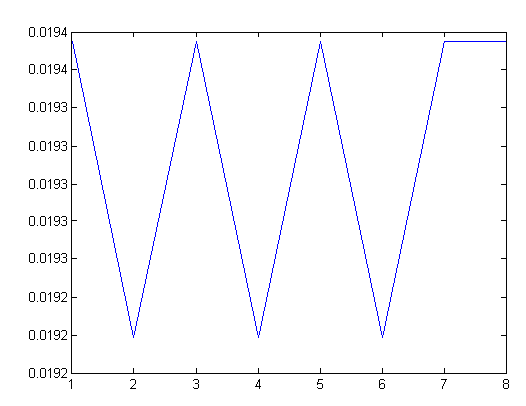
Fig. 21. Period of network pickup 5 frames: 19.2 ... 19.4 ms.
Task 4 . The construction of the spectrum of the signal in real time.
1. To observe the frequency spectrum of a signal, connect a fast Fourier transform unit (Spectrum Scope: FFT) from the Simulink> DSP System Toolbox> Sinks library section to the displayed signal.

Fig. 22. Model with a spectroscope.

Fig. 23. Spectrum network jitters. The frame signal includes 1024 amplitudes and 163x4 zero values.
2. Highlight the main harmonic signal: 50 Hz.
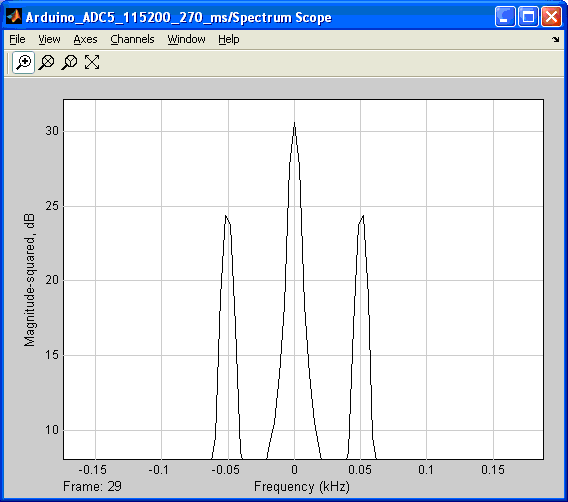
Fig. 24. Harmonic signal at a frequency of 50 Hz.
3. Connect the Spectrum Scope: FFT to an unscaled (in time) signal.

Fig. 25. Transfer of the connection point of the spectrograph. The input is an unscaled signal with a smaller zone of zero values at the end of the array (vector).
4. Configure the block. Select the type of spectrum displayed: Spectrum Type.
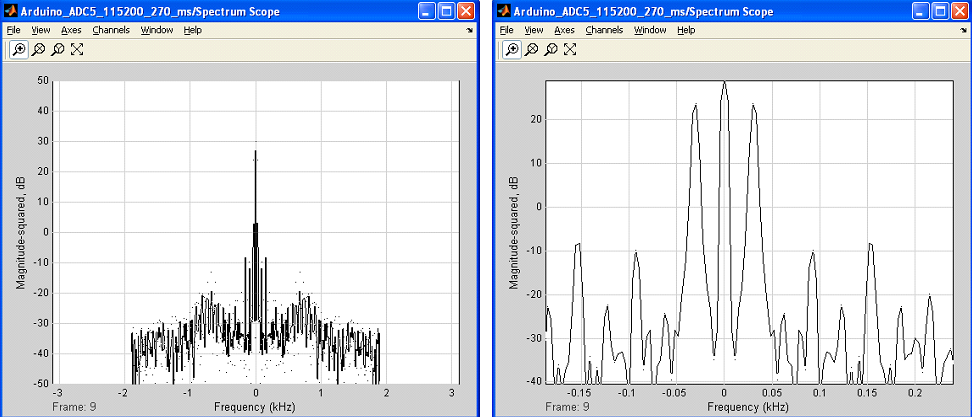
Fig. 26. Parameters of the spectrometer unscaled signal of 1024 amplitudes.
Task 5 . Build a channel of high-speed streaming and processing of 8p data in real time without skipping data.
1. Write for the Arduino UNO controller a program for cyclic reading of ADC readings, scaling and transfer to the serial channel of 2048 bytes with a header. The program should read the ADC at a constant frequency without interruption.
Sample program:
const int adc_5 = A5; // ADC port number
void setup () {
Serial.begin (115200); // bit / s
}
void loop () {
for (int i = 0; i <2048; i ++) {
if (i == 0) Serial.print (“A„); // “A” is header
int val = analogRead (adc_5);
byte adc_byte = map (val, 0, 1023, 0, 255);
Serial.write (adc_byte);
}
}
2. Configure the Simulink model (MATLAB) to receive controller data.

Fig. 27. An example of a model for displaying a continuous stream of data. The frame contains 2048 bytes.
3. Set the model simulation time (Menu> Simulation> Configuration Parameters> Solver> Fixed-step size) and the cycle time of the Serial Receive> Block Sample Time block (see Fig. 10) over the 50 Hz network period.
Estimated frame time by data Table 1: 254 ms (for 1024 bytes) => 508 ms for 2048 bytes. In fact, the time frame of the program (in which ADC reading and transmission are performed alternately) is 375 ms.

Fig. 28. Vector Scope Plotter Frame. In the frame 18.75 periods 50 Hz wave. Therefore, the frame time should be 375 ms, and the ADC conversion, scaling, and data transfer period: 0.1831 ms.
4. In the command window of the MatLAB, type the command to form a 5-frame signal.
sgnl = [simout.Data (:, 1,1) 'simout.Data (:, 1,2)' simout.Data (:, 1,3) 'simout.Data (:, 1,4)' simout.Data (:, 1,5) '];
5. Build a graph of the first 5 frames of the signal.

Fig. 29. Five frames of the input signal of the model.
6. Consider the quality of frame joints.

Fig. 30. Joints of five frames. There are noticeable distortions in the first byte of each frame. Replacing the first byte of the average values between the nearest points can significantly reduce distortion.
7. Connect a spectrum analyzer to the input of the model. Watch the signal spectrum in real time.

Fig. 31. The model of the display spectrum of the input signal (ADC Arduino UNO) in real time.

Fig. 32. The spectrum of network crosstalk at the input of the Arduino controller's ADC.
8. Connect the Time Scope oscilloscope from the Simulink> DSP System Toolbox> Sinks library to the input signal.

Fig. 33. Oscilloscope in the model to display the input signal of the Arduino controller.
9. Adjust the oscilloscope to display the current frame content and signal frequency.

Fig. 34. Configure the oscilloscope Time Scope> Menu> View> Properties.
10. Run the model and observe the stability of the signal parameters.
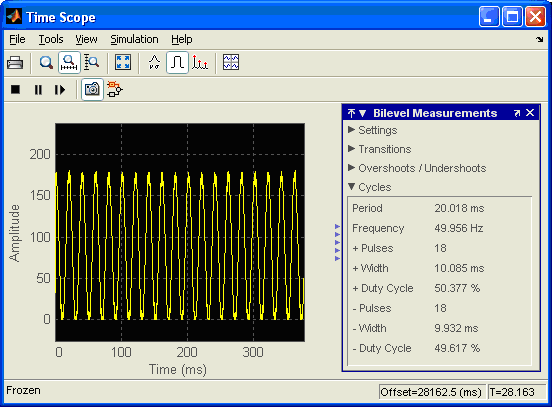
Fig. 35. Display the signal and its parameters in real time on a Simulink oscilloscope model.
The latest version of the channel controller Arduino - MatLAB in comparison with previous versions has the following advantages.
• the controller memory is not used to accumulate ADC data;
• provides a small ADC conversion clock with scaling, which is slightly longer than the ADC conversion clock with scaling in the absence of transmission;
• no time scaling is required in the Simulink model;
• model contains fewer blocks;
• The vector size and frame time are practically unlimited.
Task 6. Increase the sampling frequency of the ADC signal.
The sampling frequency of the Arduino controller's ADC can be increased to 15 kHz in 10-bit mode and to 77 kHz in 8-bit mode [3], replacing library functions with a faster version of using microcontroller registers.
The user function can be created in the * .ino program or in the system file of the controller
... \ arduino-1.0.6 \ hardware \ arduino \ cores \ arduino \ wiring_analog.c, registering it with
... \ arduino-1.0.6 \ hardware \ arduino \ cores \ arduino \ Arduino.h
To build an 8-bit high-speed channel Arduino - MatLAB, you must do the following.
1. Write a program for determining the time of filling the ADC array with data with the result displayed in the “Serial Monitor” window. The size of the array should be large enough, for example, in half of the SRAM memory. To increase accuracy, measure the time of multiple filling of the array.
Sample program:
byte adc_bytes [1024]; // Backup array for ADC data
void setup () {
Serial.begin (57600); // bit / s
ADCSRA = (1 << ADEN) // Enable ADC
| (1 << ADPS2); // Set the converter's prescaler to 8
ADMUX = (1 << ADLAR) | (1 << REFS0) // Connecting External ION
| (1 << MUX2) | (0 << MUX1) | (1 << MUX0); // connect ADC A5 == 101
}
void loop () {
unsigned long time_start = millis ();
for (int j = 0; j <100; j ++) {
for (int i = 0; i <1024; i ++) {
ADCSRA | = (1 << ADSC); // Start ADC conversion
while ((ADCSRA & (1 << ADIF)) == 0); // Waiting for the conversion completion flag
adc_bytes [i] = ADCH; // Read the received value
}
}
unsigned long time_end = millis ();
unsigned int dt = time_end - time_start;
Serial.println (dt);
}
One hundred fillings in an array of 1024 bytes were completed in 1542 ms .
2. Complete the one-time filling of the array with the ADC data by the subsequent transfer of the entire array to the serial port at maximum speed.
Sample program:
byte adc_bytes [1024]; // Backup array for ADC data
void setup () {
Serial.begin (115200); // bit / s
ADCSRA = (1 << ADEN) // Enable ADC
| (1 << ADPS2); // Set the converter's prescaler to 8
ADMUX = (1 << ADLAR) | (1 << REFS0) // Connecting External ION
| (1 << MUX2) | (0 << MUX1) | (1 << MUX0); // connect ADC A5 == 101
}
void loop () {
for (int i = 0; i <1024; i ++) {
ADCSRA | = (1 << ADSC); // Start ADC conversion
while ((ADCSRA & (1 << ADIF)) == 0); // Waiting for the conversion finish flag
adc_bytes [i] = ADCH; // Read the resulting value
}
// send ADC data into serial port
Serial.print ("A"); // "A" is header
for (int i = 0; i <1024; i ++) {
Serial.write (adc_bytes [i]);
}
}
3. In the Simulink model (Fig. 36), in the format 0.01542, enter the experimental value of the recording time in the array, namely, in the “Block sample time” line of the “Serial Receive” block and in the menu bar> simulation> Configuration Parameters> Fixed-step size (fundamental sample time).
<img src = "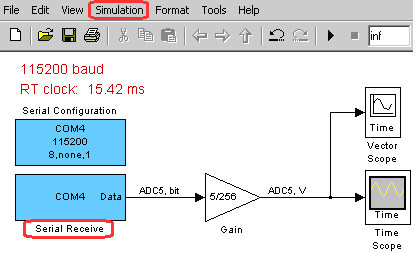
Fig. 36. Simulink model for receiving and displaying data from the COM port.
4. Connect a test signal to the ADC input. Run the Arduino program and then the Simulink model (MatLAB). Compare the known parameters of the signal with the parameters of the observed signal. You can check the path operation by displaying alternately connected output voltages of the Arduino board: 0V; 3.3B and 5B.
<img src = "<img src ="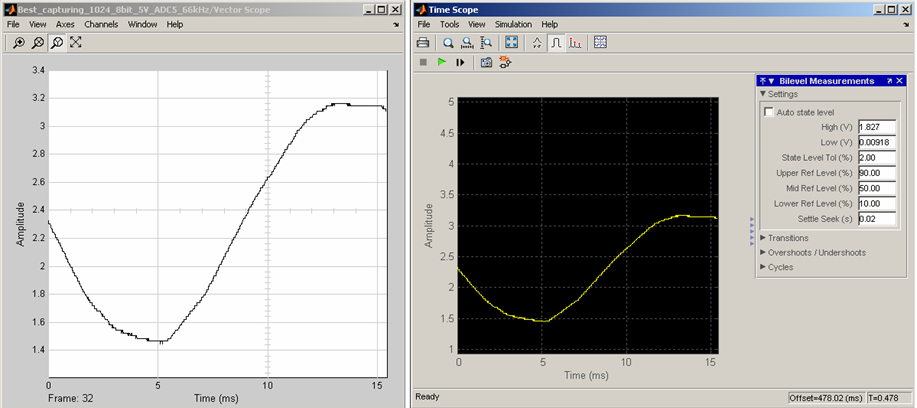
Fig. 37. Real-time display of network 50 Hz pickups. The frame includes 1024 points. The frame time is 15.42 ms. The sampling frequency is 66 kHz (as 1 / (0.01542_sec / 1024)). The displayed signal has gaps: the recording process is interrupted by the transmission of a frame to the serial channel.
<img src = "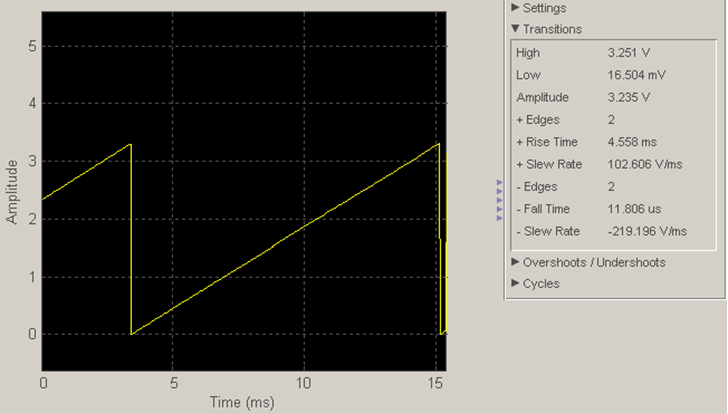
Fig. 38. 0… 3.3 , Teensy 3.1 12 (A5) Arduino.
<img src = "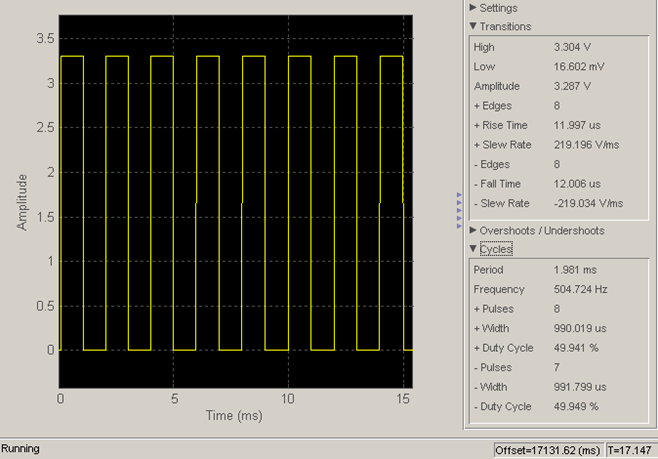
Fig. 39. 500 Teensy 3.1. (15.42 ) Simulink 1% ( 100%*(504.72 — 500)/500). RT , .3 .
1. .
2. ?
3. 1024 115200 /c ?
• Data bits: 8
• Parity: none
• Stop bits: 1
• Flow control: none
1. DSP System Toolbox. matlab.ru/datasheets/Dsp-system-toolbox-Ru.pdf
2. Dr. Bob Davidov. USB Lcard E14-440 (S-function) portalnp.ru/2013/09/1036
3. ATmega48A/PA/88A/PA/168A/PA/328/P. ATMEL 8-bit microcontroller with 4/8/16/32kbytes in-system programmable flash DATASHEET ( 237) www.atmel.com/images/Atmel-8271-8-bit-AVR-Microcontroller-ATmega48A-48PA-88A-88PA-168A-168PA-328-328P_datasheet_Complete.pdf
4. Dr. Bob Davidov. portalnp.ru/author/bobdavidov .
The task of the work: Construction of the channel input, processing and display of signals at the maximum frequency conversion of the ADC controller Arduino.
Instruments and accessories: Arduino UNO controller, SimLink MatLAB package (R2012).
INTRODUCTION
Developing software for monitoring, analyzing and processing signals at the controller level is time consuming. Connecting the controller to a high-level specialized environment (Fig. 1) significantly reduces the design time of the algorithm for the controller, taking into account the limitations of its resources.
A good example of a powerful specialized environment for working with signals is MatLAB. Signal analysis often requires observing its spectrum in the widest possible frequency band. For this, the controller must receive signals at the maximum conversion frequency of the ADC.
')
The construction of the working channel “Arduino UNO - MatLAB” for observing and processing signals in real time at the limiting frequency of the ADC conversion is described in detail in this work. A feature of this channel is that the real-time ticks are not set by MatLAB, but by the Arduino controller. Such a construction does not require compiling Simulink models with real-time (rtwin.tlc), which allows using virtually any blocks of the Simulink library in the model.
Fig. 1. Comparison of algorithm development tools. For designing algorithms at the level of a specialized environment, a data channel is required between the controller and the design environment.
GENERAL INFORMATION
Means of accumulation, analysis, processing and display of signals
This work uses the Simulink environment to receive and display Arduino controller data.
Simulink is an interactive environment and programming language for simulation modeling, which allows building dynamic models of processes using block diagrams. Simulink is integrated into MatLAB. The integration allows using ready-made block libraries, built-in mathematical algorithms, powerful tools for processing and graphical data display for solving the entire spectrum of problems from developing a concept of a model to testing, checking, code generation and hardware implementation.
The composition of the Simulink library expansion packs is shown in Fig. 4 by the example of the “DSP System Toolbox” digital signal processing package. 2
Fig. 2. An example of an additional Simulink extension package for modeling signal processing systems: DSP System Toolbox [1]. The package uses the latest spectral analysis algorithms. The contents of the Power Spectrum Estimation section are highlighted - blocks for spectral signal evaluation.
Streaming data
The use of two buffers for data accumulation and transmission allows you to organize the collection, processing and visualization of data without interruption (to avoid data loss, the speed of the subsequent process should not be lower than the speed of the previous process).
An example of such an organization could be the E14-440 module [2] for multichannel input, output and processing of analog and digital information that is connected to a computer via the USB bus.
Input data is first entered into the first half of the FIFO buffer of the ADC. After it is filled, the data begins to be transmitted to the PC, at the same time, data collection into the second half of the FIFO buffer does not stop. After the accumulation of data in the second half of the FIFO buffer, the data transfer to the PC begins again and in parallel the data collection continues to the first half.
BUILDING AN OSCILLOGRAPH ON THE BASIS OF ARDUINO CONTROLLER
Maximum data accumulation rate of the ADC
Using the output of the result on the monitor of the Arduino editor at the maximum frequency (57600 bps) we will write a program for calculating the conversion of ADC for a fixed period.
The program for measuring the conversion rate of the ADC:
const int adc_5 = A5; // ADC port number
unsigned long time_start; // Start of capturing, ms
unsigned long time_end; // End of capturing, ms
void setup () {
Serial.begin (57600); // 9600, 19200, 38400, 57600 and 115200 bit / s
}
void loop () {
time_start = millis ();
for (int i = 0; i <1024; i ++) {
int val = analogRead (adc_5);
}
time_end = millis ();
int period = time_end - time_start;
Serial.println (period);
Fig. 3. Time (in ms) 1024 and 512 ADC conversions. Average ADC conversion time: 0.1123 ms (as 115/1024).
ADC data scaling time
To convert 10 bit ADC data to 8 bit, use the function
map (val, 0, 1023, 0, 255);
where val is an int variable with 10 significant digits.
Program for measuring the conversion time of the ADC with scaling and writing to an array:
const int adc_5 = A5; // ADC port number
unsigned long time_start; // Start of capturing, ms
unsigned long time_end; // End of capturing, ms
byte adc_bytes [1024]; // Buffer for ADC data
void setup () {
Serial.begin (57600); // bit / s
}
void loop () {
time_start = millis ();
for (int i = 0; i <1024; i ++) {
int val = analogRead (adc_5);
adc_bytes [i] = map (val, 0, 1023, 0, 255);
}
time_end = millis ();
int period = time_end - time_start;
Serial.println (period);
}
Fig. 4. Time (in ms) 1024 ADC conversions, translation 10 p. data in 8 bit and write to the array. The ADC conversion period with scaling: 0.1611 ms (as 165/1024).
Since the conversion time of the ADC is 0.13 ms, one transfer of 10-bit data to byte format (scaling) is 0.0424 ms.
Serial data rate
To determine the rate of byte transfer to the serial channel, the code of the symbol Serial.write (1) is transmitted in a loop, which is not displayed on the monitor.
The main block of the program for determining the transmission rate:
void loop () {// Do stuff here
unsigned long time = millis ();
Serial.write (1);
rate = rate + 1;
if (time> set_time) {
set_time = set_time + 30; // 30 ms RT clock
Serial.println (rate);
rate = 0;
}
}
Fig. 5. Test data: the number of bytes transferred to the serial channel in 30 ms at 57600 bps.
The test showed that the transmission of 173 bytes takes 30 ms, on the other hand, for 30 ms at a speed of 57600 bps, 1728 bits can be transmitted. Consequently, the transmission of one byte consumes a transmission time of 10 bits. Using this relationship for transmit mode
• Data bits: 8
• Parity: none
• Stop bits: 1
• Flow control: none
You can calculate the time of streaming a dataset at different speeds.
Transmission, for example, 256 bytes at a speed of 9600 baud (bit / s) takes 267 ms, at a speed of 57600 baud - 44 ms; and at a speed of 115200 baud - 22 ms (as 256 * 10/115200).
The size of the array for the accumulation and transmission of data
The size of operational (SRAM) memory Arduino UNO is 2 KB. Testing the program for cyclic readout of the ADC, scaling 10 bit data to 8 bit, clocking and byte-by-bit data showed that the maximum size of the array for accumulating and sending data should not exceed 1800 bytes.
More complex programs may require more additional SRAM memory. Therefore, the array for accumulating and transmitting ADC data is limited to 1024 bytes or 512 words.
Fig. 6. A piece of wire connected to the analog input A5 of the Arduino controller to enhance the observed network pickup 50 Hz.
Table 1 . Times of program operations taking into account cycle instability
An example of setting the display channel 256 scaled ADC values at the maximum rate of accumulation and transmission of data.
Arduino controller program code:
const int adc_5 = A5; // ADC port number
unsigned long set_time; // Time of next clock
byte adc_bytes [256]; // Buffer for scaled ADC data
void setup () {
Serial.begin (115200); // bit / s
}
void loop () {
unsigned long time = millis (); // Current time in ms
// ADC data capturing
for (int i = 0; i <256; i ++) {
int val = analogRead (adc_5);
adc_bytes [i] = map (val, 0, 1023, 0, 255);
}
// send ADC data into serial port
Serial.print ("A"); // "A" is header
for (int i = 0; i <256; i ++) {
Serial.write (adc_bytes [i]);
}
if (time> set_time) {
set_time = set_time + 70; // RT clock is 70 ms
}
}
Fig. 7. Determine the port number in the Arduino environment.
Fig. 8. Simulink model for receiving the controller's ADC data, scaling the vector of data over time, displaying data in real time and saving the data flow in the workspace.
Fig. 9. COM port parameters in Simulink environment (model block: Serial Configuration)
Fig. 10. Parameters of the Simulink model and simulation mode blocks.
The model is launched by pressing the Start simulation button:
Fig. 11. Start button model.
Fig. 12. Type of network pickup (connection is shown in Fig. 6) with overlapping frames (left window) and in a separate frame (right window). The reason for the signal offset when overlaying frames is the lack of display synchronization. Note: Simulink has enough tools to build a sync channel.
EXAMPLES OF OBTAINING PROVEN RESULTS AND OPTIONS FOR SELF-CONTROL
Task 1 . The accumulation, transmission and display of scaled data (see an example and a table of times on page 8).
1. Write for the Arduino UNO controller a program for cyclic reading of ADC readings, scaling, writing data to a 1024 byte array, and transmitting the array to a serial channel. The program must run at maximum speed. Symbol A is the header of the transmitted array.
Sample program:
const int adc_5 = A5; // ADC port number
unsigned long set_time; // Time of next clock
byte adc_bytes [1024]; // Buffer for ADC data
void setup () {
Serial.begin (115200); // bit / s
}
void loop () {
unsigned long time = millis (); // Current time in ms
// ADC data capturing
for (int i = 0; i <1024; i ++) {
int val = analogRead (adc_5);
adc_bytes [i] = map (val, 0, 1023, 0, 255);
}
// send ADC data into serial port
Serial.print ("A"); // "A" is header
for (int i = 0; i <1024; i ++) {
Serial.write (adc_bytes [i]);
}
if (time> set_time) {
set_time = set_time + 270; // RT clock is 270 ms
}
}
2. In the Matlab environment, compose a program of Simulink blocks for receiving and displaying controller data in real time. The speed, packet size, the period of received data and the cycle of the model should correspond to the corresponding parameters of the controller. Scale the time of the displayed data.
Fig. 13. Simulink model for receiving data at maximum frequency: 115200 baud. Vector concatenate is used to scale the signal along the frame time scale.
3. Check the quality of the channel “ADC Input - MatLAB Display”, for example, by the period of 50 Hz mains pickup at the ADC input. To increase the pickup amplitude, connect a piece of wire to the ADC input (see Fig. 6). The amplitude of the pickup depends on the distance between the wire and your hand.
Fig. 14. Overlay 4 frames when scanning the frequency of 50 Hz at the input of the Arduino controller's ADC.
Fig. 15. Network frequency at the input of the ADC controller, 4 frame.
Task 2 . The accumulation, transmission and display of 10-bit ADC data.
1. For the Arduino UNO controller, write a program for cyclic reading of ADC readings, writing data to an array of 512 words, and byte-by-byte data transfer of the array to a serial channel. The program must run at maximum speed.
Sample program:
const int adc_5 = A5; // ADC port number
unsigned long set_time; // Time of next clock in ms
word adc_int [512]; // Buffer for ADC data
int val;
byte val_Lo, val_Hi;
void setup () {
Serial.begin (115200); // bit / s
}
void loop () {
unsigned long time = millis ();
// ADC data capturing
for (int i = 0; i <512; i ++) {
adc_int [i] = analogRead (adc_5);
}
// send ADC data into serial port
// first low bytes then high bytes
Serial.print ("A"); // "A" is header
for (int i = 0; i <512; i ++) {
val = adc_int [i];
val_Lo = (val << 1) & 0xFE;
Serial.write (val_Lo); // Lo byte
}
for (int i = 0; i <512; i ++) {
val = adc_int [i];
val_Hi = (val >> 6) & 0xE;
Serial.write (val_Hi); // Hi byte
}
if (time> set_time) {
set_time = set_time + 160; // RT clock is 160 ms
}
}
2. Create a Simulink program to accept the recovery and display the controller's ADC data. The speed, the packet size and the period of received data must match the corresponding parameters of the controller. Scale the time of the displayed data.
Fig. 16. Simulink program for receiving, restoring and displaying the data array of the Arduino UNO controller ADC.
3. Record network 50 Hz pickups.
Fig. 17. The imposition of 15 frames when scanning a 50Hz network pickup at the input of the controller's ADC. Program period: 160 ms. Time to fill the array with ADC data: 58 ms. The transmission time is 512x2 bytes at a frequency of 115200 baud: 89 ms.
Fig. 18. The last 15 frames. Time 3.5 cycles 50 Hz signal: 70 ms.
Task 3 . Signal processing by MatLAB m-program
1. Save the real-time data in the MatLAB memory workspace, for example, using the simout block (see Fig. 13).
2. Copy the saved data to the working directory, for example:
save ('simout_50Hz', 'simout');
3. Develop the MatLAB m-program to display the archived ADC signal of the controller.
Code example:
clear all
load ('simout_50Hz');
d_frame = simout.Time (2) -simout.Time (1);
size_frame = size (simout.Data, 1);
sampling = d_frame / (size_frame + 163 * 4); % dt
data_size = size (simout.Data, 1) * size (simout.Data, 2) * size (simout.Data, 3);
% time = (0: data_size-1) * sampling;
time = [];
for i = 1: length (simout.Time)
time = [time (0: 1023) * sampling + simout.Time (i)];
end
adc = uint8 ([]);
for i = 1: size (simout.Data, 3)
adc = [adc simout.Data (:,:, i) '];
end
% frame_num = length (simout.Time)% or size (adc, 3)% is 54 frame
if 1%
figure
plot (time, adc, 'b')
grid on
xlabel ('Time, s');
ylabel ('ADC [0 ... 255], bit');
title ('8 bit ADC frame against Time');
end
Fig. 19. Frame-by-frame change of 50 Hz pickup at the input of the ADC controller Arduino UNO: 24 frames of 0.27 seconds.
4. Develop an m-program for calculating the signal parameters, for example, the period in a given frame.
Code example:
clear all
load ('simout_50Hz');
d_frame = simout.Time (2) -simout.Time (1);
sampling = d_frame / ((256 + 176) * 4); % dt
data_size = size (simout.Data, 1) * size (simout.Data, 2) * size (simout.Data, 3); % <256 x 1 x 54>
% FRAME number
i = 5;
time = (0: 1023) * sampling + simout.Time (i);
adc = simout.Data (:,:, i) ';
if 1%
figure
plot (time, adc, 'b')
grid on
xlabel ('Time, s');
ylabel ('ADC [0 ... 255], bit');
title ('8 bit ADC frame against Time');
end
% period
comp_level = 60;
j = 1;
for i = 2: length (adc)
if (adc (i)> = comp_level) && (adc (i-1) <comp_level)
cell_num (j) = i;
j = j + 1;
end
end
s_period = diff (time (cell_num));
Fig. 20. Continuous and pointwise change of the signal in the selected frame. Time 5 frames: 1.08 ... 1.24 sec. Vector size: 1024 bytes. Therefore, the time of one readout and scaling of the signal of the ADC: 0.156 ms.
Fig. 21. Period of network pickup 5 frames: 19.2 ... 19.4 ms.
Task 4 . The construction of the spectrum of the signal in real time.
1. To observe the frequency spectrum of a signal, connect a fast Fourier transform unit (Spectrum Scope: FFT) from the Simulink> DSP System Toolbox> Sinks library section to the displayed signal.
Fig. 22. Model with a spectroscope.
Fig. 23. Spectrum network jitters. The frame signal includes 1024 amplitudes and 163x4 zero values.
2. Highlight the main harmonic signal: 50 Hz.
Fig. 24. Harmonic signal at a frequency of 50 Hz.
3. Connect the Spectrum Scope: FFT to an unscaled (in time) signal.
Fig. 25. Transfer of the connection point of the spectrograph. The input is an unscaled signal with a smaller zone of zero values at the end of the array (vector).
4. Configure the block. Select the type of spectrum displayed: Spectrum Type.
Fig. 26. Parameters of the spectrometer unscaled signal of 1024 amplitudes.
Task 5 . Build a channel of high-speed streaming and processing of 8p data in real time without skipping data.
1. Write for the Arduino UNO controller a program for cyclic reading of ADC readings, scaling and transfer to the serial channel of 2048 bytes with a header. The program should read the ADC at a constant frequency without interruption.
Sample program:
const int adc_5 = A5; // ADC port number
void setup () {
Serial.begin (115200); // bit / s
}
void loop () {
for (int i = 0; i <2048; i ++) {
if (i == 0) Serial.print (“A„); // “A” is header
int val = analogRead (adc_5);
byte adc_byte = map (val, 0, 1023, 0, 255);
Serial.write (adc_byte);
}
}
2. Configure the Simulink model (MATLAB) to receive controller data.
Fig. 27. An example of a model for displaying a continuous stream of data. The frame contains 2048 bytes.
3. Set the model simulation time (Menu> Simulation> Configuration Parameters> Solver> Fixed-step size) and the cycle time of the Serial Receive> Block Sample Time block (see Fig. 10) over the 50 Hz network period.
Estimated frame time by data Table 1: 254 ms (for 1024 bytes) => 508 ms for 2048 bytes. In fact, the time frame of the program (in which ADC reading and transmission are performed alternately) is 375 ms.
Fig. 28. Vector Scope Plotter Frame. In the frame 18.75 periods 50 Hz wave. Therefore, the frame time should be 375 ms, and the ADC conversion, scaling, and data transfer period: 0.1831 ms.
4. In the command window of the MatLAB, type the command to form a 5-frame signal.
sgnl = [simout.Data (:, 1,1) 'simout.Data (:, 1,2)' simout.Data (:, 1,3) 'simout.Data (:, 1,4)' simout.Data (:, 1,5) '];
5. Build a graph of the first 5 frames of the signal.
Fig. 29. Five frames of the input signal of the model.
6. Consider the quality of frame joints.
Fig. 30. Joints of five frames. There are noticeable distortions in the first byte of each frame. Replacing the first byte of the average values between the nearest points can significantly reduce distortion.
7. Connect a spectrum analyzer to the input of the model. Watch the signal spectrum in real time.
Fig. 31. The model of the display spectrum of the input signal (ADC Arduino UNO) in real time.
Fig. 32. The spectrum of network crosstalk at the input of the Arduino controller's ADC.
8. Connect the Time Scope oscilloscope from the Simulink> DSP System Toolbox> Sinks library to the input signal.
Fig. 33. Oscilloscope in the model to display the input signal of the Arduino controller.
9. Adjust the oscilloscope to display the current frame content and signal frequency.
Fig. 34. Configure the oscilloscope Time Scope> Menu> View> Properties.
10. Run the model and observe the stability of the signal parameters.
Fig. 35. Display the signal and its parameters in real time on a Simulink oscilloscope model.
The latest version of the channel controller Arduino - MatLAB in comparison with previous versions has the following advantages.
• the controller memory is not used to accumulate ADC data;
• provides a small ADC conversion clock with scaling, which is slightly longer than the ADC conversion clock with scaling in the absence of transmission;
• no time scaling is required in the Simulink model;
• model contains fewer blocks;
• The vector size and frame time are practically unlimited.
Task 6. Increase the sampling frequency of the ADC signal.
The sampling frequency of the Arduino controller's ADC can be increased to 15 kHz in 10-bit mode and to 77 kHz in 8-bit mode [3], replacing library functions with a faster version of using microcontroller registers.
The user function can be created in the * .ino program or in the system file of the controller
... \ arduino-1.0.6 \ hardware \ arduino \ cores \ arduino \ wiring_analog.c, registering it with
... \ arduino-1.0.6 \ hardware \ arduino \ cores \ arduino \ Arduino.h
To build an 8-bit high-speed channel Arduino - MatLAB, you must do the following.
1. Write a program for determining the time of filling the ADC array with data with the result displayed in the “Serial Monitor” window. The size of the array should be large enough, for example, in half of the SRAM memory. To increase accuracy, measure the time of multiple filling of the array.
Sample program:
byte adc_bytes [1024]; // Backup array for ADC data
void setup () {
Serial.begin (57600); // bit / s
ADCSRA = (1 << ADEN) // Enable ADC
| (1 << ADPS2); // Set the converter's prescaler to 8
ADMUX = (1 << ADLAR) | (1 << REFS0) // Connecting External ION
| (1 << MUX2) | (0 << MUX1) | (1 << MUX0); // connect ADC A5 == 101
}
void loop () {
unsigned long time_start = millis ();
for (int j = 0; j <100; j ++) {
for (int i = 0; i <1024; i ++) {
ADCSRA | = (1 << ADSC); // Start ADC conversion
while ((ADCSRA & (1 << ADIF)) == 0); // Waiting for the conversion completion flag
adc_bytes [i] = ADCH; // Read the received value
}
}
unsigned long time_end = millis ();
unsigned int dt = time_end - time_start;
Serial.println (dt);
}
One hundred fillings in an array of 1024 bytes were completed in 1542 ms .
2. Complete the one-time filling of the array with the ADC data by the subsequent transfer of the entire array to the serial port at maximum speed.
Sample program:
byte adc_bytes [1024]; // Backup array for ADC data
void setup () {
Serial.begin (115200); // bit / s
ADCSRA = (1 << ADEN) // Enable ADC
| (1 << ADPS2); // Set the converter's prescaler to 8
ADMUX = (1 << ADLAR) | (1 << REFS0) // Connecting External ION
| (1 << MUX2) | (0 << MUX1) | (1 << MUX0); // connect ADC A5 == 101
}
void loop () {
for (int i = 0; i <1024; i ++) {
ADCSRA | = (1 << ADSC); // Start ADC conversion
while ((ADCSRA & (1 << ADIF)) == 0); // Waiting for the conversion finish flag
adc_bytes [i] = ADCH; // Read the resulting value
}
// send ADC data into serial port
Serial.print ("A"); // "A" is header
for (int i = 0; i <1024; i ++) {
Serial.write (adc_bytes [i]);
}
}
3. In the Simulink model (Fig. 36), in the format 0.01542, enter the experimental value of the recording time in the array, namely, in the “Block sample time” line of the “Serial Receive” block and in the menu bar> simulation> Configuration Parameters> Fixed-step size (fundamental sample time).
<img src = "

Fig. 36. Simulink model for receiving and displaying data from the COM port.
4. Connect a test signal to the ADC input. Run the Arduino program and then the Simulink model (MatLAB). Compare the known parameters of the signal with the parameters of the observed signal. You can check the path operation by displaying alternately connected output voltages of the Arduino board: 0V; 3.3B and 5B.
<img src = "<img src ="

Fig. 37. Real-time display of network 50 Hz pickups. The frame includes 1024 points. The frame time is 15.42 ms. The sampling frequency is 66 kHz (as 1 / (0.01542_sec / 1024)). The displayed signal has gaps: the recording process is interrupted by the transmission of a frame to the serial channel.
<img src = "

Fig. 38. 0… 3.3 , Teensy 3.1 12 (A5) Arduino.
<img src = "

Fig. 39. 500 Teensy 3.1. (15.42 ) Simulink 1% ( 100%*(504.72 — 500)/500). RT , .3 .
1. .
2. ?
3. 1024 115200 /c ?
• Data bits: 8
• Parity: none
• Stop bits: 1
• Flow control: none
1. DSP System Toolbox. matlab.ru/datasheets/Dsp-system-toolbox-Ru.pdf
2. Dr. Bob Davidov. USB Lcard E14-440 (S-function) portalnp.ru/2013/09/1036
3. ATmega48A/PA/88A/PA/168A/PA/328/P. ATMEL 8-bit microcontroller with 4/8/16/32kbytes in-system programmable flash DATASHEET ( 237) www.atmel.com/images/Atmel-8271-8-bit-AVR-Microcontroller-ATmega48A-48PA-88A-88PA-168A-168PA-328-328P_datasheet_Complete.pdf
4. Dr. Bob Davidov. portalnp.ru/author/bobdavidov .
Source: https://habr.com/ru/post/257303/
All Articles