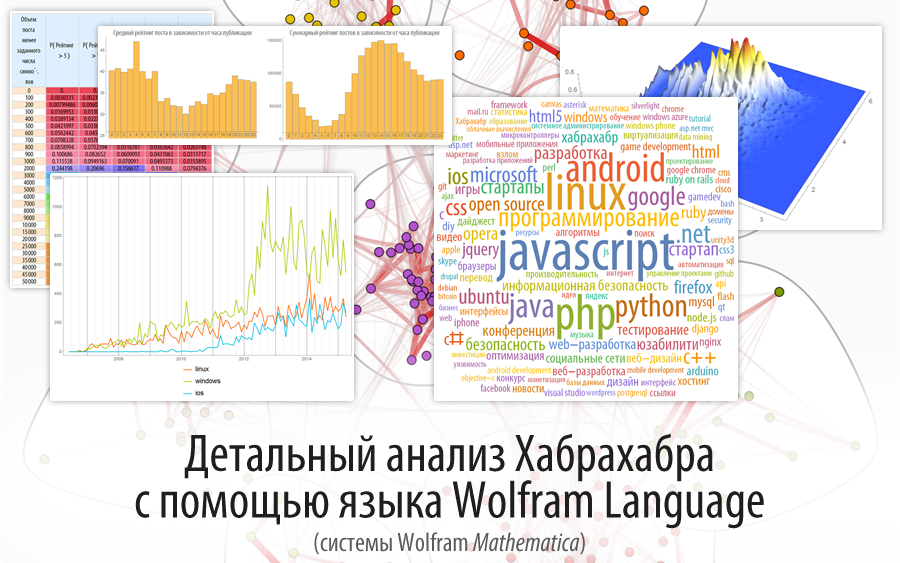
Detailed analysis of Habrahabr using the Wolfram Language (Mathematica)
Download the post in the form of a Mathematica document, which contains all the code used in the article, along with additional files, here (archive, ~ 147 MB).
Analysis of social networks and all kinds of media resources is now quite a popular area and it was even more surprising for me to find that, in fact, there are no articles on Habrahabr that would contain an analysis of a large amount of information (posts, keywords, comments, etc.) accumulated on it for quite a long period of work.
I hope that this post will be able to interest many Habrahabr participants. I will be happy with the suggestions and ideas of possible future directions for the development of this post, as well as any comments and recommendations.
')
In the post will be considered articles related to the hubs , all in the analysis involved 62,000 articles from 264 hubs . Articles written only for corporate blogs of companies were not considered in the post, and also the posts that were not included in the “interesting” group were not considered.
Due to the fact that the database built in the post was formed some time before the publication, namely on April 26, 2015, the posts published on the Habrahabr after this date (and also, possibly, new hubs) were not considered in this post.
Table of contents
Import hub list
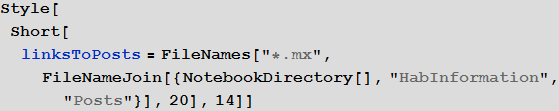
Import links to all articles Habrahabra
Import all Habrahabr articles
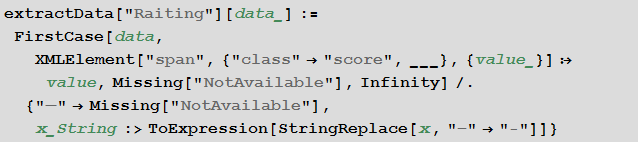
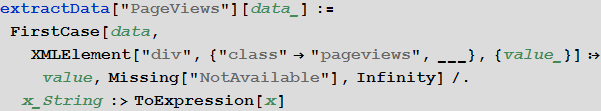
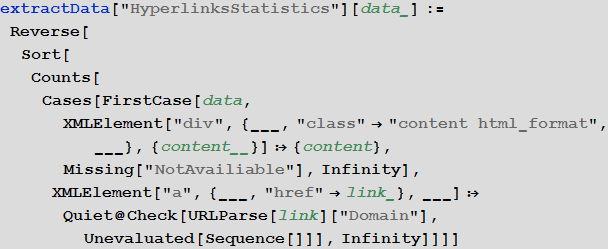
Functions to extract specific data from a character XML post representation
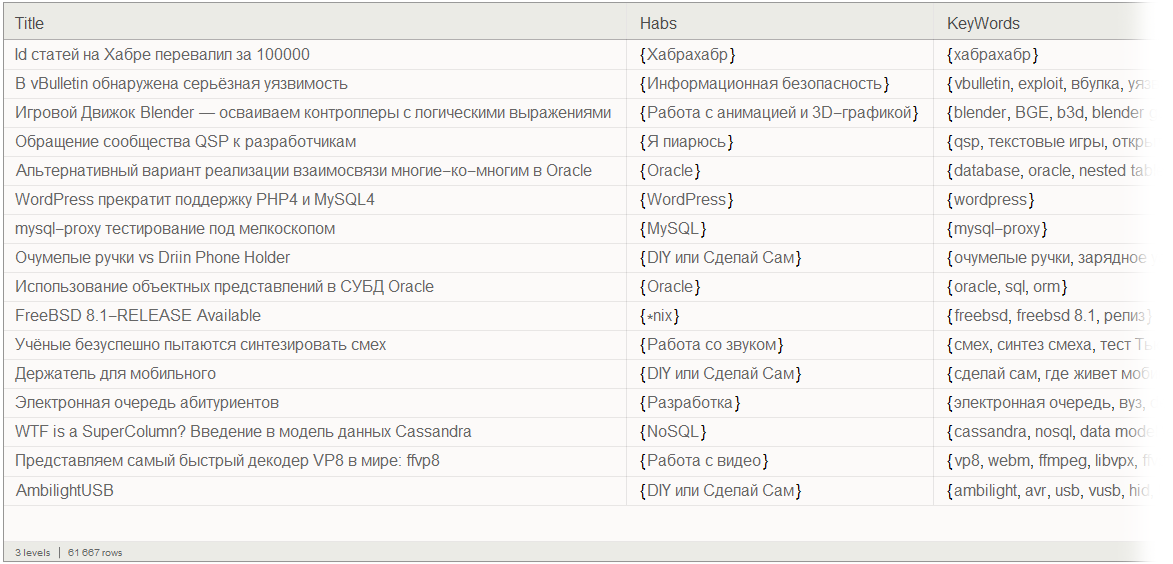
Creating a database of Habrahabr posts using Dataset
Data processing results
- Brief analysis of hubs
- Hub connections graph on Habrahabr
- Number of articles depending on time
- The number of images (video) used in posts depending on time
- Habrahabr keyword clouds and individual hubs
- Sites referenced in articles on Habrahabr
- Codes that lead in articles on Habrahabr
- Frequency of meeting words
- Rating and the number of views of posts, as well as the probability of achieving their specific values
- The dependence of the rating and the number of post views from the time of publication
- Dependence of the post rating on its volume
Conclusion
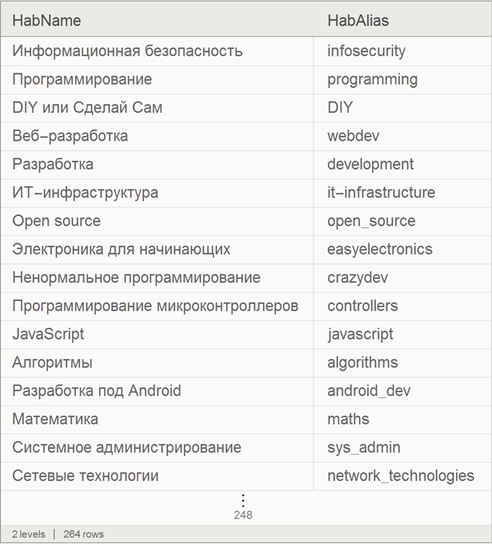
Import hub list
We import the list of hubs and present them in the form of the built-in Dataset database format for the convenience of further work.
Import links to all articles Habrahabra
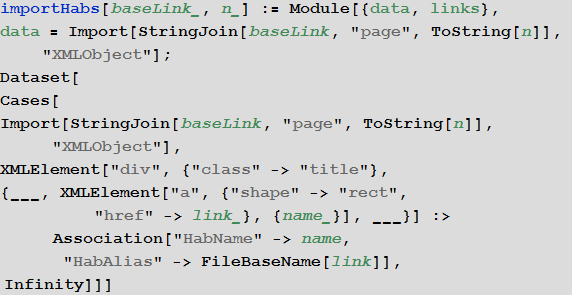
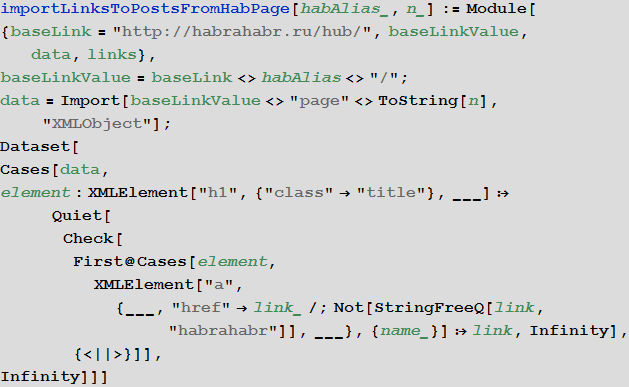
The link import function from the n-th page of a hub:
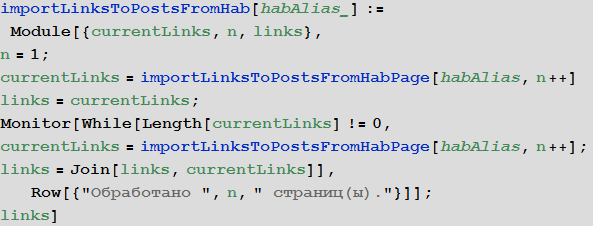
The function of importing links to all articles located in a hub:
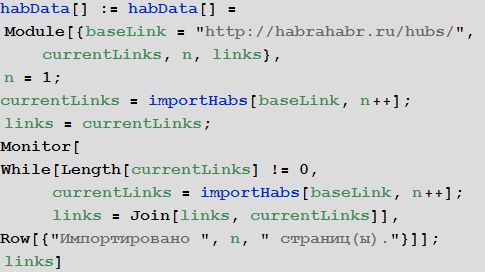
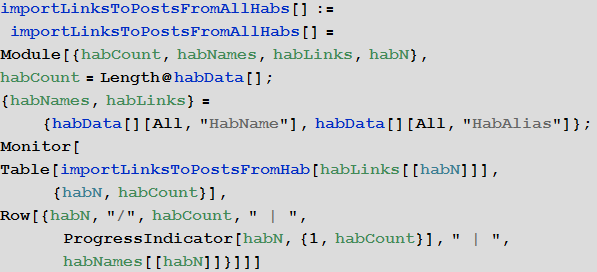
The function of importing links to all posts from all hubs (except corporate blogs):
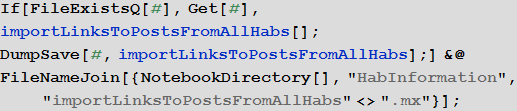
Import and save Wolfram Language binary dump file (for later instant use) links to all posts from all hubs:
Import all Habrahabr articles
Total database of links to posts:
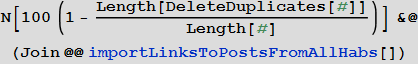
At the same time, there are quite a few duplicates among them, which is due to the fact that the same post often refers to different hubs. Total duplicate posts ~ 30.6% , which can be seen from the code below.
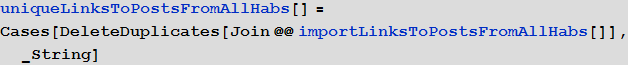
Create a list of unique links to posts:
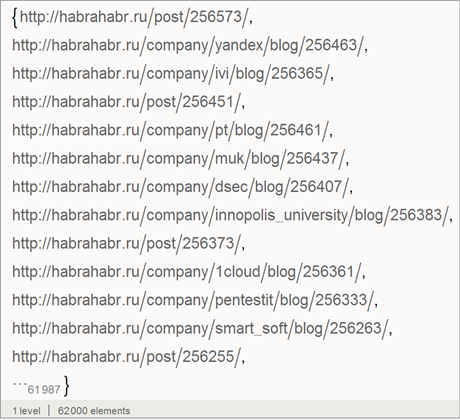
In total, we have 62,000 links that correspond to the same number of articles.
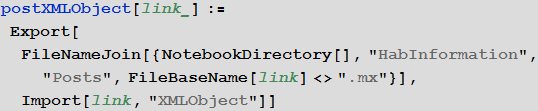
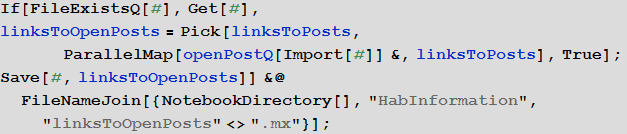
Let's create a function responsible for importing the HTML code of a web page (post) as a symbolic XML object ( XMLObject ) following a link to this page, which in turn creates a Wolfram Language serial .mx package.
Run the download of all posts:
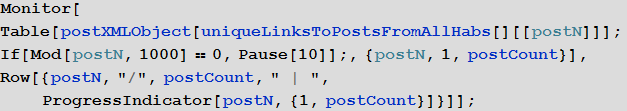
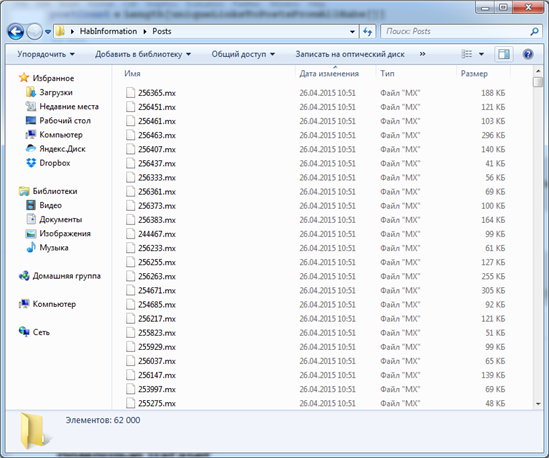
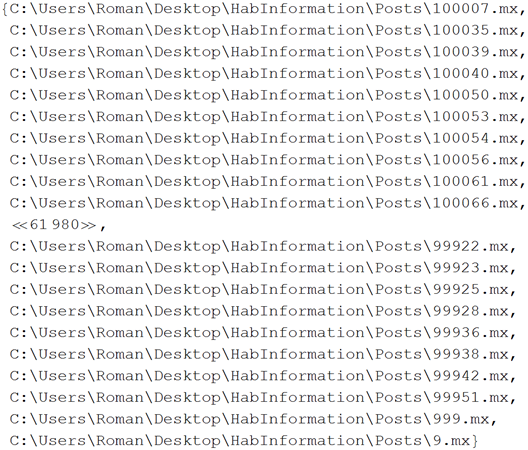
After the download is complete, we will receive 62,000 files on the hard disk:
Functions to extract specific data from a character XML post representation
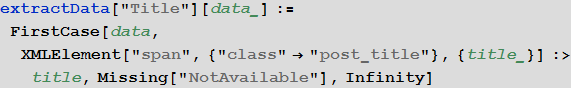
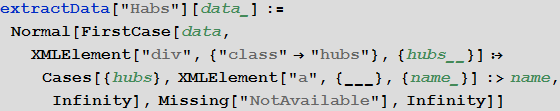
After we loaded all the posts from Habrahabr in the format of symbolic XML objects, we will need to extract from them the information of interest to us. To do this, we will create a number of functions presented below.
Post title
List of hubs in which the post was published
Date and time of publication of the post in absolute time format (for convenience of further work).
Post rating
The number of post views
Statistics hyperlinks given in the post
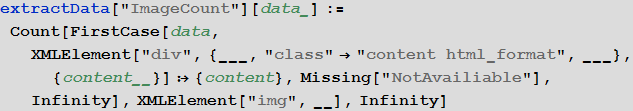
Number of images used in the post
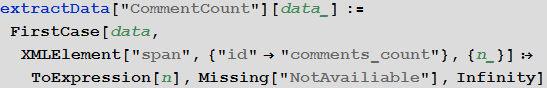
Number of comments to the post
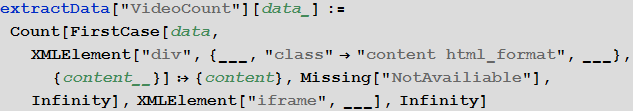
The number of videos inserted in the post
The text of the post in a standardized form (paragraphs are eliminated, all letters are capitalized)
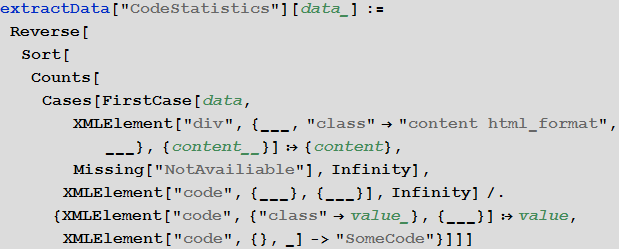
Statistics codes given in the post
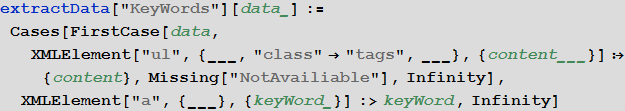
Keywords
Creating a database of Habrahabr posts using Dataset
In some cases, access to posts is closed for various reasons. At the same time, if you follow the corresponding link, you can see a page of this kind:

Create a function that sifts out such pages:
Now we will load the paths to all .mx files where posts are stored:
And remove the closed ones:
In total, about 0.5% of posts that were closed were removed:
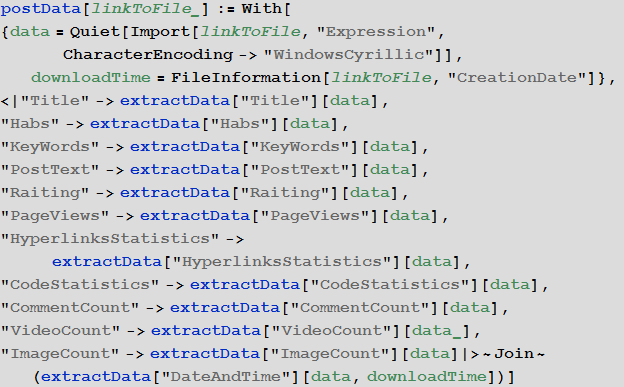
Let's create a function that will create a row of the database about Habrahabr posts, which we will get below. We do this with the help of previously created functions, as well as the Association function.
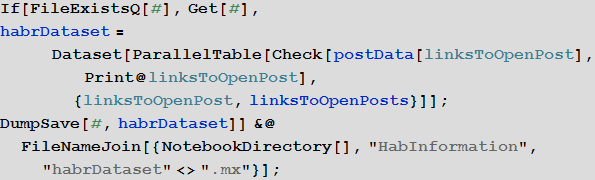
Finally, let's create a database of Habrakhabr posts using the Dataset function:
Data processing results
Brief analysis of hubs
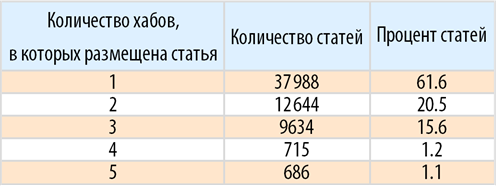
Find the distribution of the number of hubs in which the article is posted:
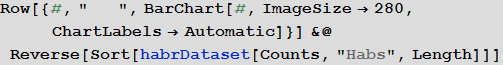
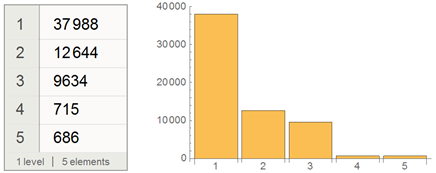
Let's present this fragment of Dataset in the form of a table:
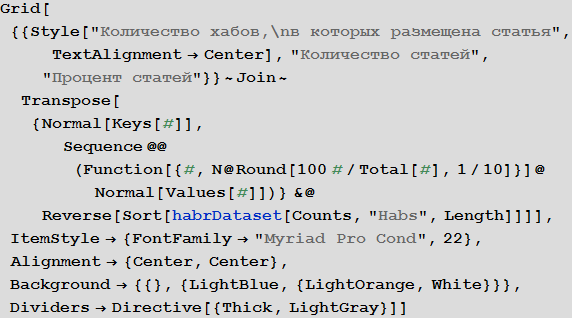
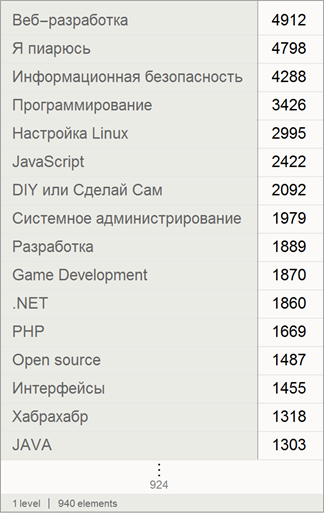
Find the largest hubs in the number of articles:
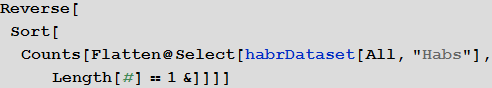
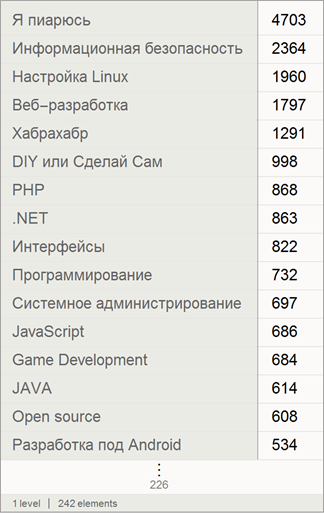
If we consider only unique articles (related to only one hub, then the picture will change somewhat):
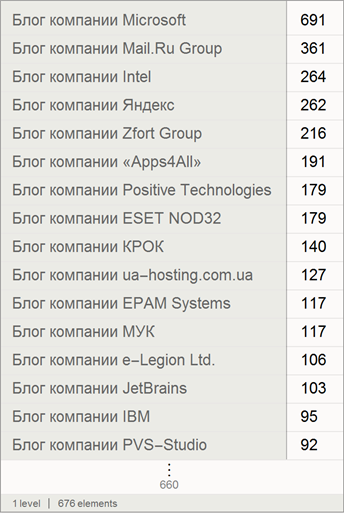
Also, we will find the number of posts of companies (posts that were written by the company only for their blog are not counted here):
Hub links graph on Habrahabr
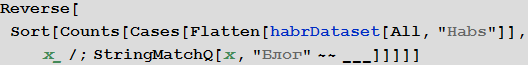
Create a function that calculates the measure of similarity of two hubs on the list of posts that are published in them, based on the Sørensen coefficient :
Create a list of all possible pairs of hubs (we do not consider company hubs)
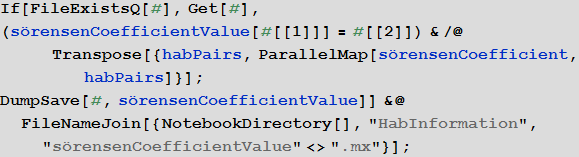
For each pair of hubs, we calculate their similarity coefficient:
Create lists defining the edges of the graph and their weights:
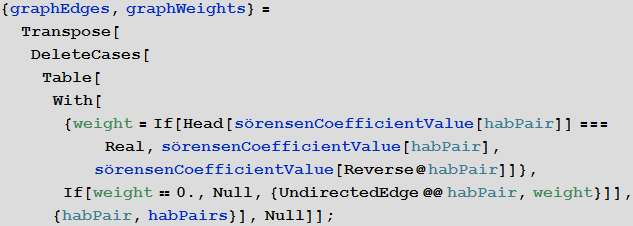
For coloring, create a function that normalizes the obtained values of the similarity coefficient to the segment [0; one]:
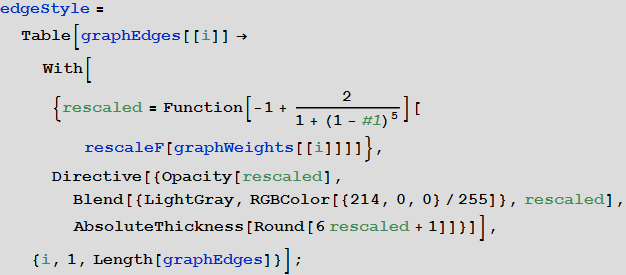
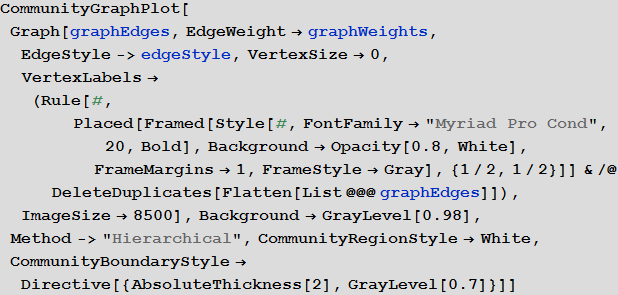
Set the color, thickness and transparency of the edges, depending on the similarity coefficient. The greater the weight of the ribs, the thicker and redder it is. The lighter its weight, the more transparent and thinner it is.
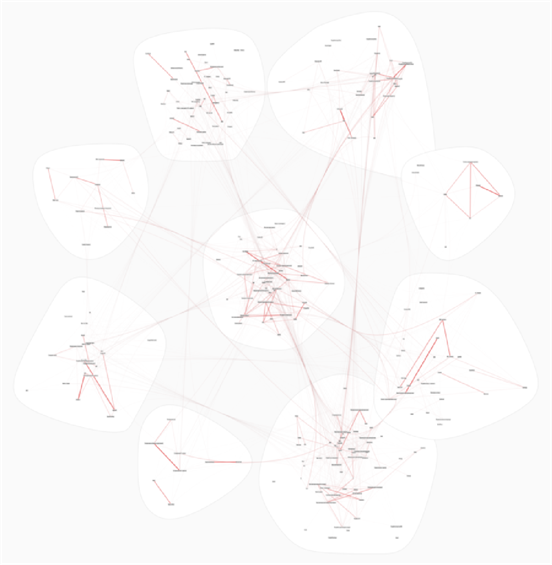
The resulting graph is interactive, when you hover over each of the vertices you can see its name.
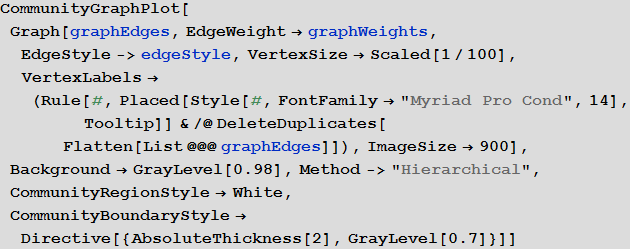
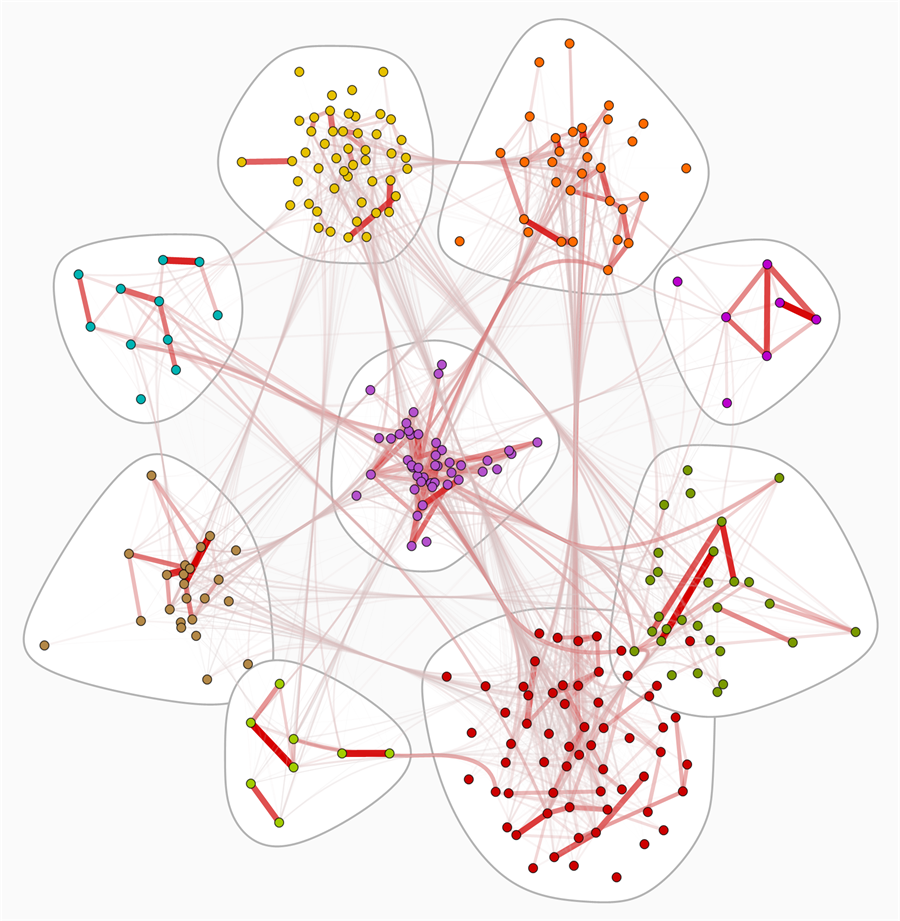
You can also change the style of this graph by displaying the names of the vertices. View this graph in natural size by the link (image, 12 MB).
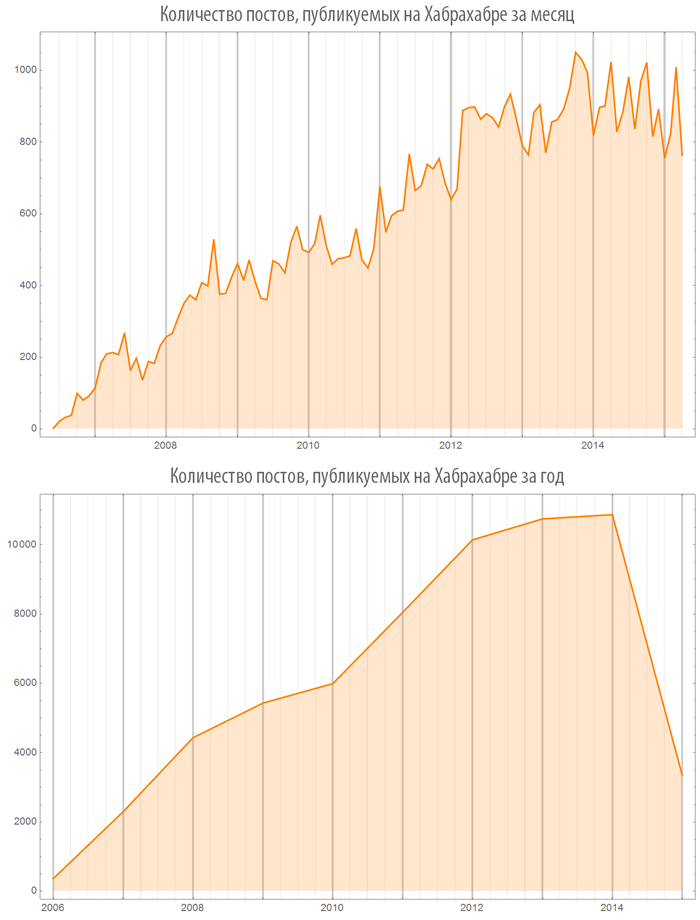
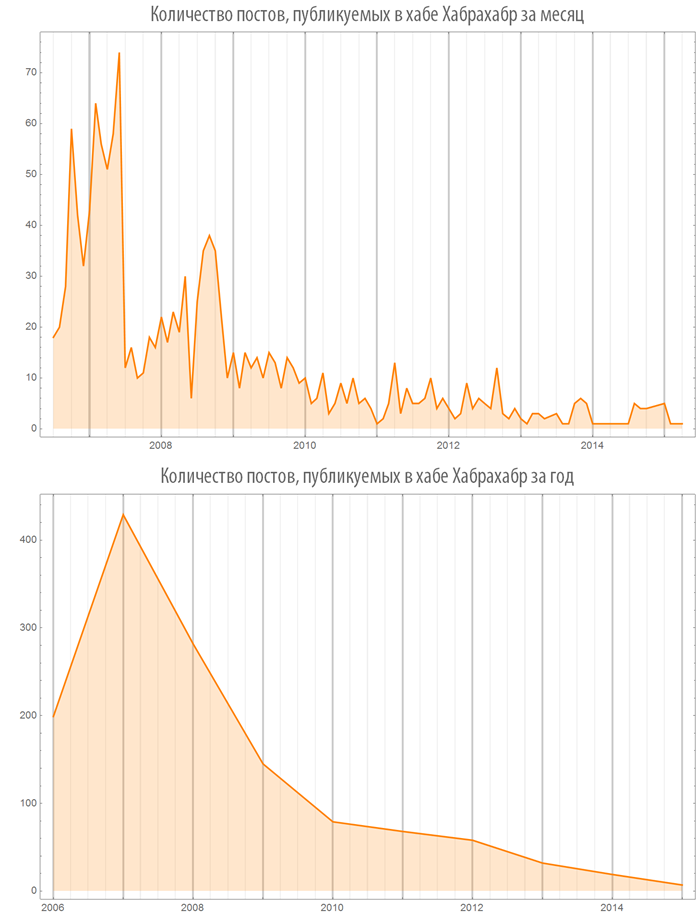
Number of articles depending on time
Let's create a function, visualizing the number of published articles both on the whole Habrahabr and in some hub:
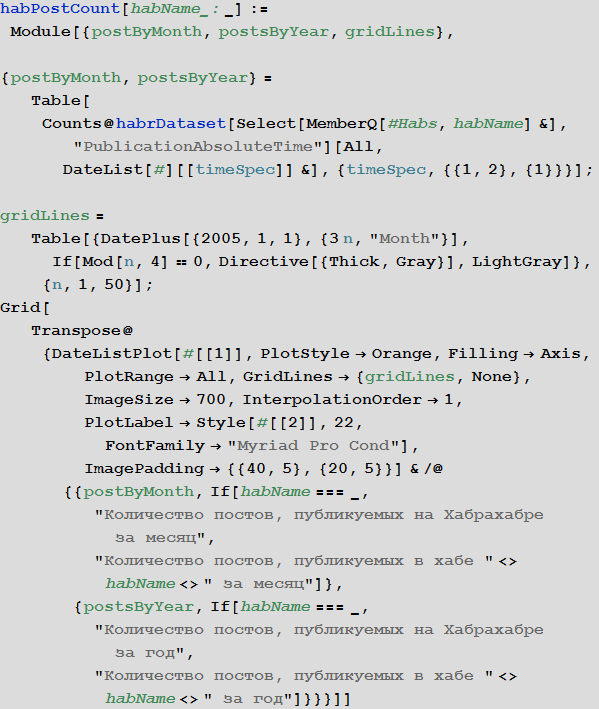
Let's look at the results of her work. From the obtained graphs it is clear that at the moment, apparently, there is a yield of the number of posts published per year on Habrahabr on a plateau, approaching the value of 11,000 posts per year.
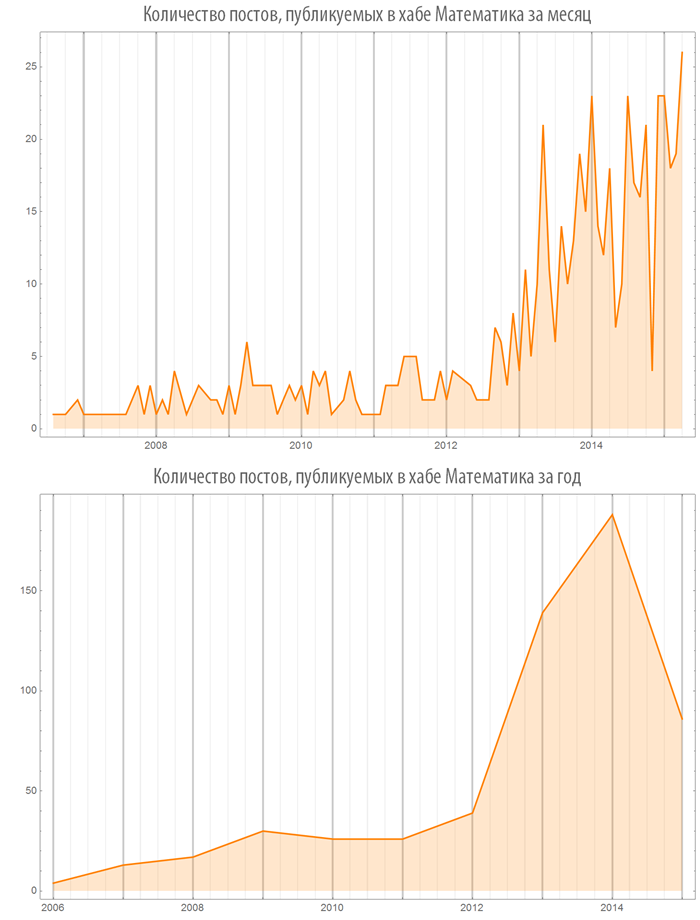
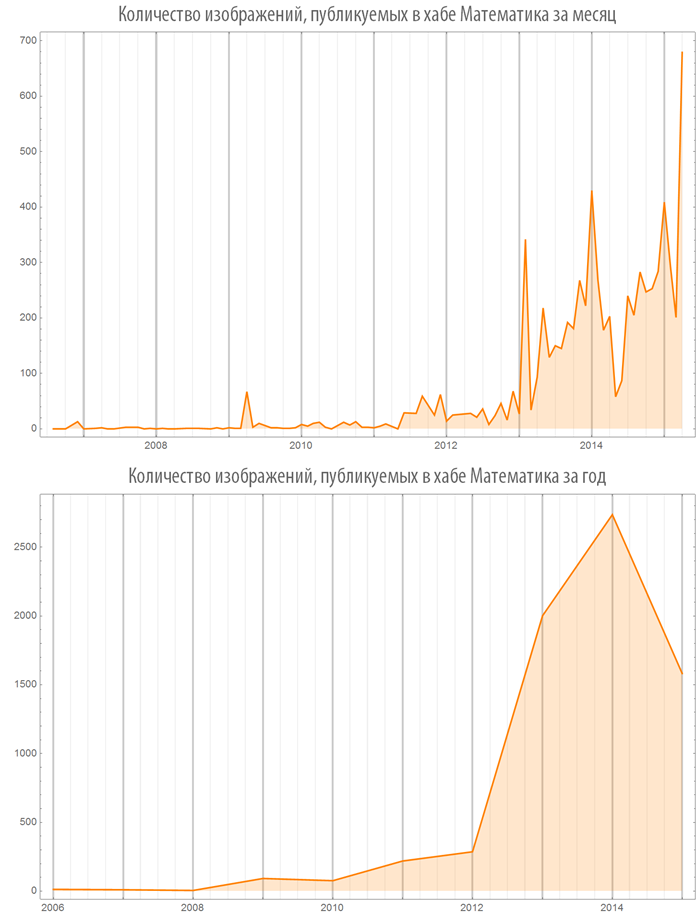
Since 2012, there has been a rapid increase in publications in the “Mathematics” hub:
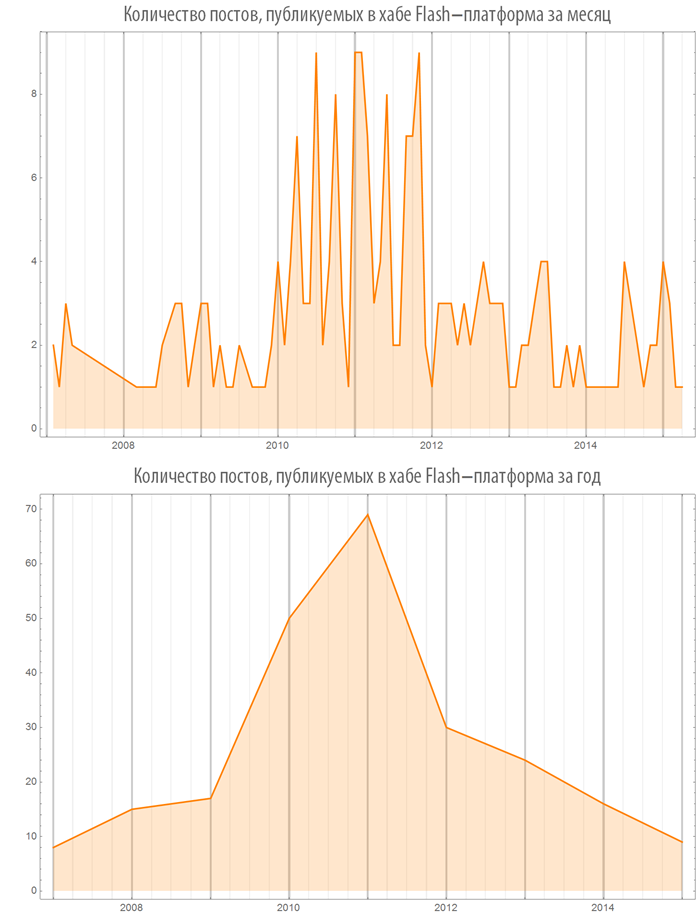
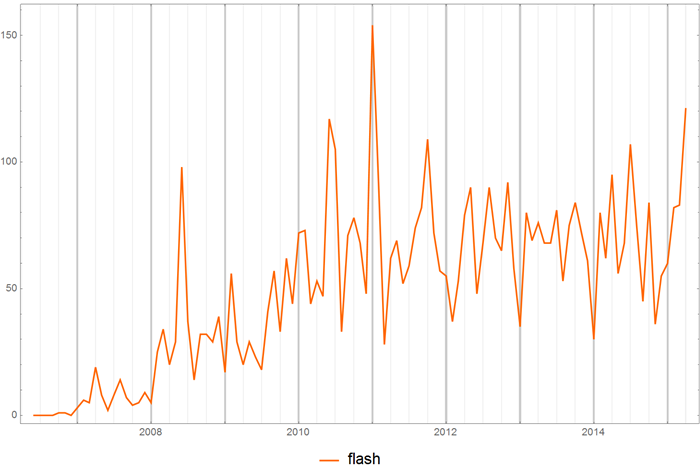
Since 2011, one can observe the attenuation of interest in Flash:
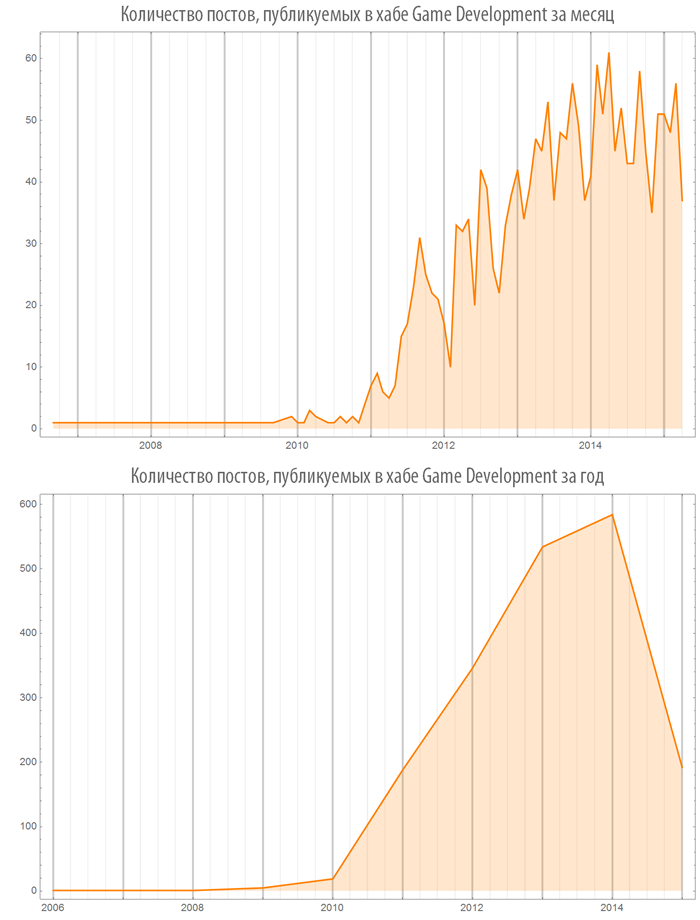
At the same time, since 2010, the hub “Game Development” is growing by leaps and bounds:
Interestingly, fewer articles go to the Habrahabr hub.
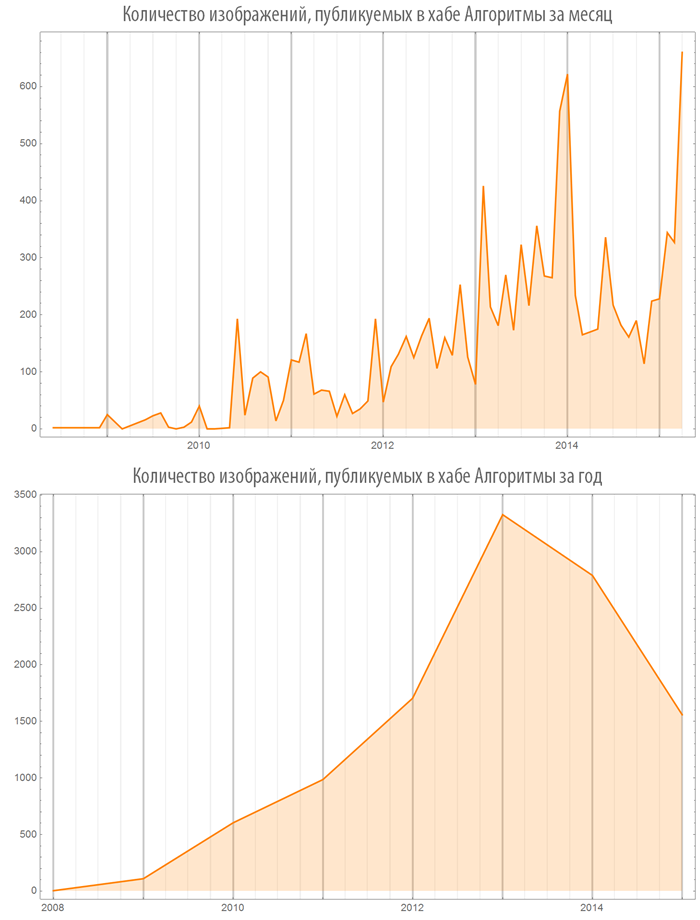
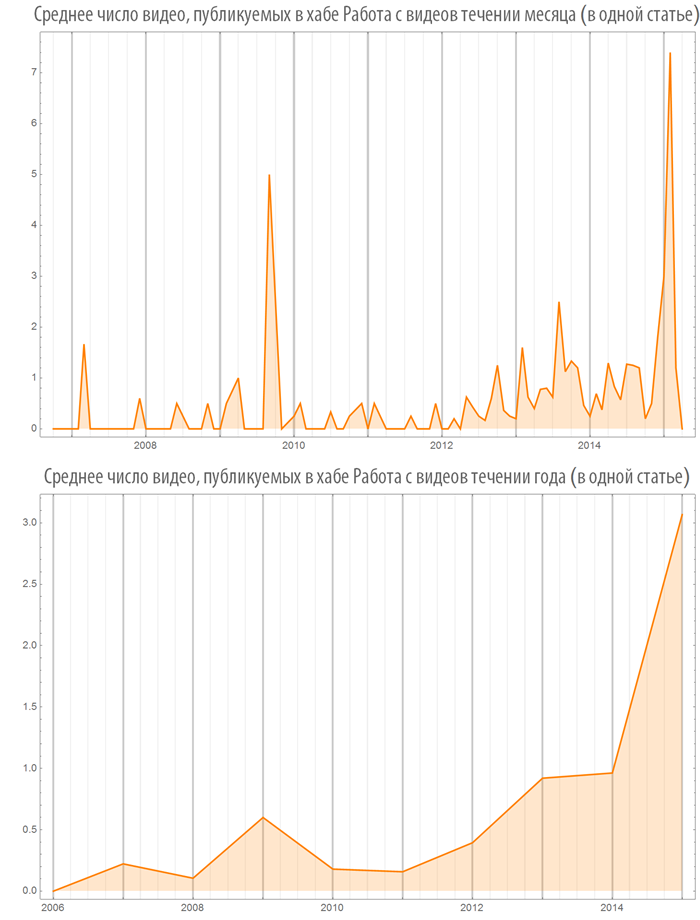
Number of images (video) used in posts depending on time
Let's create a function, visualizing the number of images (or videos) in published posts, both on the whole Habrahabr and in some hub:
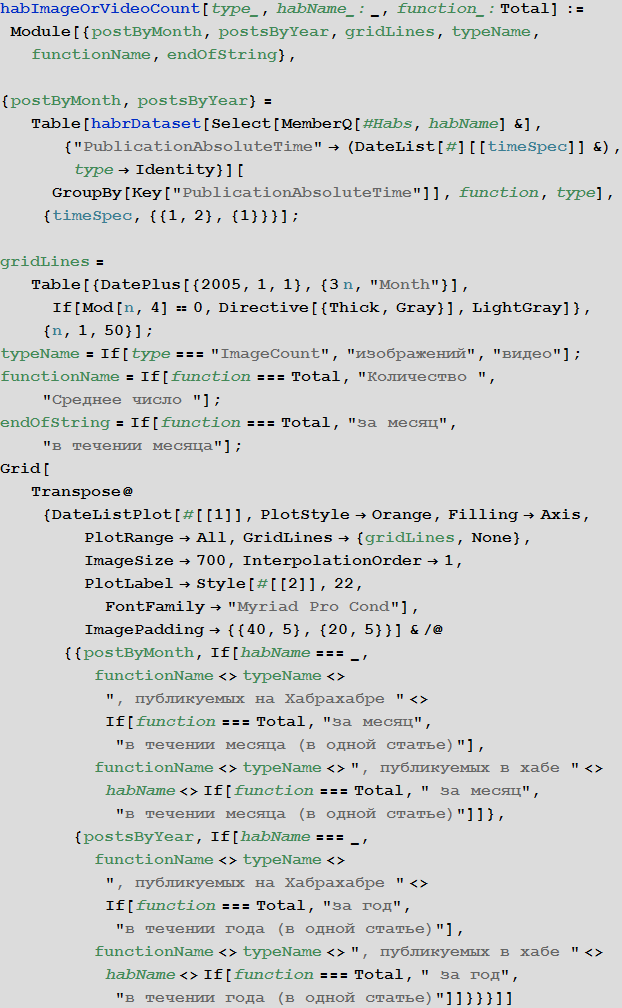
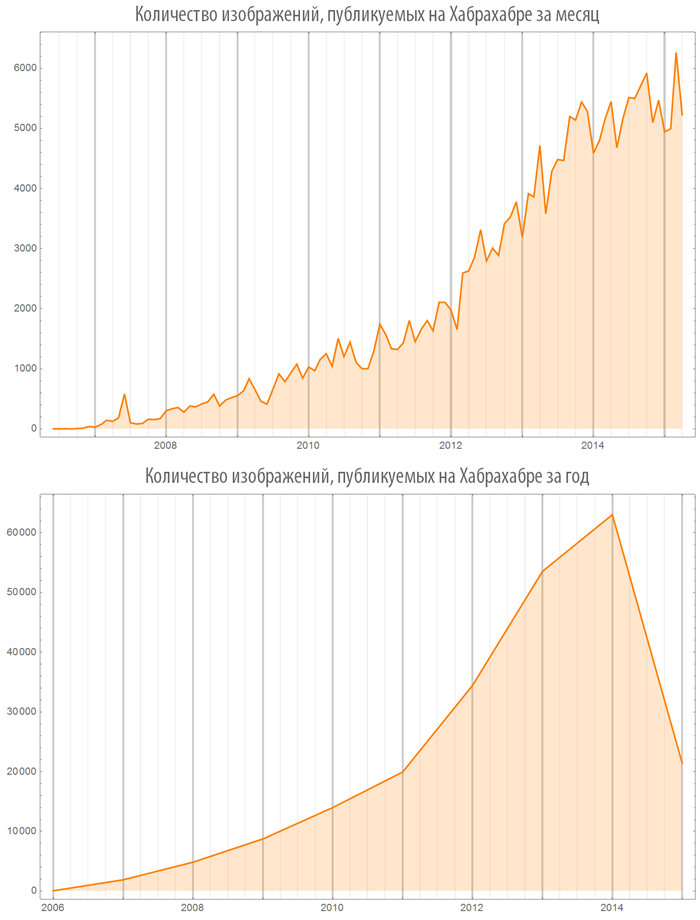
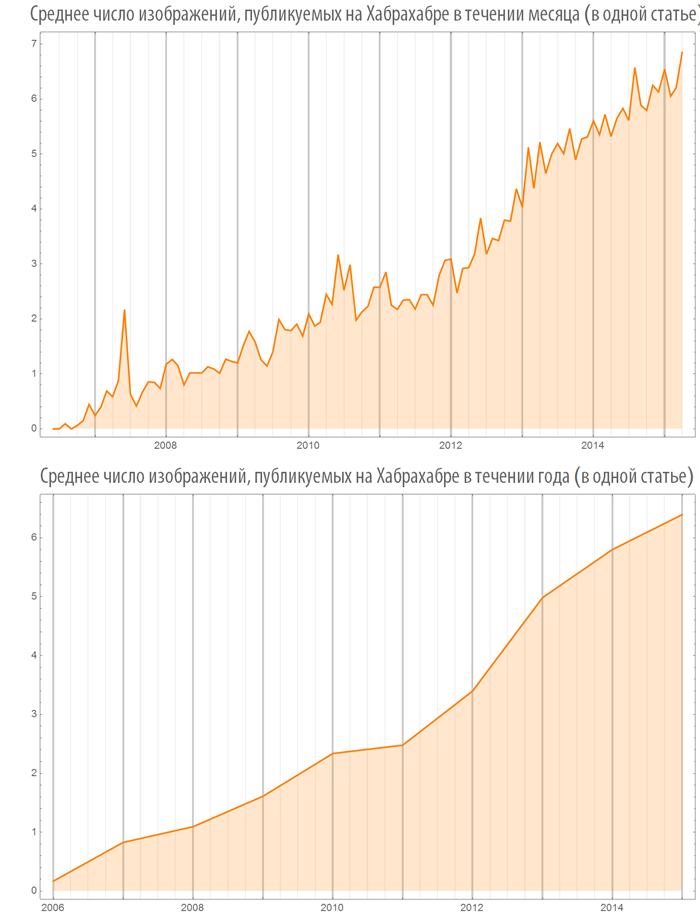
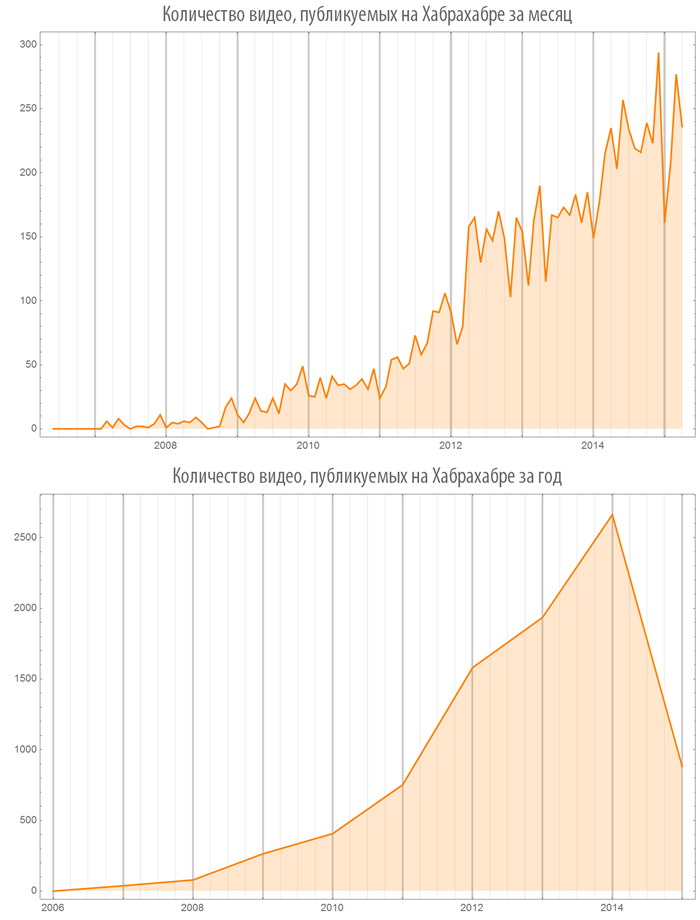
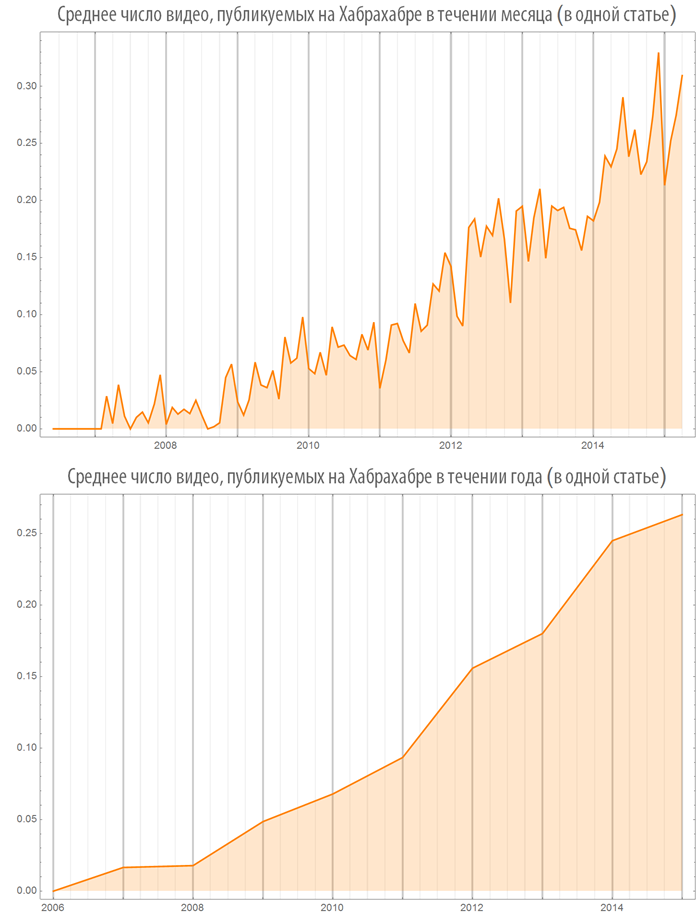
Let's look at some hubs:
Clouds of Habrahabr and individual hubs
Let's find a list of the number of used keywords among all analyzed posts on Habrahabr:
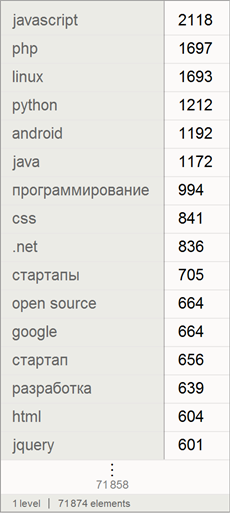
Choose the 150 most common among them:
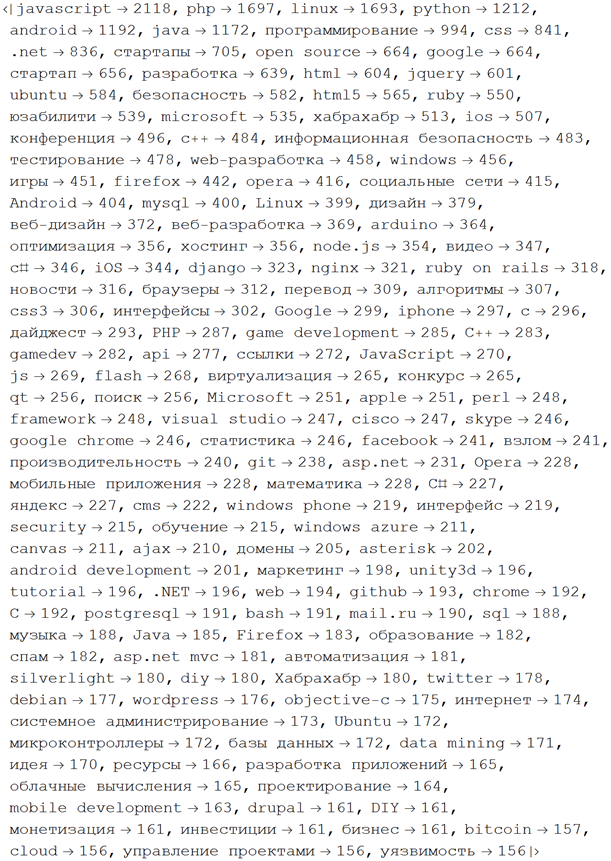
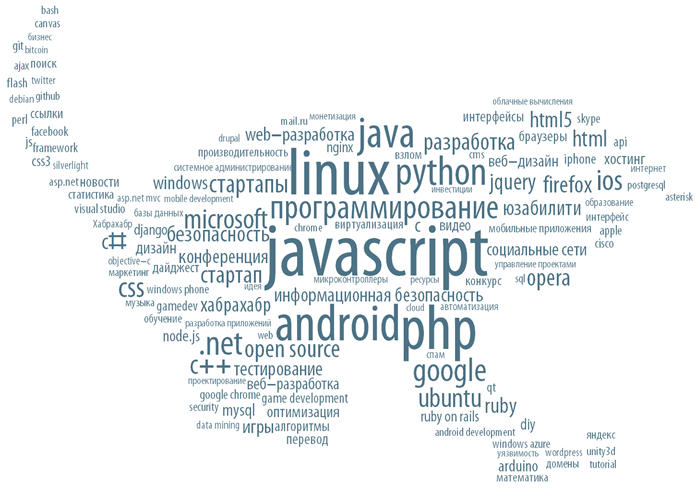
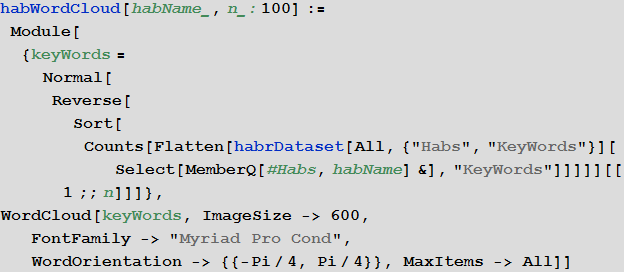
Create from them a word cloud in which the size of the word (or phrases) is directly proportional to the number of its instructions:
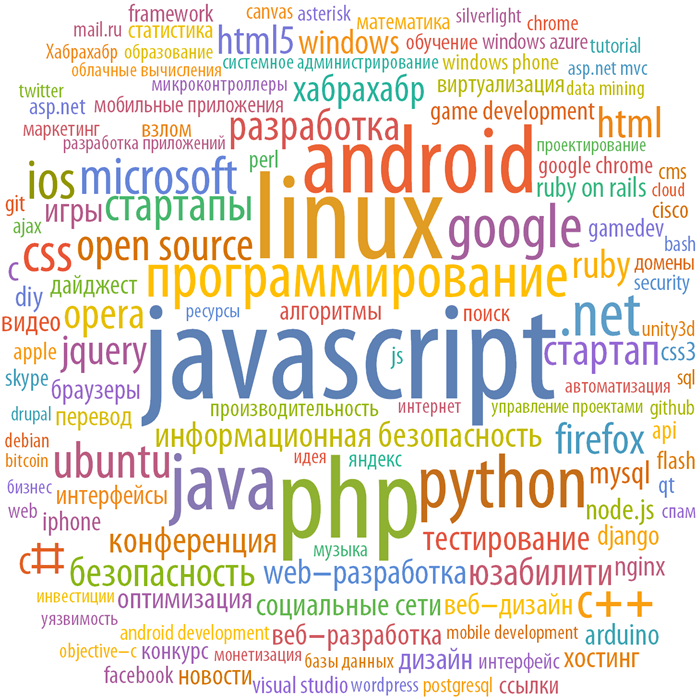
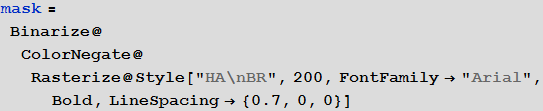
We can also create a mask from some string:

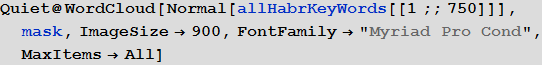
and make on its basis a word cloud containing already 750 of the most common keywords (phrases):

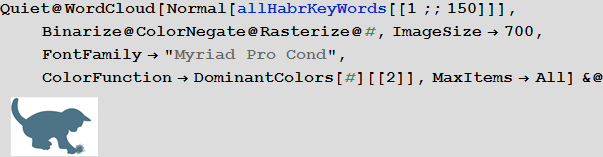
You can also make a word cloud in any form:
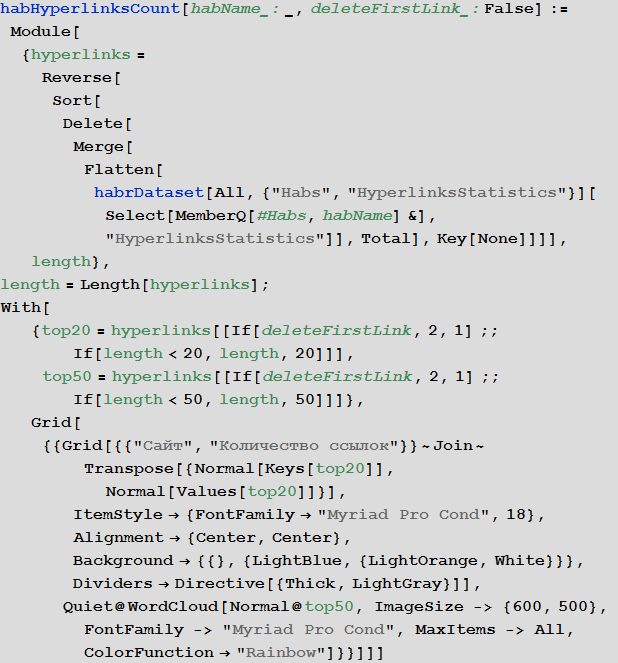
Now we will create a function that will visualize the clouds of the most popular keywords of a certain hub (100 words will be used by default):
100 keywords of the hub “Mathematics”:
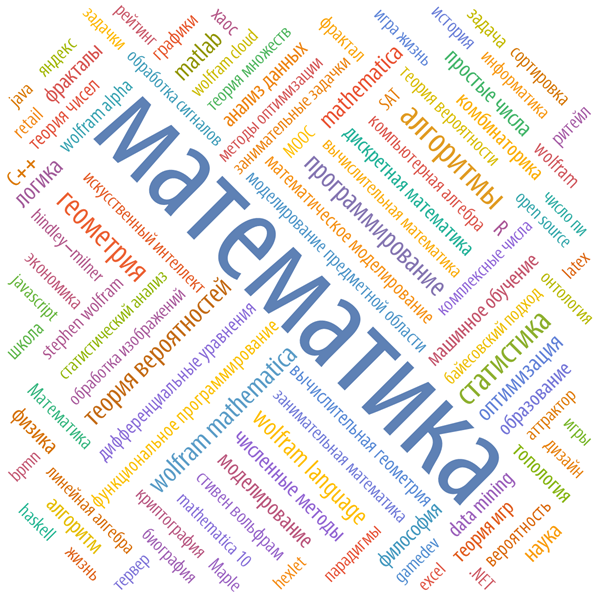
30 keywords hub "Mathematics":

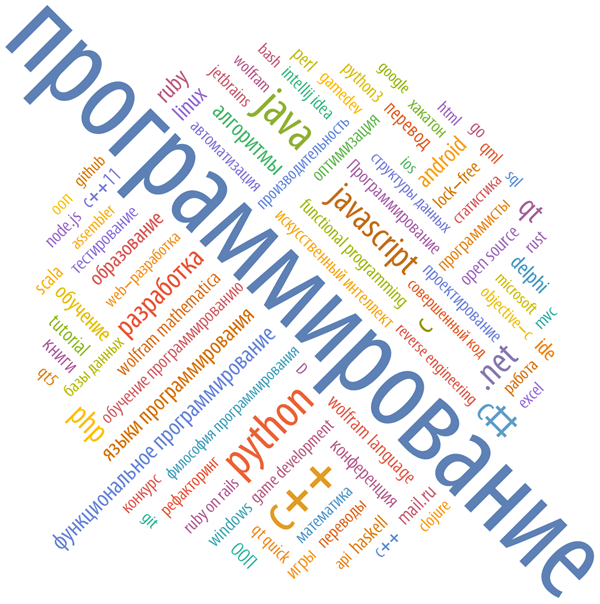
Key words of the hub “Programming”:
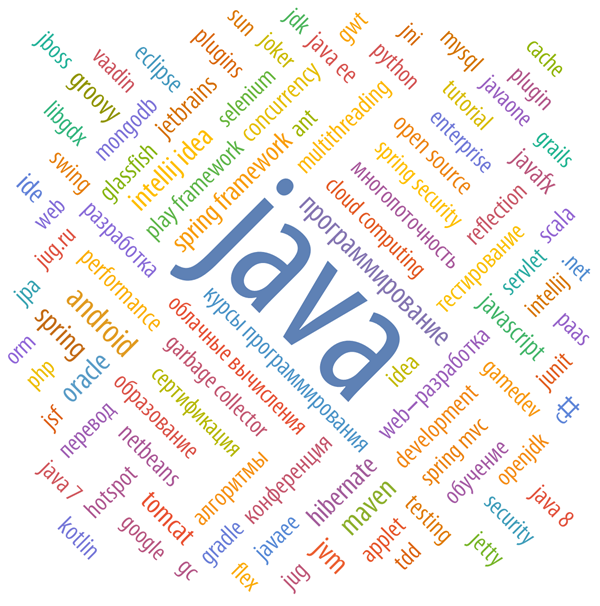
Keywords of the “JAVA” hub:
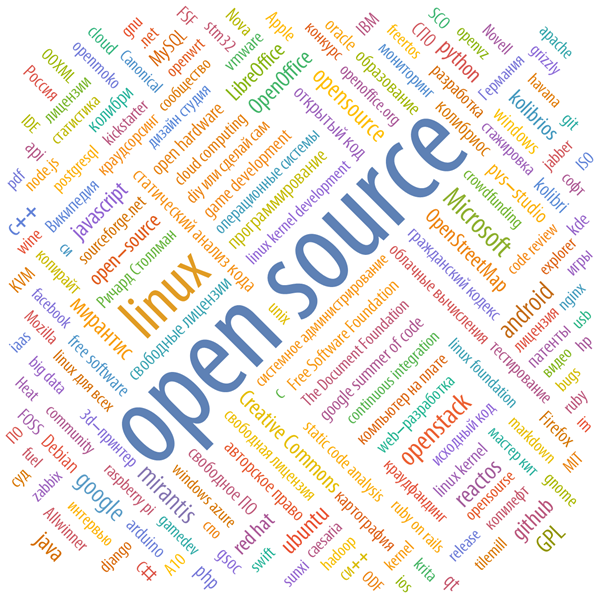
200 keywords of the “open source” hub:
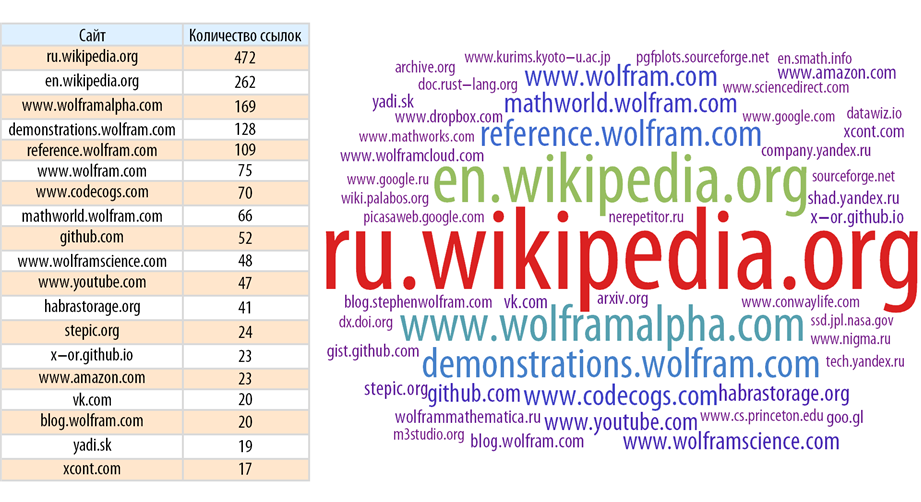
Sites referenced in articles on Habrahabr
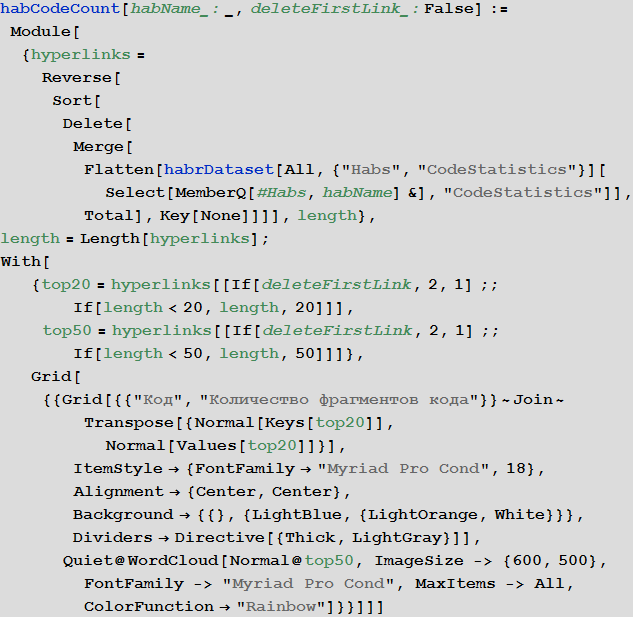
Let's create a function that will show the sites that are most often referred to as Habrahabr in general, and in some hub:
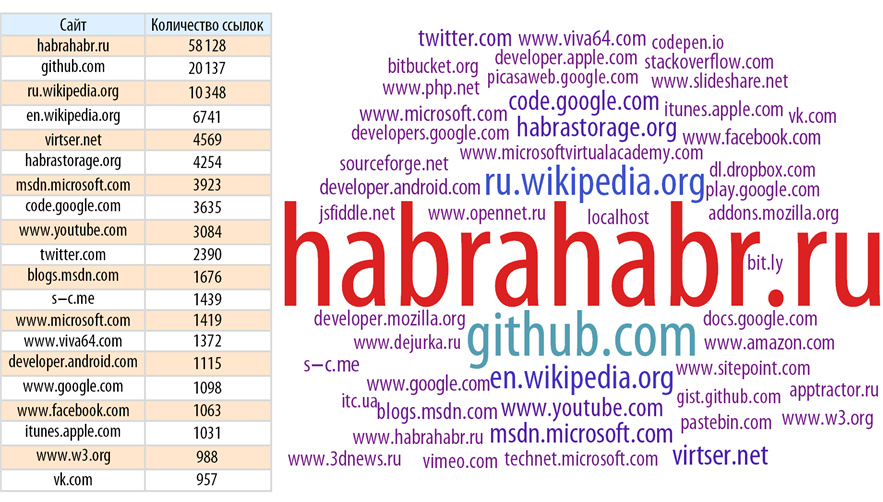
Let's find sites that are most often referred to in Habrahabr:
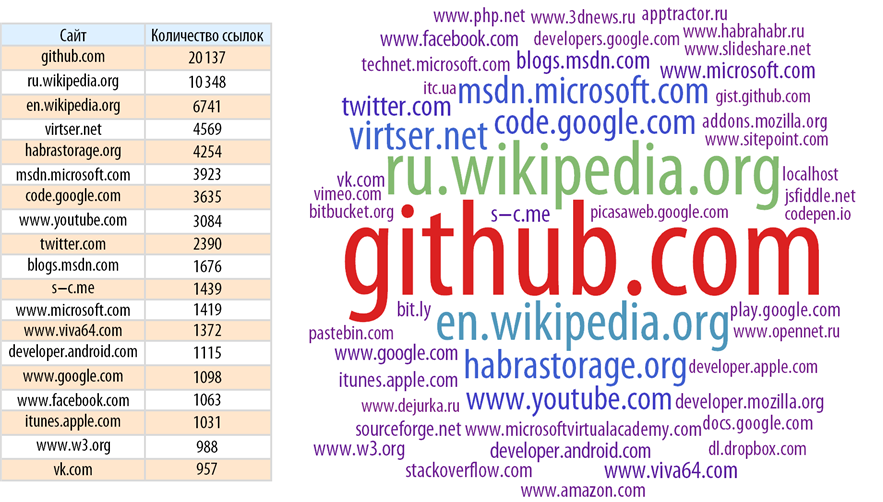
The picture becomes clearer if you remove the main source of links - Habrahabr himself.
Let's find sites that are most often referenced in the “Mathematics” hub (at the same time, we will delete Habrahabr himself everywhere, since he is referred to everywhere, which is obvious, most often):
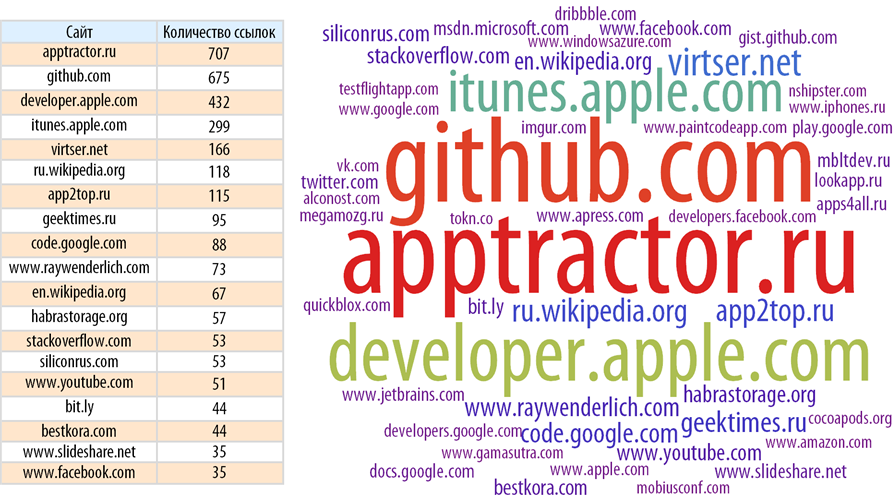
Now let's look at, say, the “iOS Development” hub:
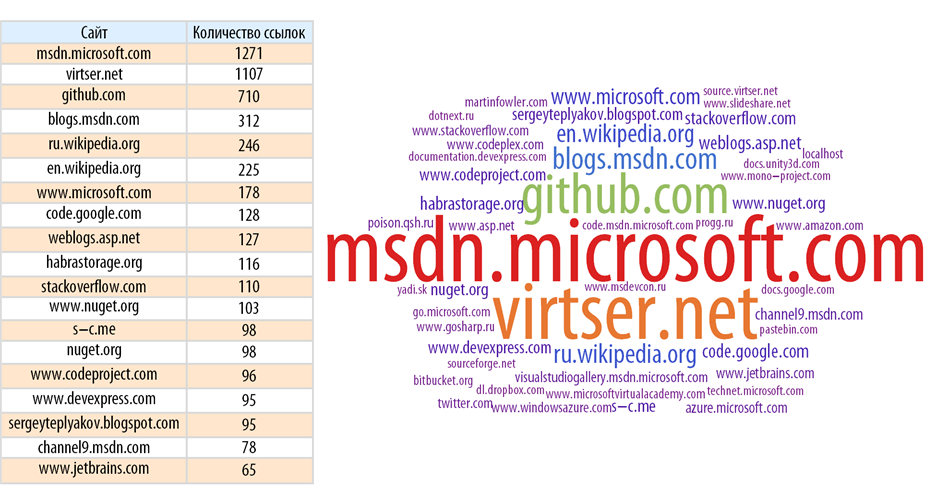
And here is the .NET hub:
Codes that lead in articles on Habrahabr
Let us find the share of articles in which there are no code inserts (a serious error is possible here, since the code is not always inserted by the authors with the help of a special tag - for example, in this post it is inserted as images).
Let's create a function that will show the statistics of language insertions of code in posts, both on the Habrahabr in general, and in some hub. In this case, if the author does not specify the code, then such a fragment will be marked with the name “SomeCode”. Also, here we do not process the names of the languages indicated by the authors.
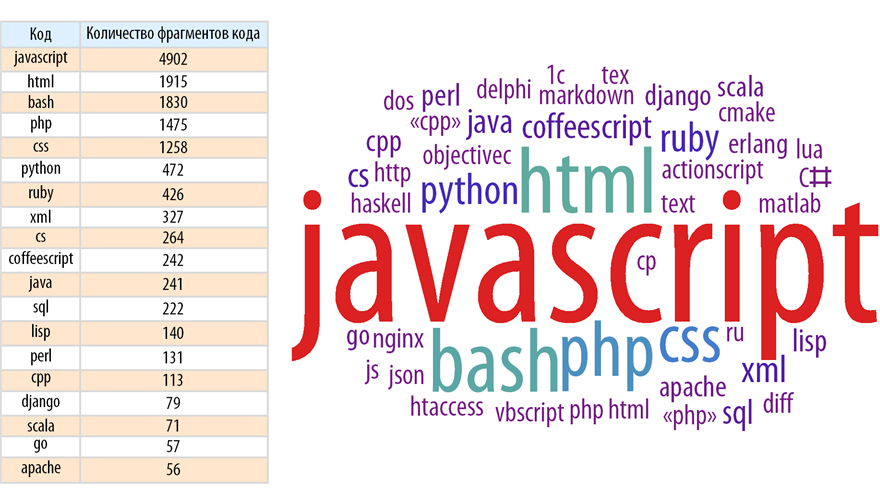
Let's find the distribution of code insertion languages for the whole Habrahabr:
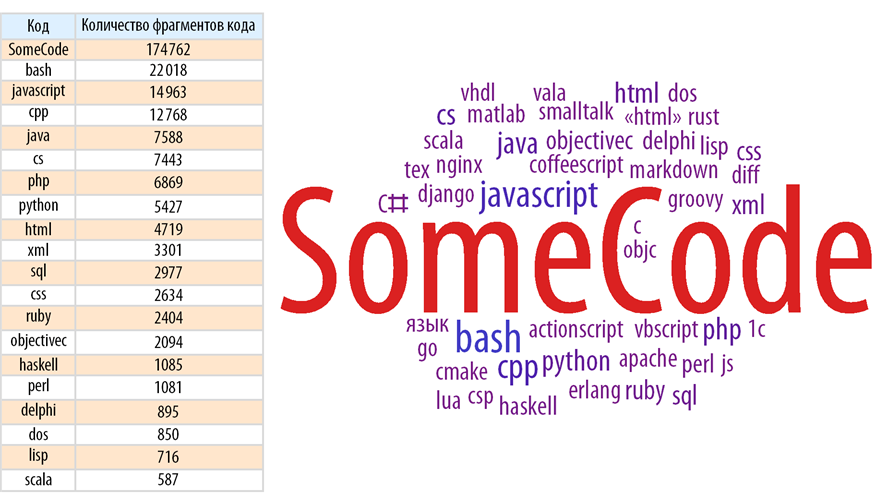
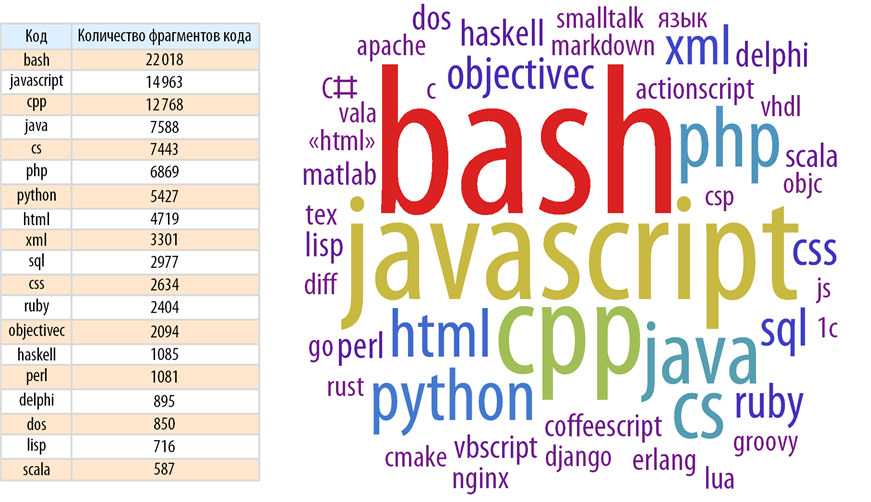
The picture will become clearer if you remove inserts that have no programming language specified:
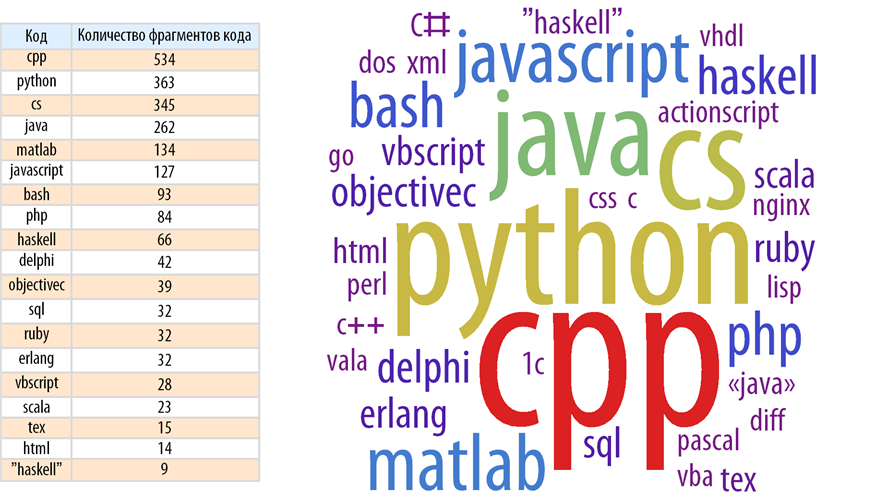
Now let's take a look at the most popular programming languages of code inserts in the “Algorithms” hub:
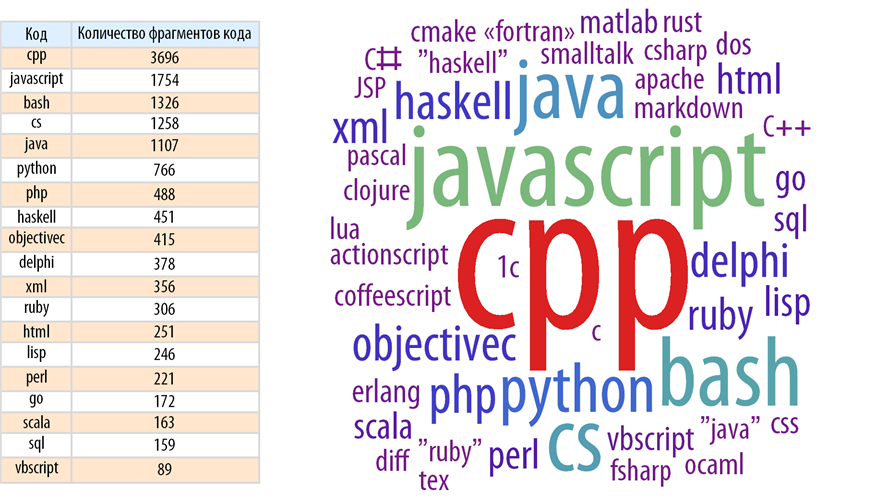
The “Programming” hub:
Hub “Web Development”:
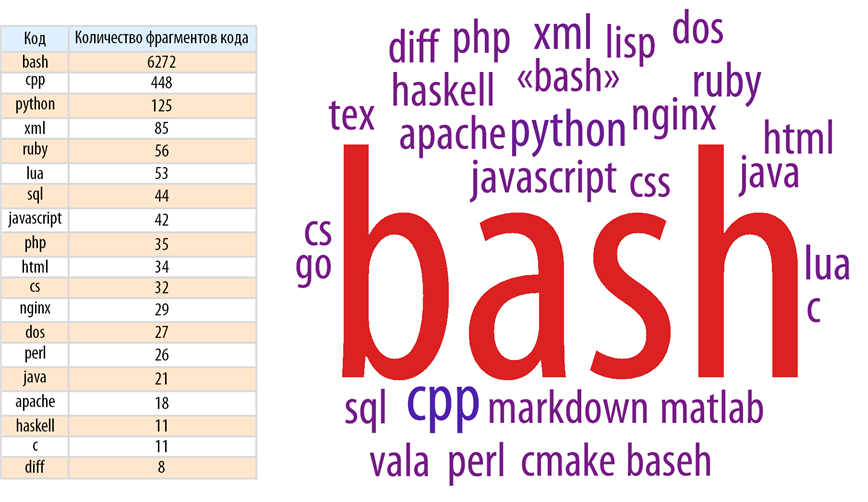
Hub “Configure Linux”:
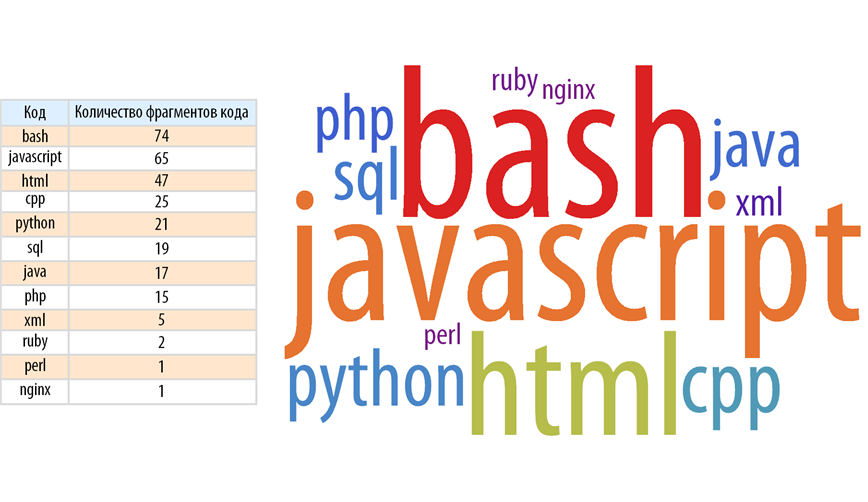
Hub “Search engines and technologies”:
Word frequency
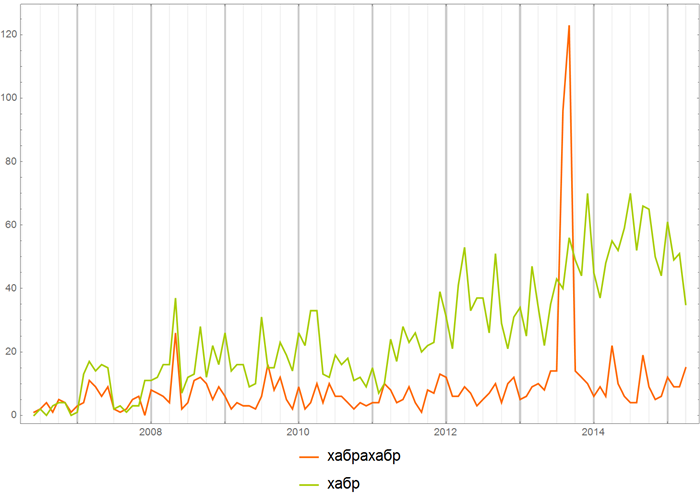
The Yandex “ Word Matching ” service is very useful if you want to write, say, an article that will be interesting to a wide audience. This service allows you to see the frequency of word searches. On the basis of the loaded information about Habrahabr articles, you can make a certain analogue of this service, issuing the frequency of meeting words (their groups or regular expressions) in the text of articles. This allows you to trace the interest of the audience to a particular topic.
So, we will create a function that will produce this kind of frequency of words:
Now you can see different things, for example, you can compare which resource name “Habrahabr” or “Habr” is most often used in Habrahabr:
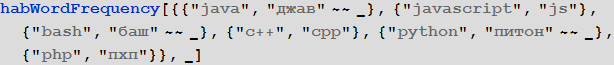
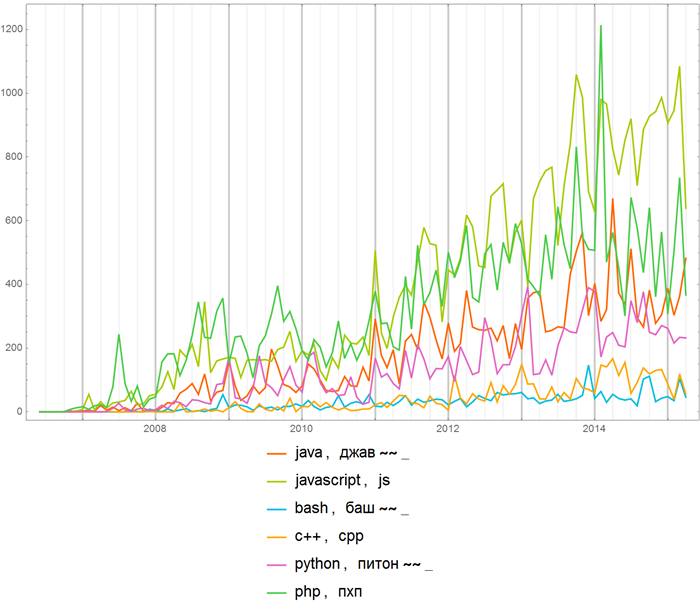
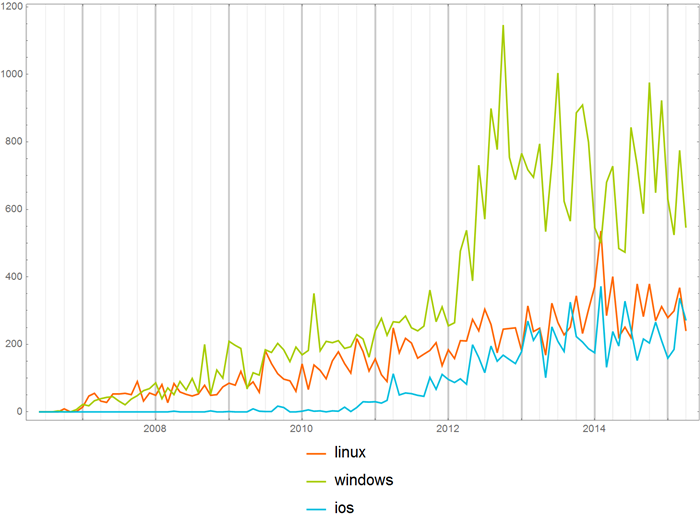
Or you can compare the frequency of using the names of various programming languages everywhere on Habrahab:
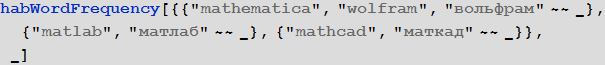
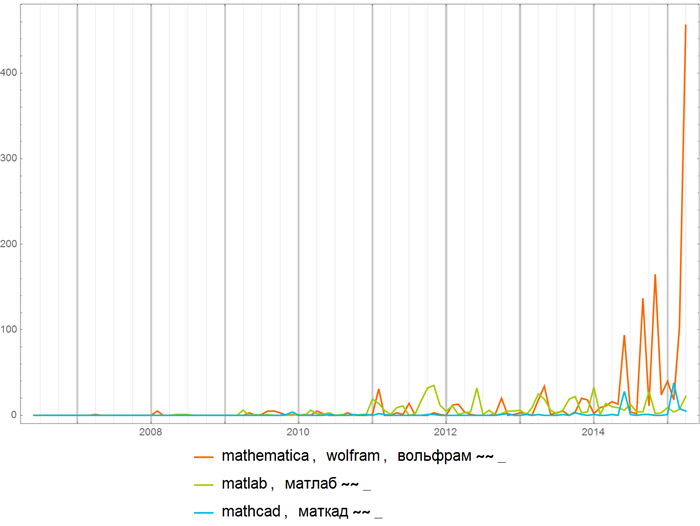
Comparing the frequency of mentions of mathematical packages (expressions like “string” ~~ _ (they were used in the previous example) allow you to specify collections of strings with different endings, say, the expression “tungsten” ~~ _ will set the collection of strings “tungsten”, “Tungsten”, etc.):
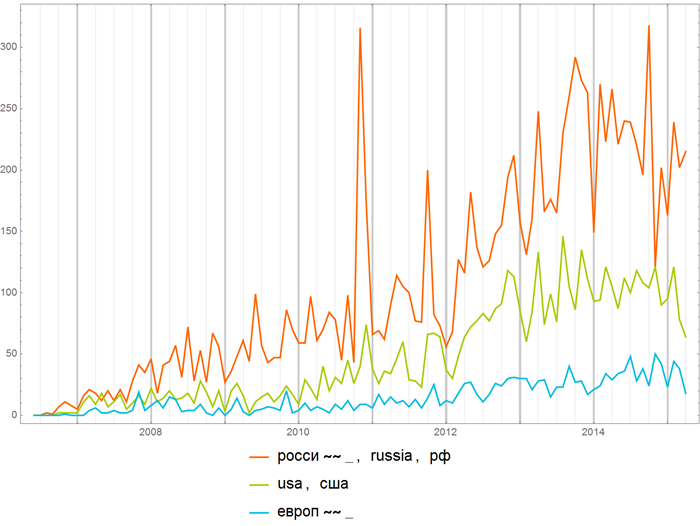
You can, of course, be interested in different things, for example, to find out the frequency of meetings of the words “Russia”, “USA” and “Europe”:
Or you can observe a gradual extinction (freezing) of interest in some technology:
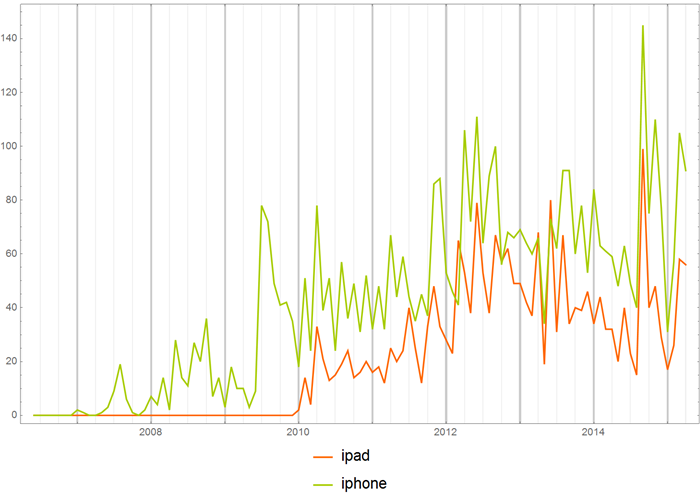
Or the birth of a new:
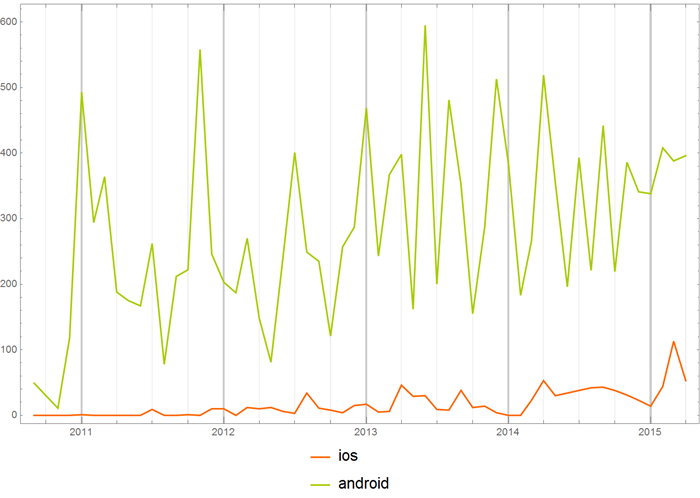
You can also look at the frequency of use of words in individual hubs. Say, the frequency of use of the words “iOS” and “Android” in the hub “Development for iOS”.
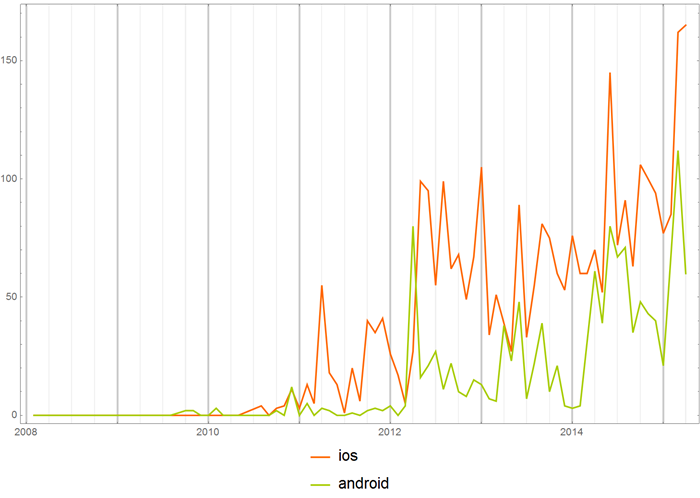
Or the same words, but in the hub “Development for Android”.
You can compare the frequency of using operating system names in the “Open source” hub:
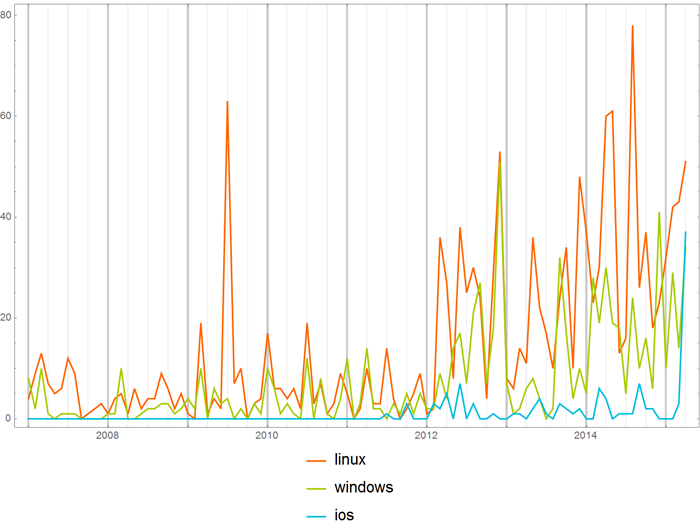
with Habrahabrom in general:
Rating and number of views of posts, as well as the probability of reaching their specific values
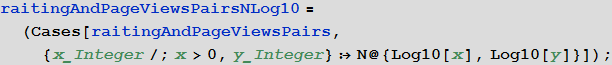
Select pairs of post rating + number of post views:
We construct their distribution on the plane in the usual and logarithmic scales:
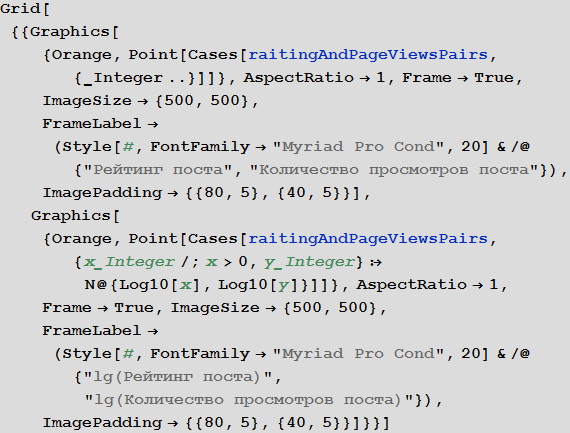
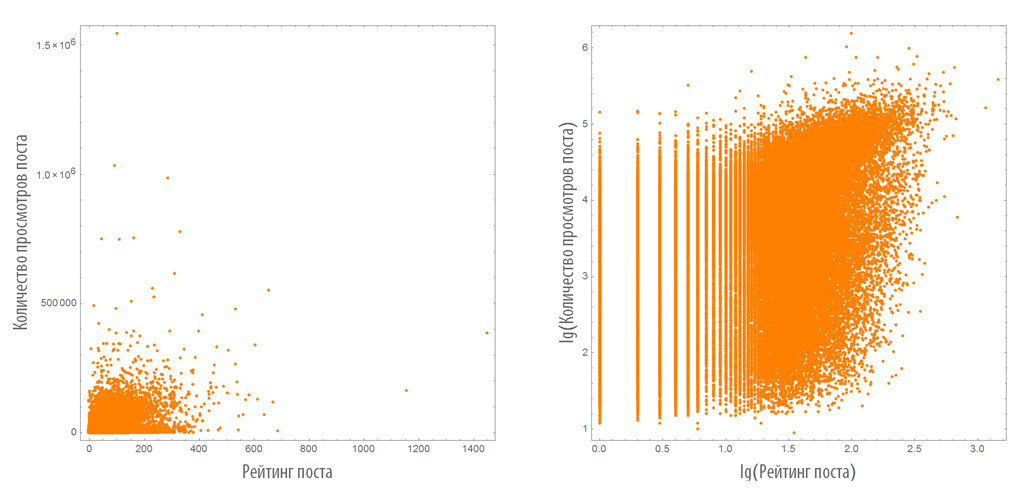
The disadvantage of these graphs is that they do not reflect the density distribution of points on them.
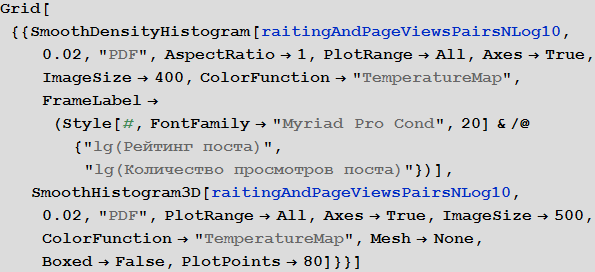
Construct a two-dimensional and three-dimensional distribution density of the considered pairs:
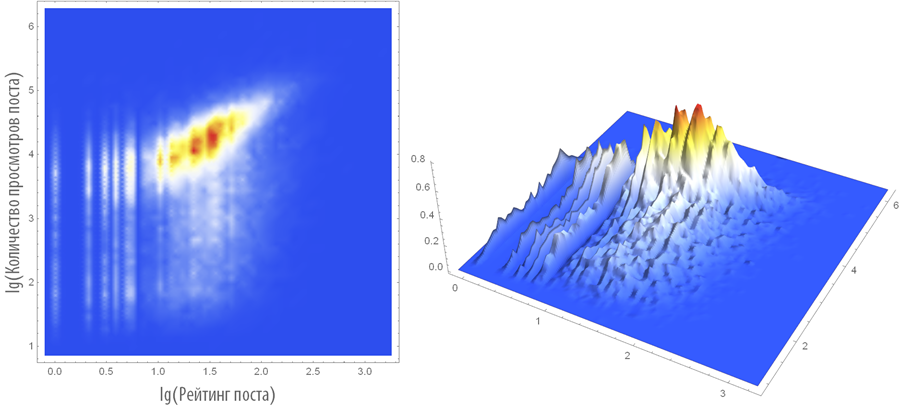
The average post rating on Habrahabr is 34.5, and the average number of views is 14237.3
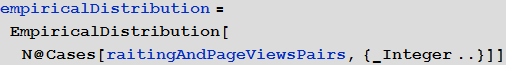
However, this is not a statistical characteristic. Construct the distribution of pairs (create a distribution of a two-dimensional random variable):

Find the expectation:
As well as the standard deviation:
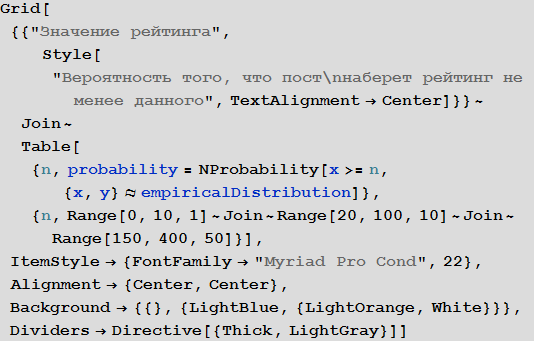
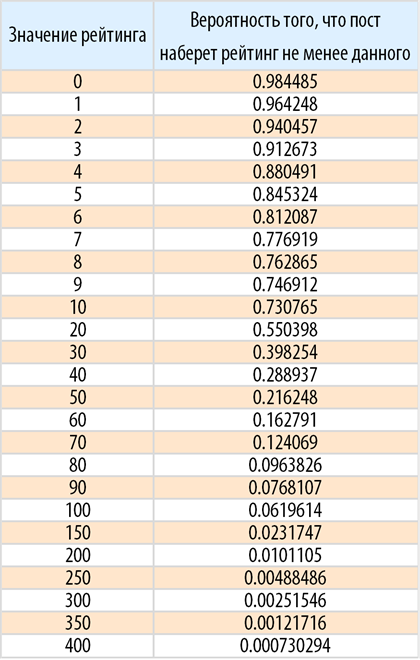
You can also find the probability, for example, that the post will score a certain rating:
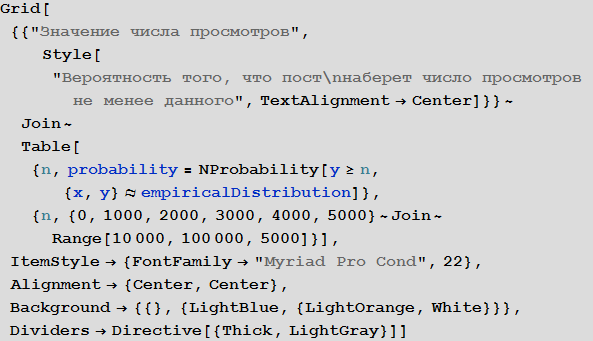
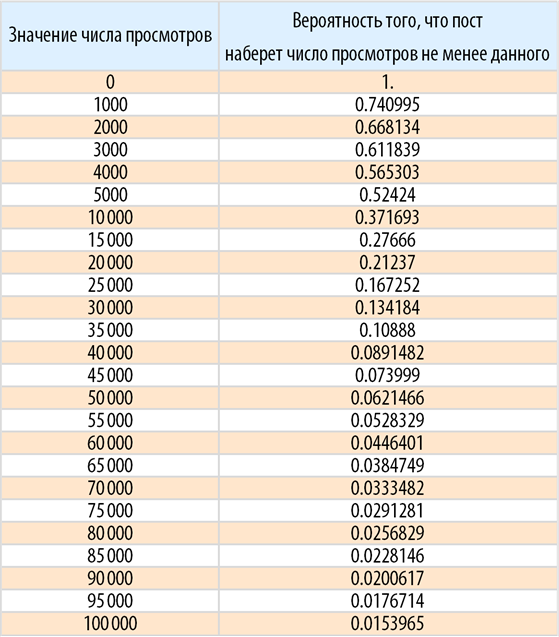
Now we find the probability that the post will gain a certain number of views:
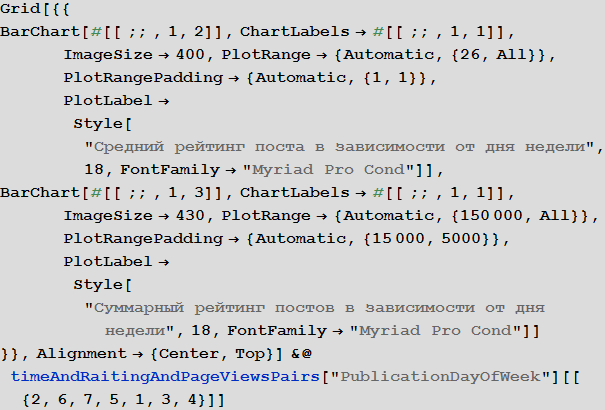
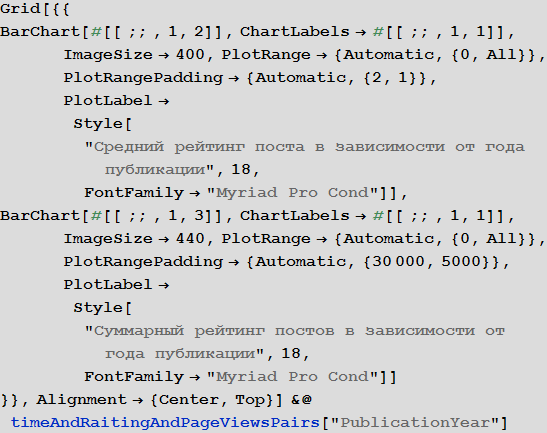
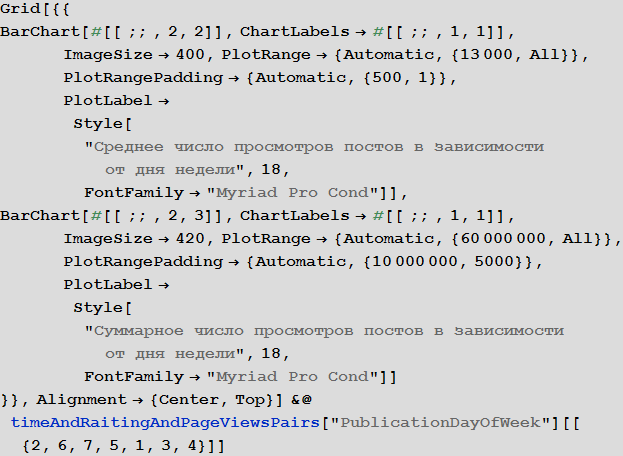
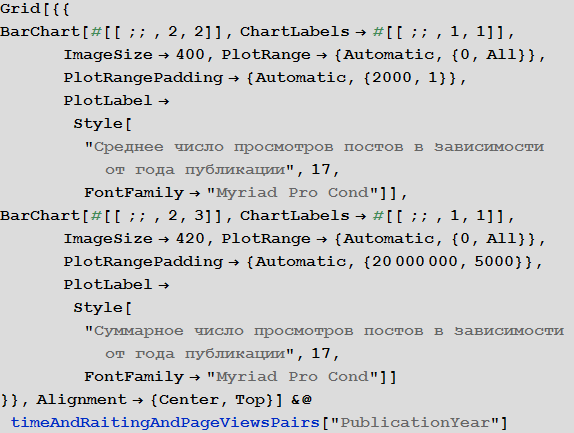
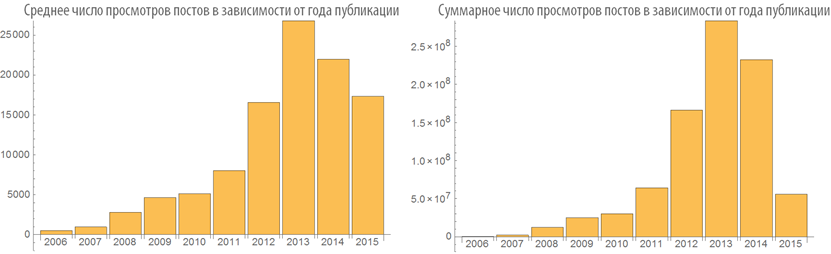
The dependence of the rating and the number of post views from the time of publication
From the code below it can be seen that for all the time on Habré all the articles scored a total rating of about 2.1 million, and the total number of their views is close to 1 billion:
Let's highlight the triples post publication time + post rating + number of post views:
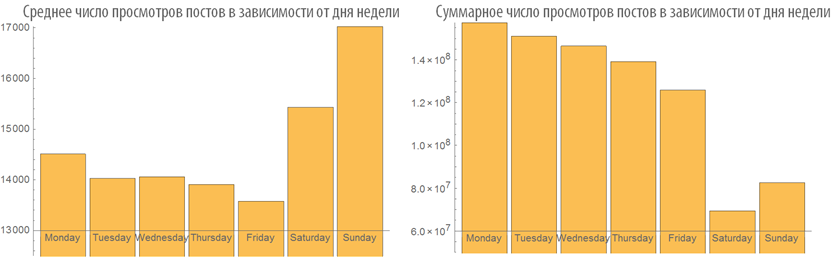
Let us study the behavior of the ranking of posts depending on the time of publication:
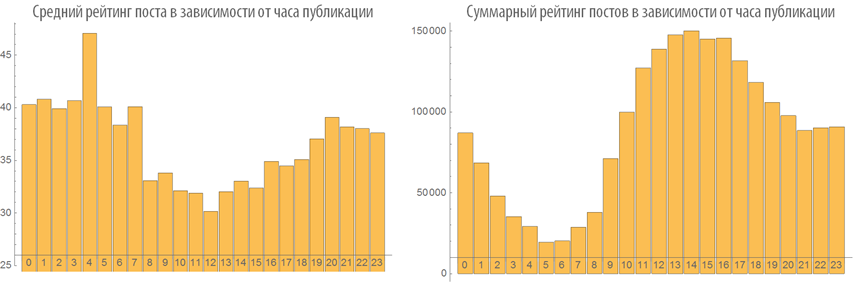
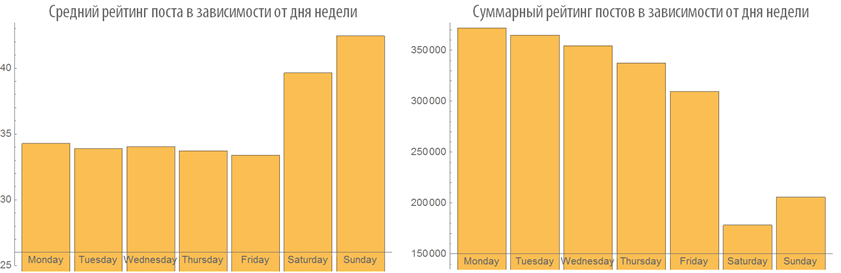
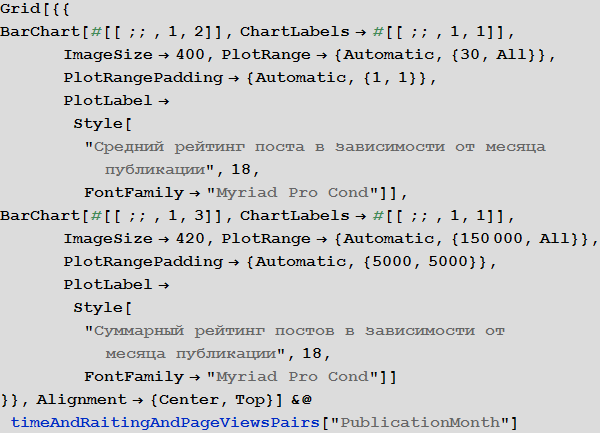
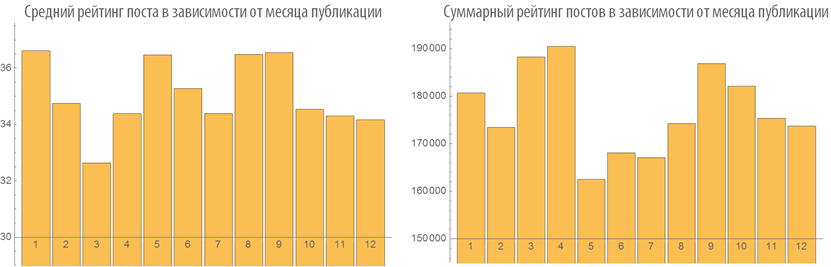
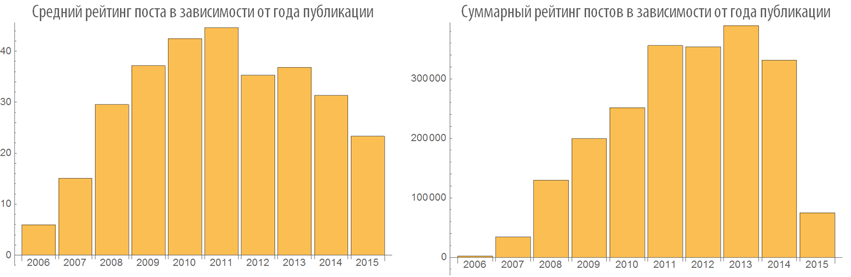
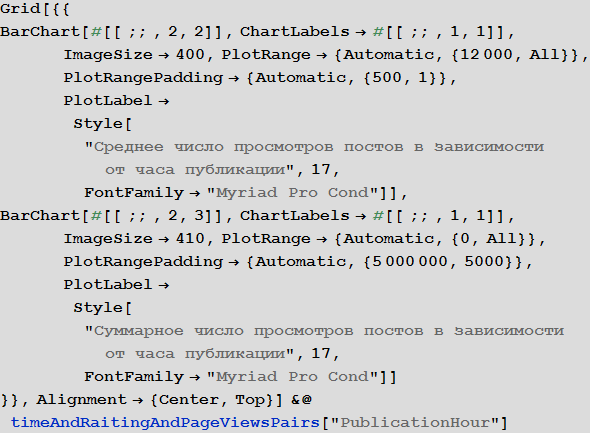
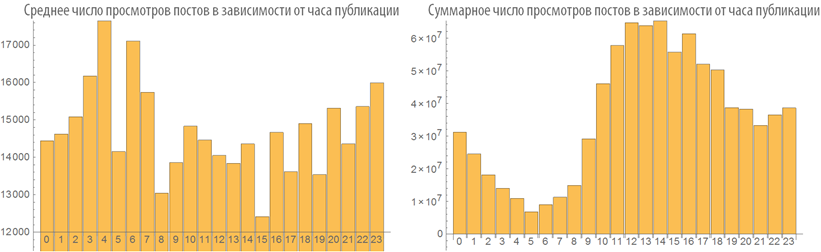
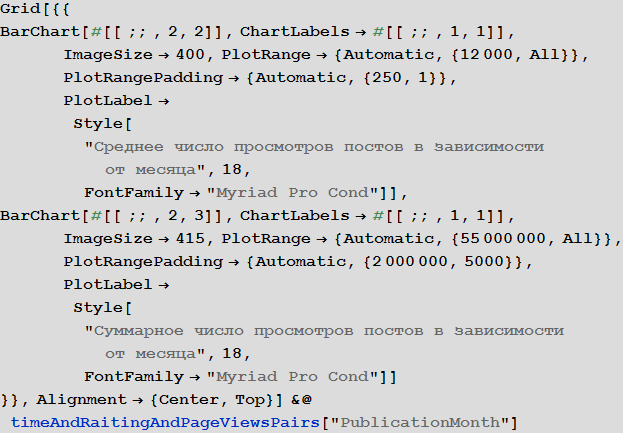
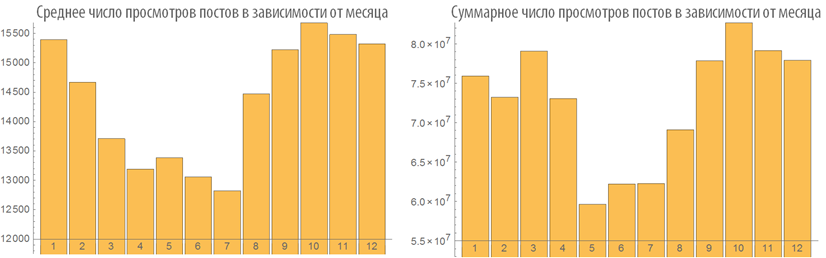
Examine the number of views of posts depending on the time of publication:
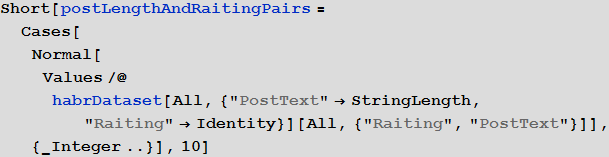
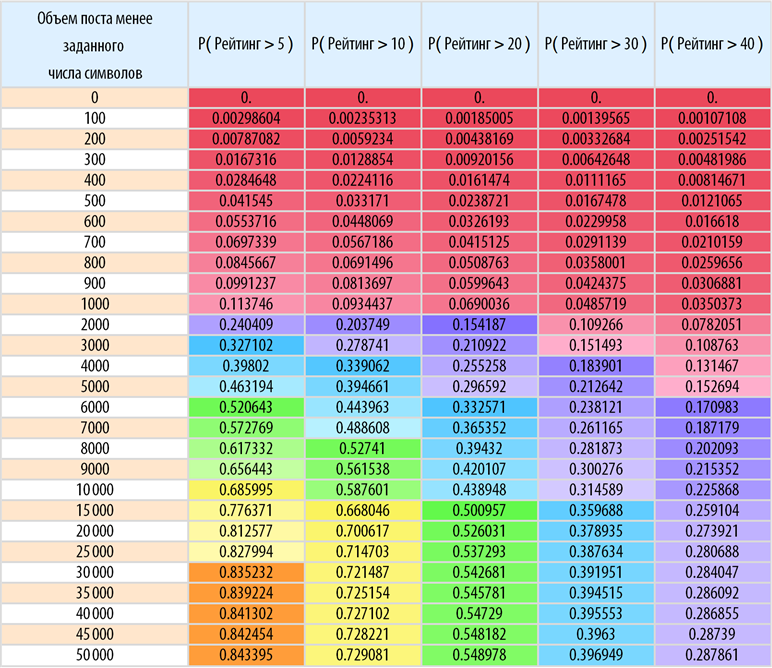
Dependence rating post from its volume
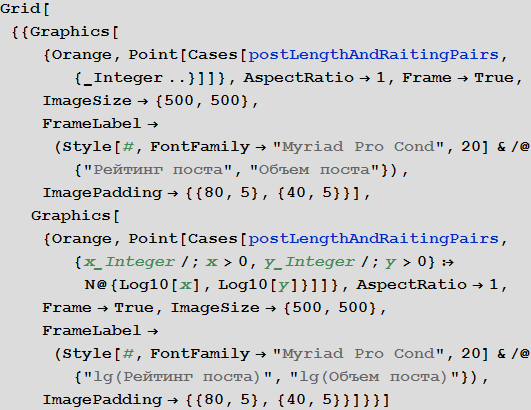
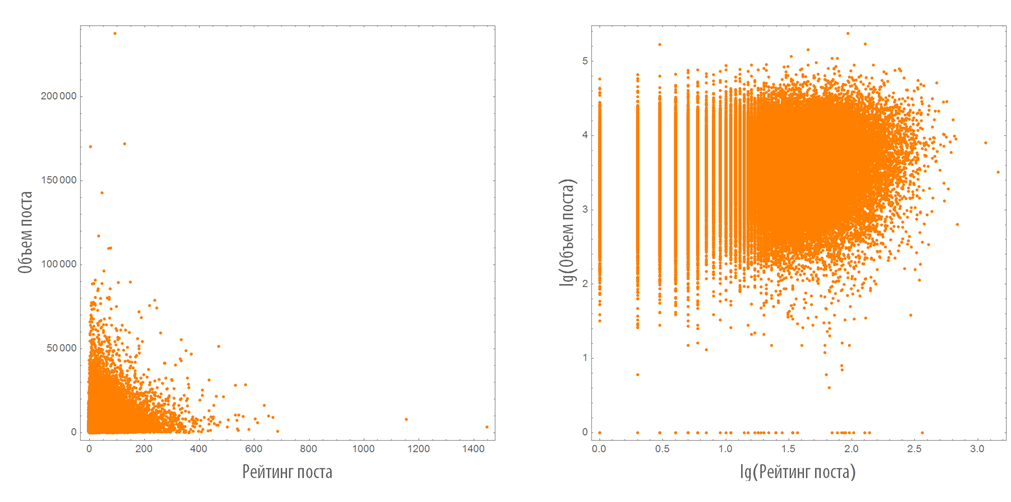
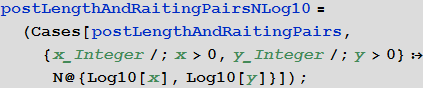
Select the pairs of the type of post length + post rating (length of the post - we will call it further the volume of the post - calculated as the total number of characters in the post):
We construct their distribution on the plane in the usual and logarithmic scales:
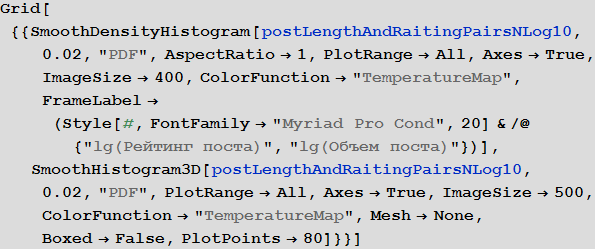
Construct a two-dimensional and three-dimensional distribution density of the considered pairs:
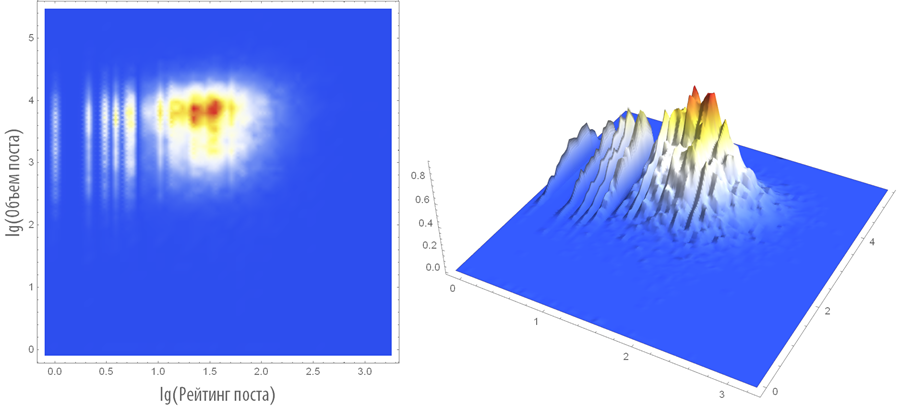
The average volume of a post on Habrahabr is 5989 characters.
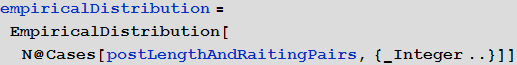
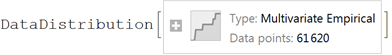
As before, we will construct the distribution of the pairs under consideration (we will create the distribution of a two-dimensional random variable):
Find the probability that a post with a volume not exceeding a specified number of characters will gain a rating of at least the specified:
Conclusion
I hope that this analysis could interest you and will also be useful to you. Of course, on the basis of the resulting database, you can still conduct a lot of various studies, say, to answer such questions: will this post be popular (prediction of the level of popularity)? What affects the number of comments? How to find the best topic for the post? and much more. But these are topics for future posts.
Update from 3:21 April 30 : thanks to the attention of Power , the calculated values associated with the rating of posts have been adjusted. Compared to the previously calculated values, the differences were quite insignificant. However, the integrity of the entire chain of algorithms was restored by eliminating the bug in the extractData ["Raiting"] function.
Source: https://habr.com/ru/post/256999/
All Articles