How to fasten a tracing from the browser to any project
Hello!
My name is Kostya, I am developing a Yandex Browser. Recently, we had a small C ++ party in our Novosibirsk office in Akademgorodok, where I talked about what tools we use to develop a browser and what can be borrowed for other large projects, for example, ninja , OWNERS . During development, we are very closely monitoring performance: CPU utilization, memory consumption, execution time for various operations, and so on. At the same time various utilities are actively used, but also internal browser debugging tools, for example, the internal browser: // tracing page (for Yandex Browser, chrome: // tracing for Chromium and Chrome).
In short, on this page you can trace the duration of the execution of various functions and the number of calls broken down by processes, threads and passed arguments. Of course, there is no magic in it, and in order for this to work, you need to place special macros on the code. As it seems to me, this is a very handy tool that allows you to find a bunch of different problems. I believe that such a tool can be useful in other projects, so I decided to show how to use it.
Of course, in order to track projects there are a variety of tools, but they all have a huge minus - they cannot be used by a specific user, although this can be very important for understanding and diagnosing a problem. Diagnostics that the browser collects on the browser: // tracing can be collected at any time. It can be included only for a certain period in order to repeat the bug, and in other moments it does not bring a big overhead projector.
First of all, of course, source codes will be needed. By and large, what we need is located in the base / trace_event folder inside it, including other components from the base subfolder, for example, time, threading, synchronization, etc. I decided to do very simply and simply link with base.dll from the chromium assembly. Fortunately, I have a chromium repository even on a home computer, not to mention the workers. For those who want to go the same way, there are links to instructions for building for different platforms. Important: for component assembly you need to set the environment variable GYP_DEFINES = "component = shared_library" .
Secondly, we need header files that can be taken here .
Alternatively, instead of these two points, you can make it easier and add files from the base to your project.
First we need to turn on the tracing. To do this, you need to create a category filter that we want to apply. A category is an identifier for a group of a tracked operation. Categories are needed to select which groups we want to track at the moment. Then you need to call the SetEnabled method on the singleton class TraceLog.
Now we’ll come up with a complex task, the execution time of which we want to track and add the TRACE_EVENT macro in the right places. This macro expands to instantiate an object of the ScopedTracer class, which, as you might guess, will report on the execution duration within the scope. More details can be found here.
The final part is left - you need to turn off the tracing and save the results to disk. I admit right away that basically the code is taken from here.
')
So, everything you need is there, it remains only to collect everything in one pile.
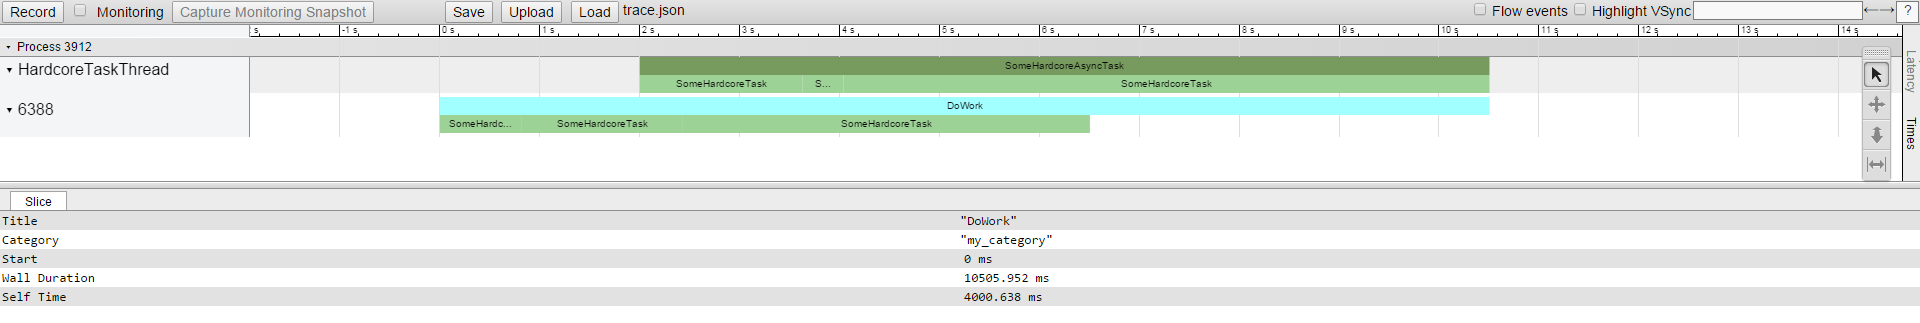
As a result, we get the trace.json file, which can be opened on the browser: // tracing and see the following:
As you can see, it turned out to be very easy to borrow quite useful functionality from chromium and apply it. I would like to emphasize that in addition to this, the source code of chromium has a lot of interesting approaches and simply ready-made solutions that you can apply in one way or another in your project.
If someone has more similar examples - tell us about them in the comments. From myself I can add that, for example, in the YT Yandex distributed computing framework, chromium callbacks are used, which were slightly modified with a file. I also once heard a story about Indians who made a client for a cloud drive on the basis of chromium, but I can’t find proofs now.
https://www.chromium.org/developers/design-documents
https://code.google.com/p/chromium/codesearch#chromium/src/base/
https://www.chromium.org/developers/how-tos/trace-event-profiling-tool
My name is Kostya, I am developing a Yandex Browser. Recently, we had a small C ++ party in our Novosibirsk office in Akademgorodok, where I talked about what tools we use to develop a browser and what can be borrowed for other large projects, for example, ninja , OWNERS . During development, we are very closely monitoring performance: CPU utilization, memory consumption, execution time for various operations, and so on. At the same time various utilities are actively used, but also internal browser debugging tools, for example, the internal browser: // tracing page (for Yandex Browser, chrome: // tracing for Chromium and Chrome).
Screenshot browser: // tracing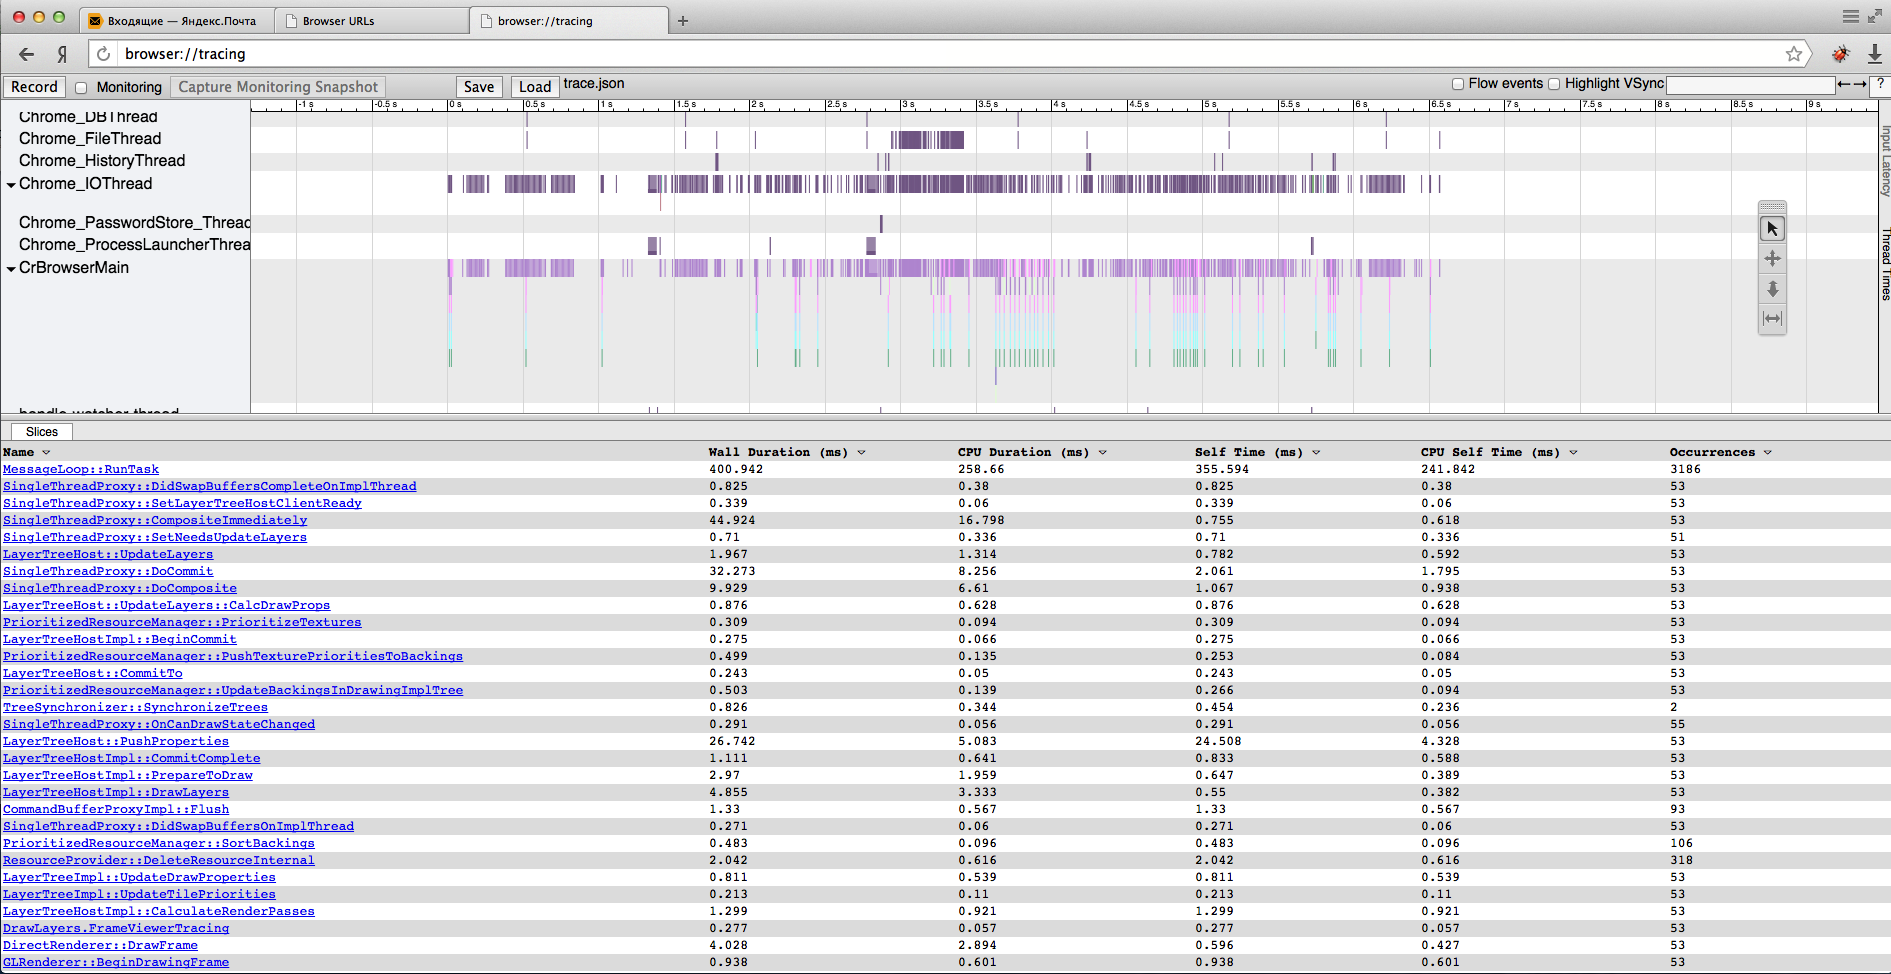
In short, on this page you can trace the duration of the execution of various functions and the number of calls broken down by processes, threads and passed arguments. Of course, there is no magic in it, and in order for this to work, you need to place special macros on the code. As it seems to me, this is a very handy tool that allows you to find a bunch of different problems. I believe that such a tool can be useful in other projects, so I decided to show how to use it.
Why do you need it?
Of course, in order to track projects there are a variety of tools, but they all have a huge minus - they cannot be used by a specific user, although this can be very important for understanding and diagnosing a problem. Diagnostics that the browser collects on the browser: // tracing can be collected at any time. It can be included only for a certain period in order to repeat the bug, and in other moments it does not bring a big overhead projector.
What do we need?
First of all, of course, source codes will be needed. By and large, what we need is located in the base / trace_event folder inside it, including other components from the base subfolder, for example, time, threading, synchronization, etc. I decided to do very simply and simply link with base.dll from the chromium assembly. Fortunately, I have a chromium repository even on a home computer, not to mention the workers. For those who want to go the same way, there are links to instructions for building for different platforms. Important: for component assembly you need to set the environment variable GYP_DEFINES = "component = shared_library" .
Secondly, we need header files that can be taken here .
Alternatively, instead of these two points, you can make it easier and add files from the base to your project.
Turn on tracing and use
First we need to turn on the tracing. To do this, you need to create a category filter that we want to apply. A category is an identifier for a group of a tracked operation. Categories are needed to select which groups we want to track at the moment. Then you need to call the SetEnabled method on the singleton class TraceLog.
const char kCategoryName[] = "my_category"; void StartTracing() { base::trace_event::CategoryFilter category_filter(kCategoryName); base::trace_event::TraceLog::GetInstance()->SetEnabled( category_filter, base::trace_event::TraceLog::RECORDING_MODE, base::trace_event::TraceOptions(base::trace_event::RECORD_UNTIL_FULL)); } Now we’ll come up with a complex task, the execution time of which we want to track and add the TRACE_EVENT macro in the right places. This macro expands to instantiate an object of the ScopedTracer class, which, as you might guess, will report on the execution duration within the scope. More details can be found here.
float SomeHardcoreTask(int max_num) { TRACE_EVENT1(kCategoryName, "SomeHardcoreTask", "max_num", max_num); float x = 1.5f; for (int i = 0; i < max_num; ++i) x *= sin(x) / atan(x) * tanh(x) * sqrt(x); return x; } void SomeHardcoreAsyncTask( base::WaitableEvent* event, const base::Callback<void(float)>& out_cb) { TRACE_EVENT0(kCategoryName, "SomeHardcoreAsyncTask"); for (int i : {20000000, 5000000, 80000000}) out_cb.Run(SomeHardcoreTask(i)); event->Signal(); } void AsyncTaskCb(float x) { } void DoWork() { TRACE_EVENT0(kCategoryName, "DoWork"); base::Thread thread("HardcoreTaskThread"); thread.Start(); base::WaitableEvent event(false, false); thread.message_loop_proxy()->PostDelayedTask( FROM_HERE, base::Bind(&SomeHardcoreAsyncTask, &event, base::Bind(&AsyncTaskCb)), base::TimeDelta::FromSeconds(2)); for (int i : {10000000, 20000000, 50000000}) std::cout << SomeHardcoreTask(i); event.Wait(); } The final part is left - you need to turn off the tracing and save the results to disk. I admit right away that basically the code is taken from here.
const char kTracingJsonPath[] = "D:\\trace.json"; // -, . void WriteTraceDataCollected( base::File* output_file, const scoped_refptr<base::RefCountedString>& events_str, bool has_more_events) { output_file->WriteAtCurrentPos(events_str->data().c_str(), events_str->data().length()); if (has_more_events) output_file->WriteAtCurrentPos(",", 1); } // . void StopTracingAndFlushToDisk() { base::trace_event::TraceLog::GetInstance()->SetDisabled(); base::File output(base::FilePath::FromUTF8Unsafe(kTracingJsonPath), base::File::FLAG_CREATE_ALWAYS | base::File::FLAG_WRITE); CHECK(output.IsValid()); static const char kStart[] = "{\"traceEvents\":["; static const char kEnd[] = "]}"; output.WriteAtCurrentPos(kStart, strlen(kStart)); base::trace_event::TraceLog::GetInstance()->SetDisabled(); base::trace_event::TraceLog::GetInstance()->Flush( base::Bind(&WriteTraceDataCollected, &output)); output.WriteAtCurrentPos(kEnd, strlen(kEnd)); output.Close(); } ')
So, everything you need is there, it remains only to collect everything in one pile.
int main() { StartTracing(); DoWork(); StopTracingAndFlushToDisk(); return 0; } All code together
#define NOMINMAX #include <iostream> #include <base/files/file.h> #include <base/synchronization/waitable_event.h> #include <base/trace_event/trace_event.h> namespace { const char kCategoryName[] = "my_category"; const char kTracingJsonPath[] = "D:\\trace.json"; void WriteTraceDataCollected( base::File* output_file, const scoped_refptr<base::RefCountedString>& events_str, bool has_more_events) { output_file->WriteAtCurrentPos(events_str->data().c_str(), events_str->data().length()); if (has_more_events) output_file->WriteAtCurrentPos(",", 1); } void StartTracing() { base::trace_event::CategoryFilter category_filter(kCategoryName); base::trace_event::TraceLog::GetInstance()->SetEnabled( category_filter, base::trace_event::TraceLog::RECORDING_MODE, base::trace_event::TraceOptions(base::trace_event::RECORD_UNTIL_FULL)); } void StopTracingAndFlushToDisk() { base::trace_event::TraceLog::GetInstance()->SetDisabled(); base::File output(base::FilePath::FromUTF8Unsafe(kTracingJsonPath), base::File::FLAG_CREATE_ALWAYS | base::File::FLAG_WRITE); CHECK(output.IsValid()); static const char kStart[] = "{\"traceEvents\":["; static const char kEnd[] = "]}"; output.WriteAtCurrentPos(kStart, strlen(kStart)); base::trace_event::TraceLog::GetInstance()->SetDisabled(); base::trace_event::TraceLog::GetInstance()->Flush( base::Bind(&WriteTraceDataCollected, &output)); output.WriteAtCurrentPos(kEnd, strlen(kEnd)); output.Close(); } float SomeHardcoreTask(int max_num) { TRACE_EVENT1(kCategoryName, "SomeHardcoreTask", "max_num", max_num); float x = 1.5f; for (int i = 0; i < max_num; ++i) x *= sin(x) / atan(x) * tanh(x) * sqrt(x); return x; } void SomeHardcoreAsyncTask( base::WaitableEvent* event, const base::Callback<void(float)>& out_cb) { TRACE_EVENT0(kCategoryName, "SomeHardcoreAsyncTask"); for (int i : {20000000, 5000000, 80000000}) out_cb.Run(SomeHardcoreTask(i)); event->Signal(); } void AsyncTaskCb(float x) { } void DoWork() { TRACE_EVENT0(kCategoryName, "DoWork"); base::Thread thread("HardcoreTaskThread"); thread.Start(); base::WaitableEvent event(false, false); thread.message_loop_proxy()->PostDelayedTask( FROM_HERE, base::Bind(&SomeHardcoreAsyncTask, &event, base::Bind(&AsyncTaskCb)), base::TimeDelta::FromSeconds(2)); for (int i : {10000000, 20000000, 50000000}) std::cout << SomeHardcoreTask(i); event.Wait(); } } // namespace int main() { StartTracing(); DoWork(); StopTracingAndFlushToDisk(); return 0; } Result
As a result, we get the trace.json file, which can be opened on the browser: // tracing and see the following:

Conclusion
As you can see, it turned out to be very easy to borrow quite useful functionality from chromium and apply it. I would like to emphasize that in addition to this, the source code of chromium has a lot of interesting approaches and simply ready-made solutions that you can apply in one way or another in your project.
If someone has more similar examples - tell us about them in the comments. From myself I can add that, for example, in the YT Yandex distributed computing framework, chromium callbacks are used, which were slightly modified with a file. I also once heard a story about Indians who made a client for a cloud drive on the basis of chromium, but I can’t find proofs now.
useful links
https://www.chromium.org/developers/design-documents
https://code.google.com/p/chromium/codesearch#chromium/src/base/
https://www.chromium.org/developers/how-tos/trace-event-profiling-tool
Source: https://habr.com/ru/post/256907/
All Articles