We are trying to make monitoring via SNMP really simple.
A lot has already been written that in the title of the Simple Network Management Protocol, the word Simple can be safely written in quotes. The SNMP protocol is fairly simple in terms of creating SNMP agents, but on the SNMP manager side, competently handling complex data structures is usually a nontrivial task.
We tried to simplify the process of setting up data collection and SNMP events and allow users during this process:
')
First of all, you need to deal with MIB files. The description of the logic of connections between data elements and their syntax was implemented in SNMP using these files in order to reduce the load on the network and simplify the implementation of agents. Users, however, do not always want to deal with their internal structure.
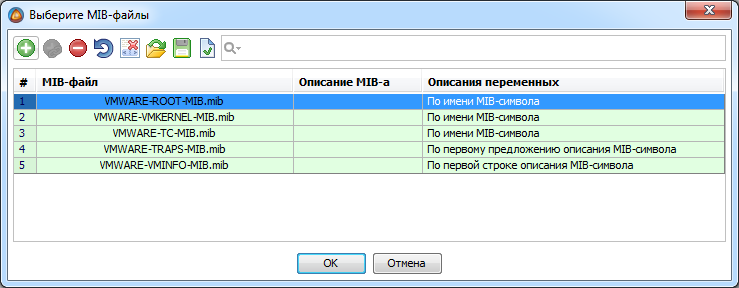
The SNMP module of our AggreGate Network Manager system on startup loads all MIB files located in a special server folder, and then allows you to add new ones using a simple dialog:
When files are uploaded, they are automatically compiled. The built-in MIB editor with syntax highlighting is available only in case of the appearance of MIBs that do not comply with the specification. They need to use extremely rarely.
This is where the work with the MIB files ends, then their names are used only for the logical grouping of the data already collected. If necessary, the downloaded files can be viewed and searched in the MIB table, but during normal operation this is also not required.
In the case of building a classical monitoring system, this step is usually not required, since all devices are added to the system automatically during periodic discovery of devices (network discovery). However, during the addition of the devices detected by the network scan, the same steps are performed:
After completing the device connection stage, the system needs from several seconds to several minutes to complete the device polling within the selected MIBs. When the device icon turns green, you can open and examine the so-called “device snapshot”:

This snapshot focuses almost the entire gist of our approach to working with SNMP data. First of all, it always contains "at hand" all the real data devices. In this case, all data is read only once, the subsequent survey is only on important metrics. Full rereading of the device snapshot is performed once a day, to reduce the load on the network, it can be turned off altogether. The device snapshot is optionally stored in the database when the monitoring system is restarted.
Usually it is not necessary to resort to the help of any external utilities when it is required to find suitable data for monitoring by their descriptions in the MIB file or values. All data is already grouped by MIB files, but you can also group it by the OID hierarchy:

To view a detailed description of any metric or table contained in a MIB file, just hover the mouse over the description or value of the metric. The tooltip also shows the SNMP data type and full OID:

If the metric can take one of several numerical values described in the MIB file by text constants, the constant corresponding to the current value is immediately displayed in the device snapshot. The full list of constants and their numerical values is available through the context menu:
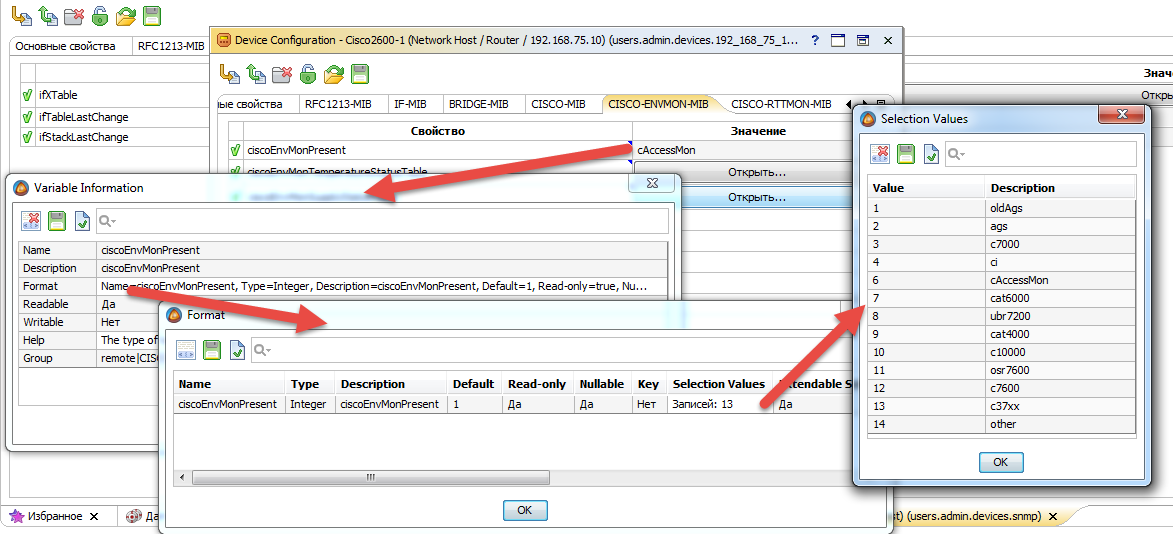
In this case, the current numerical value can always be viewed in a tooltip. For editable metrics it is still easier, you can select a constant and see its value directly in the drop-down list:

But our method of working with SNMP data brings the most benefit when processing tables. Each SNMP table is shown in the device snapshot as a separate table type metric:
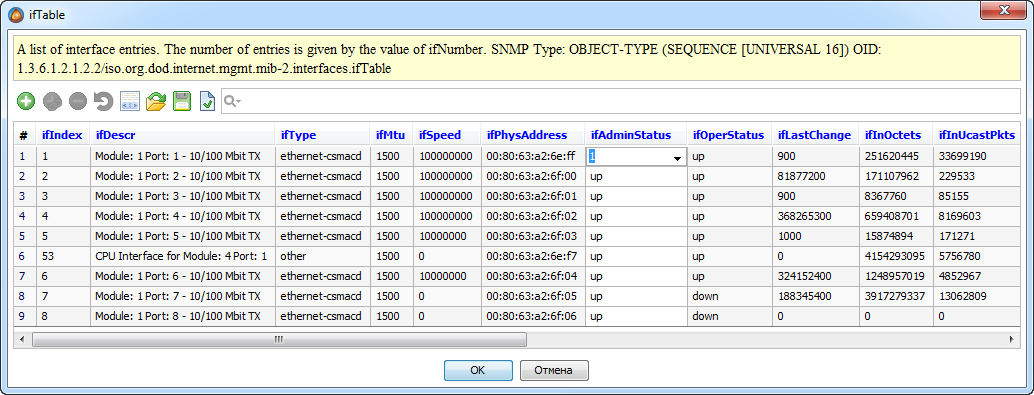
Editing data in the tables can be made directly during viewing, for example, to disable the network interface, it is enough to change the value of the ifAdminStatus field in the corresponding line.
When you hover over a column header in the tooltip, you can see the description of the field obtained from the MIB file, as well as its type and OID:

If there are several related tables, for example, using external indexes or extension (augmentation), the system automatically processes all internal links and brings the data of the related tables into one. In most cases, users are not even aware of the existence of such difficulties. For example, here is the hrSWRunPerfTable table:
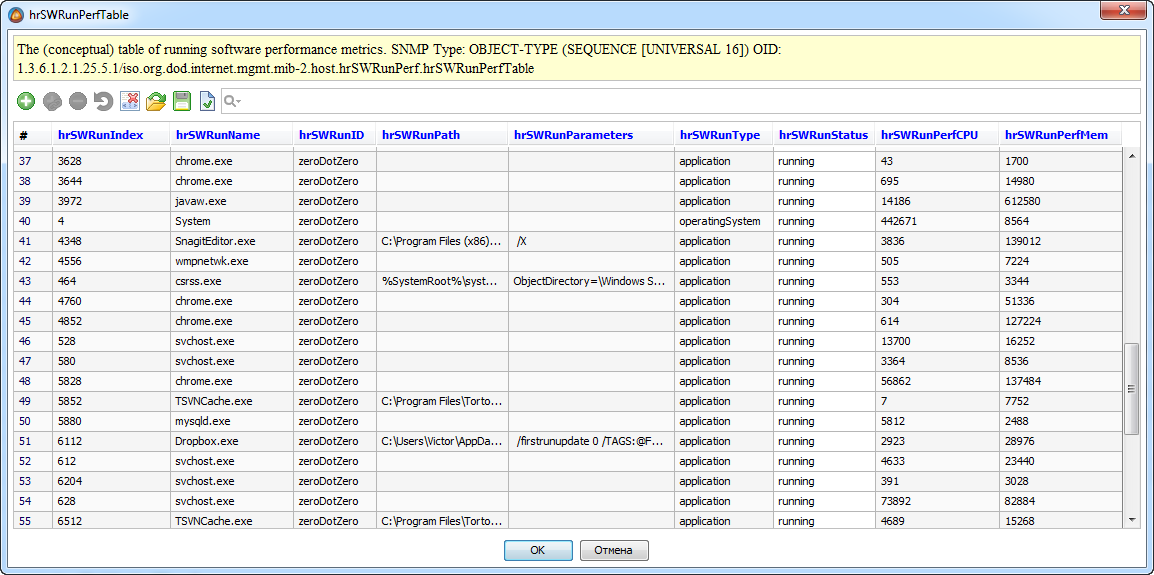
At the file MIB level, this table consists of two columns ( hrSWRunPerfCPU and hrSWRunPerfMem ), extending the hrSWRunTable table. In the device snapshot, these tables are already combined, which facilitates data analysis, reporting and charts, storage setup, etc.
Because AggreGate’s single data model is designed to work with tables, SNMP data tables are an ideal candidate for inline processing. They help build L2 / L3 topology, analyze MPLS TE and MPLS VPN data, monitor and create IP SLA tests, as well as hundreds of simpler tasks.
AggreGate Network Manager is at the same time a platform and a boxed product , so in most cases, after automatic or manual device addition, the polling periods and storage periods of metrics are already pre-configured for all metrics and tables that the system “understands”, i.e. shows on the dashboards and analyzes the need for generating alarm messages.
You can adjust the polling (synchronization) and storage settings for a metric through its context menu, or through account settings (for all metrics at once).
In the storage settings dialog, only the storage time of the raw data in a regular database (relational or NoSQL, depending on server settings) is shown. In most cases, SNMP data is stored in a ring database (Round-Robin Database, RRD), which is built into the AggreGate platform. On the topic of creating statistics channels , which shift the metrics and parts of the tables into a circular database, there will be a separate article.
When data is collected and stored in the server database, you can begin using it for business, that is, for monitoring and managing your IT infrastructure. The context menu of any metric in a device snapshot provides access to wizards, which allow you to start setting up alarms, reports, charts, queries, dashboards, and other analysis and visualization tools.

Using these tools, you can customize the effect of metrics and tables on system-wide search for causes of failures, performance analysis, planning and inventory, configuration management, and other system functions. Along the way, various interfaces are “drawn”:
The process described above may seem complicated due to the many details mentioned, but in practice it takes only a few minutes from the moment a new device is connected to the appearance of its specific data on standard toolbars. During this time, leaving our system is required only for the time of searching for specific MIB files on the site of the manufacturer of the connected equipment.
When setting up monitoring, it is not necessary to manually specify the names of MIBs, enter OIDs and other low-level identifiers. This makes setting up SNMP monitoring fairly quick and easy.
Of course, we still have work to do. Improvement of the mechanisms for the selection of individual metrics is required in order to avoid even a single survey of entire MIBs. There is a need to exclude from the survey individual rows and columns of SNMP tables. We would be interested to hear about other shortcomings in the process of setting up SNMP monitoring in our system.
This article does not cover receiving, processing, and sending SNMP traps, working on SNMP v3, and many other aspects.
For a more detailed story, we invite all hosts to the Webinar Monitoring and Management via SNMP , which will be held on May 26, 2015 at 11:00 Moscow time. At this webinar, we will “live” demonstrate the entire process described above, as well as many other ways to monitor network, server and non-standard equipment using SNMP.
View the program, register for the webinar and add to the calendar >>
Update - webinar entry:
We tried to simplify the process of setting up data collection and SNMP events and allow users during this process:
')
- Never look inside the MIB files
- Do not know what OIDs are and never operate with them.
- Do not use a separate SNMP utility to preview data during configuration.
Step 1: Add MIB Files
First of all, you need to deal with MIB files. The description of the logic of connections between data elements and their syntax was implemented in SNMP using these files in order to reduce the load on the network and simplify the implementation of agents. Users, however, do not always want to deal with their internal structure.
The SNMP module of our AggreGate Network Manager system on startup loads all MIB files located in a special server folder, and then allows you to add new ones using a simple dialog:
When files are uploaded, they are automatically compiled. The built-in MIB editor with syntax highlighting is available only in case of the appearance of MIBs that do not comply with the specification. They need to use extremely rarely.
MIB editor
This is where the work with the MIB files ends, then their names are used only for the logical grouping of the data already collected. If necessary, the downloaded files can be viewed and searched in the MIB table, but during normal operation this is also not required.
MIB table
Step 2: Connect the SNMP device
In the case of building a classical monitoring system, this step is usually not required, since all devices are added to the system automatically during periodic discovery of devices (network discovery). However, during the addition of the devices detected by the network scan, the same steps are performed:
- Select the type of device. In our case, either SNMP or Network Host , which are supported by Ping, SNMP, WMI, and other typical IT monitoring protocols, are suitable.
- Specifying the address and communications settings. This refers to the protocol version, SNMP Communities, timeouts and number of retries, SNMP v3 settings, etc.SNMP driver settings
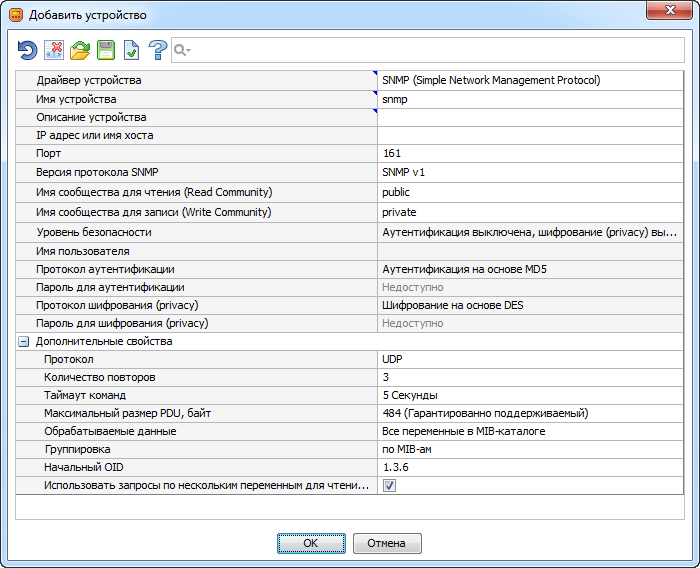
- Selection of assets, that is, MIB files. The Network Manager automatically detects which MIBs are supported by the device, which we wrote about in a separate article . It remains only to choose which MIBs will be surveyed, and the MIBs for which there is a “boxed” analytics and visualization are already selected by default.
Step 3: study the device snapshot
After completing the device connection stage, the system needs from several seconds to several minutes to complete the device polling within the selected MIBs. When the device icon turns green, you can open and examine the so-called “device snapshot”:
This snapshot focuses almost the entire gist of our approach to working with SNMP data. First of all, it always contains "at hand" all the real data devices. In this case, all data is read only once, the subsequent survey is only on important metrics. Full rereading of the device snapshot is performed once a day, to reduce the load on the network, it can be turned off altogether. The device snapshot is optionally stored in the database when the monitoring system is restarted.
Usually it is not necessary to resort to the help of any external utilities when it is required to find suitable data for monitoring by their descriptions in the MIB file or values. All data is already grouped by MIB files, but you can also group it by the OID hierarchy:
To view a detailed description of any metric or table contained in a MIB file, just hover the mouse over the description or value of the metric. The tooltip also shows the SNMP data type and full OID:
If the metric can take one of several numerical values described in the MIB file by text constants, the constant corresponding to the current value is immediately displayed in the device snapshot. The full list of constants and their numerical values is available through the context menu:
In this case, the current numerical value can always be viewed in a tooltip. For editable metrics it is still easier, you can select a constant and see its value directly in the drop-down list:
But our method of working with SNMP data brings the most benefit when processing tables. Each SNMP table is shown in the device snapshot as a separate table type metric:
Editing data in the tables can be made directly during viewing, for example, to disable the network interface, it is enough to change the value of the ifAdminStatus field in the corresponding line.
When you hover over a column header in the tooltip, you can see the description of the field obtained from the MIB file, as well as its type and OID:
If there are several related tables, for example, using external indexes or extension (augmentation), the system automatically processes all internal links and brings the data of the related tables into one. In most cases, users are not even aware of the existence of such difficulties. For example, here is the hrSWRunPerfTable table:
At the file MIB level, this table consists of two columns ( hrSWRunPerfCPU and hrSWRunPerfMem ), extending the hrSWRunTable table. In the device snapshot, these tables are already combined, which facilitates data analysis, reporting and charts, storage setup, etc.
Because AggreGate’s single data model is designed to work with tables, SNMP data tables are an ideal candidate for inline processing. They help build L2 / L3 topology, analyze MPLS TE and MPLS VPN data, monitor and create IP SLA tests, as well as hundreds of simpler tasks.
Step 4: set up the polling periods and storage periods
AggreGate Network Manager is at the same time a platform and a boxed product , so in most cases, after automatic or manual device addition, the polling periods and storage periods of metrics are already pre-configured for all metrics and tables that the system “understands”, i.e. shows on the dashboards and analyzes the need for generating alarm messages.
You can adjust the polling (synchronization) and storage settings for a metric through its context menu, or through account settings (for all metrics at once).
Survey and storage settings
In the storage settings dialog, only the storage time of the raw data in a regular database (relational or NoSQL, depending on server settings) is shown. In most cases, SNMP data is stored in a ring database (Round-Robin Database, RRD), which is built into the AggreGate platform. On the topic of creating statistics channels , which shift the metrics and parts of the tables into a circular database, there will be a separate article.
Step 5: go to the processing and visualization of data
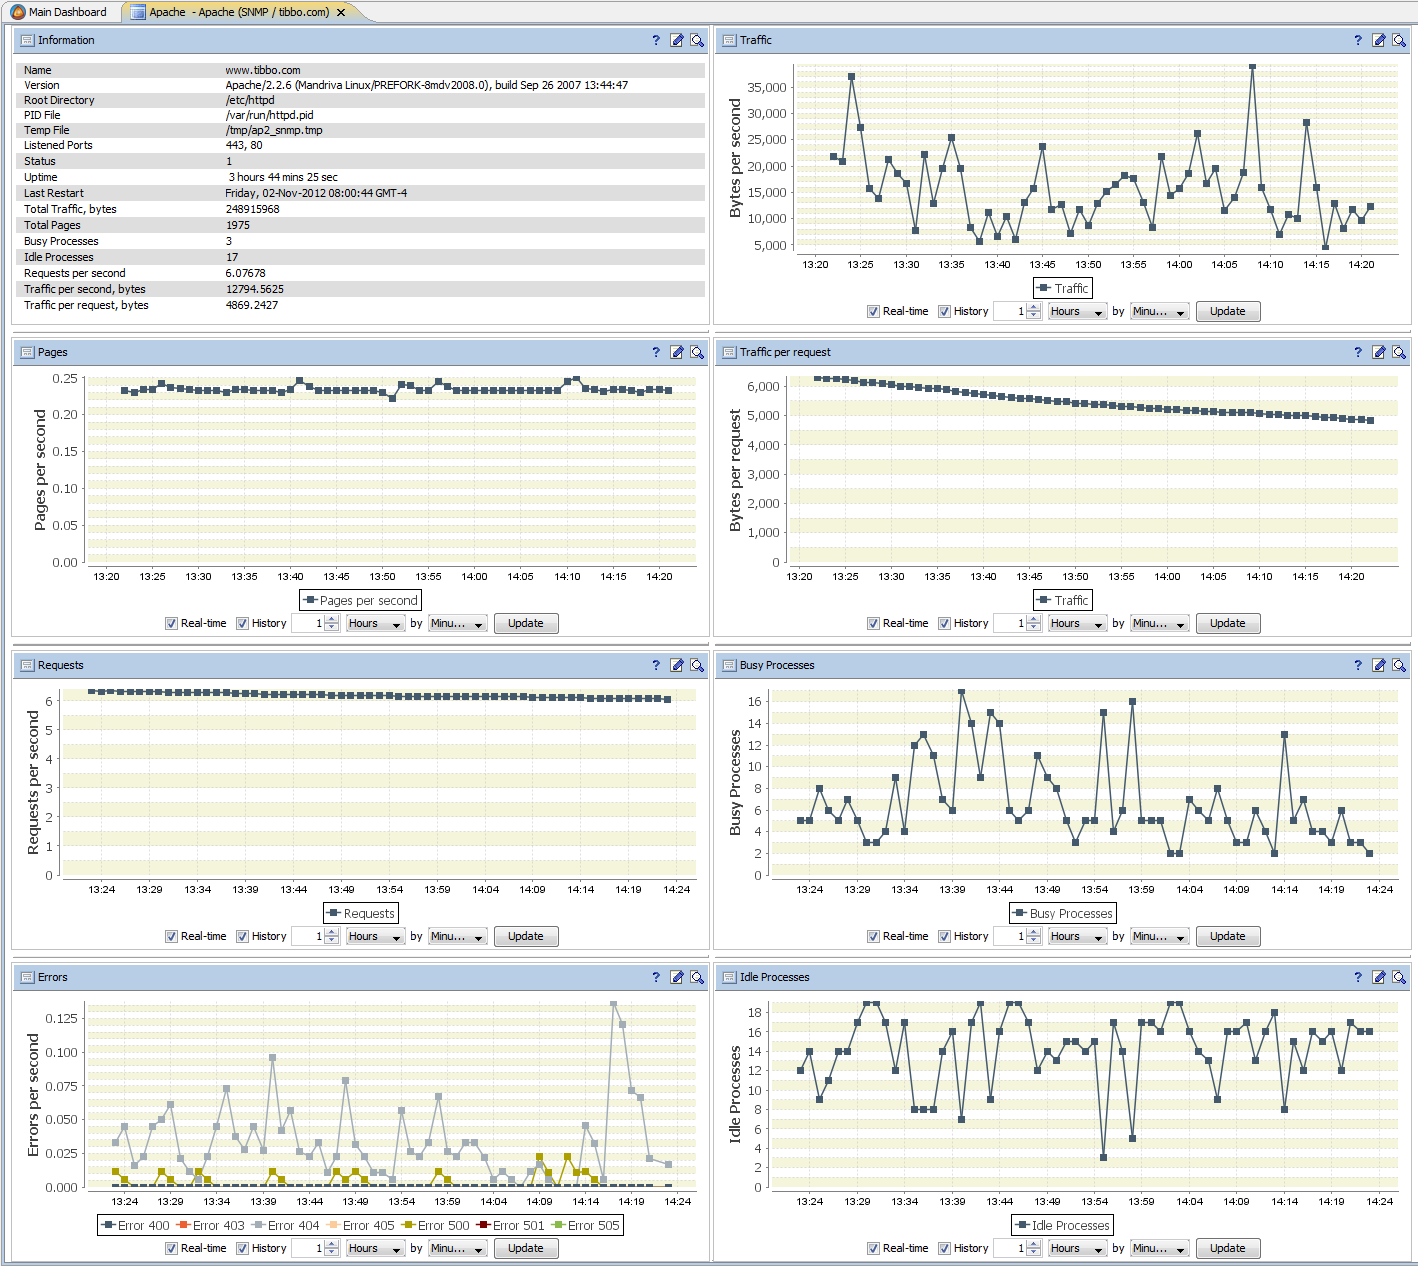
When data is collected and stored in the server database, you can begin using it for business, that is, for monitoring and managing your IT infrastructure. The context menu of any metric in a device snapshot provides access to wizards, which allow you to start setting up alarms, reports, charts, queries, dashboards, and other analysis and visualization tools.
Using these tools, you can customize the effect of metrics and tables on system-wide search for causes of failures, performance analysis, planning and inventory, configuration management, and other system functions. Along the way, various interfaces are “drawn”:
As a result
The process described above may seem complicated due to the many details mentioned, but in practice it takes only a few minutes from the moment a new device is connected to the appearance of its specific data on standard toolbars. During this time, leaving our system is required only for the time of searching for specific MIB files on the site of the manufacturer of the connected equipment.
When setting up monitoring, it is not necessary to manually specify the names of MIBs, enter OIDs and other low-level identifiers. This makes setting up SNMP monitoring fairly quick and easy.
Of course, we still have work to do. Improvement of the mechanisms for the selection of individual metrics is required in order to avoid even a single survey of entire MIBs. There is a need to exclude from the survey individual rows and columns of SNMP tables. We would be interested to hear about other shortcomings in the process of setting up SNMP monitoring in our system.
And detail?
This article does not cover receiving, processing, and sending SNMP traps, working on SNMP v3, and many other aspects.
For a more detailed story, we invite all hosts to the Webinar Monitoring and Management via SNMP , which will be held on May 26, 2015 at 11:00 Moscow time. At this webinar, we will “live” demonstrate the entire process described above, as well as many other ways to monitor network, server and non-standard equipment using SNMP.
View the program, register for the webinar and add to the calendar >>
Update - webinar entry:
Source: https://habr.com/ru/post/256623/
All Articles