DataTalks # 2: Data Visualization
The second meeting of the DataTalks community was devoted to data visualization - one of the most important and powerful tools in the hands of analysts. After all, the decisions and conclusions of the customer depend on how the results of the research work are presented. In addition, visualization helps to conduct preliminary data analysis and quickly find new relationships.
Under the cut you will find recordings of speeches by representatives of companies Wargaming, Ambitious Suits Consulting, Targetprocess, A2 Consulting and the Internet portal TUT.BY. The speakers shared their experience in visual and informative presentation of data.
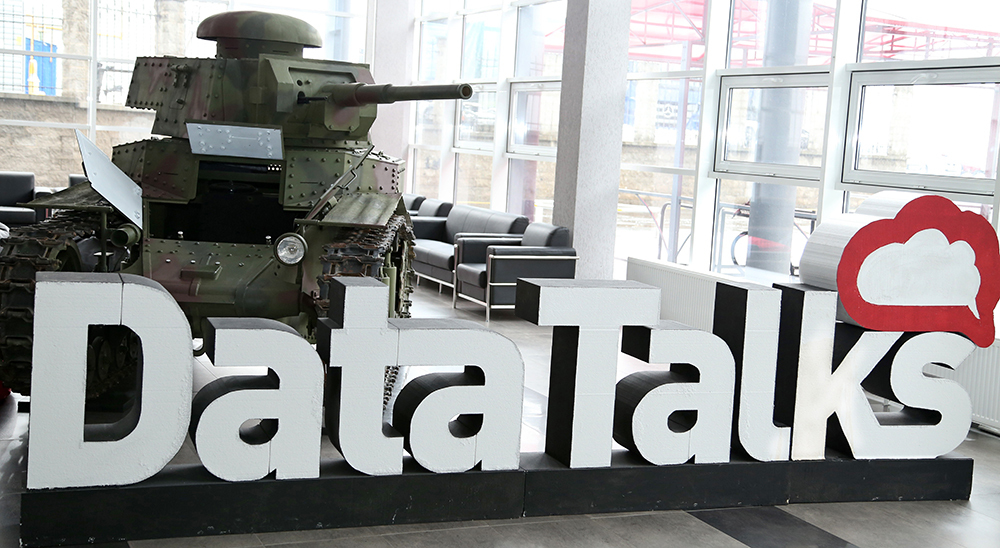
The meeting itself was traditionally held "under the tank," in the main office of SOOO "Game Stream", the Minsk office of the development of Wargaming.
Data visualization for business using BI QlikView / Alexander Gonchar / A2 Consulting
Alexander showed examples of using the QlikView BI system in various Belarusian companies. Analysis and visualization of data conducted using QlikView helps A2 Consulting clients not only to monitor the state of the business on-line, but also to find ways to increase profitability.
Data Visualization: R and Tableau Desktop / Alexey Yurkevich, Dmitry Schegrikovich / Wargaming
Alexey and Dmitry shared their experience in visual presentation of data using the R and Tableau Desktop applications. In the story about R Alexey focused on several packages that allow you to start data visualization without special training.
Dmitry spoke about the advantages of using Tableau Desktop for data visualization, and also warned against several common mistakes that can be made when presenting data to the customer.
Interactive and static infographics. Features of the perception of data by a mass audience / Vadim Shmygov / TUT.BY
Vadim Shmygov conducted a small retrospective of his best work and talked about what tools and data he uses to create intuitive and relevant infographics for almost four million audience of the portal TUT.BY
Pain points in analyst presentations / Victor Smusin / Ambitious Suits Consulting
Every analyst who works with a business should be able to competently, clearly and clearly convey their ideas and conclusions to customers. Victor spoke about the basic rules, the observance of which will make any presentation more effective.
Visual decision-making techniques / Natalia Yadrentseva / Targetprocess
There are data visualization patterns. But does their application always lead to the desired result? Natalia showed several examples of how traditional ways of presenting data can interfere with the perception of information, and also presented alternative options for presenting statistics that are more convenient and simple.
DataTalks meetings began as informal events for data analysis professionals. On their basis, it was possible to gather a real community with its regular participants and experts. Inspired by the topic of data visualization, we have prepared a small infographic that will help you get acquainted with our community:

Report from the first meeting of the DataTalks community : Data analysis for solving business problems
Join the DataTalks analytics community! Join our group on LinkedIn , stay tuned for meeting announcements and feel free to ask questions.
See you on DataTalks!
Under the cut you will find recordings of speeches by representatives of companies Wargaming, Ambitious Suits Consulting, Targetprocess, A2 Consulting and the Internet portal TUT.BY. The speakers shared their experience in visual and informative presentation of data.
The meeting itself was traditionally held "under the tank," in the main office of SOOO "Game Stream", the Minsk office of the development of Wargaming.
Data visualization for business using BI QlikView / Alexander Gonchar / A2 Consulting
Alexander showed examples of using the QlikView BI system in various Belarusian companies. Analysis and visualization of data conducted using QlikView helps A2 Consulting clients not only to monitor the state of the business on-line, but also to find ways to increase profitability.
Data Visualization: R and Tableau Desktop / Alexey Yurkevich, Dmitry Schegrikovich / Wargaming
Alexey and Dmitry shared their experience in visual presentation of data using the R and Tableau Desktop applications. In the story about R Alexey focused on several packages that allow you to start data visualization without special training.
Dmitry spoke about the advantages of using Tableau Desktop for data visualization, and also warned against several common mistakes that can be made when presenting data to the customer.
Interactive and static infographics. Features of the perception of data by a mass audience / Vadim Shmygov / TUT.BY
Vadim Shmygov conducted a small retrospective of his best work and talked about what tools and data he uses to create intuitive and relevant infographics for almost four million audience of the portal TUT.BY
Pain points in analyst presentations / Victor Smusin / Ambitious Suits Consulting
Every analyst who works with a business should be able to competently, clearly and clearly convey their ideas and conclusions to customers. Victor spoke about the basic rules, the observance of which will make any presentation more effective.
Visual decision-making techniques / Natalia Yadrentseva / Targetprocess
There are data visualization patterns. But does their application always lead to the desired result? Natalia showed several examples of how traditional ways of presenting data can interfere with the perception of information, and also presented alternative options for presenting statistics that are more convenient and simple.
DataTalks meetings began as informal events for data analysis professionals. On their basis, it was possible to gather a real community with its regular participants and experts. Inspired by the topic of data visualization, we have prepared a small infographic that will help you get acquainted with our community:
Report from the first meeting of the DataTalks community : Data analysis for solving business problems
Join the DataTalks analytics community! Join our group on LinkedIn , stay tuned for meeting announcements and feel free to ask questions.
See you on DataTalks!
')
Source: https://habr.com/ru/post/256567/
All Articles