Scientifically looking for errors in the cloud: an unexpected CEO adventure

Translation of Stephen Wolfram's post (Stephen Wolfram) "Scientific Bug Hunting in the Cloud: An Unexpected CEO Adventure" .
I express my deep gratitude to Kirill Guzenko for his help in translating.
Wolfram Cloud must be perfect
Wolfram Cloud will soon be out of beta testing, at the moment I spend a lot of time to make this system as good as possible (and, it is worth noting, it turns out really great!). I mainly deal with high-level functions and strategy. But I like to control the process at all levels, because, as a CEO, I am fully responsible for everything that happens in my company. And in early March, I was immersed in what I could not have guessed before.
Actually, that's what it is about. As a serious production system that many people will use, including for business, the Wolfram Cloud should work as quickly as possible. The indicators showed that the speed was good enough, but it was subjectively felt that something was wrong. Sometimes everything was really fast, but sometimes it seemed that everything was working too slowly.
')
There are excellent programmers in our team, however, months went by and there were no changes whatsoever. In the meantime, we managed to release Wolfram Data Drop (see the article on Wolfram Data Drop - the new Wolfram Research service ). So I thought, why don't I do some tests myself, maybe, and collect some information in our new Wolfram Data Drop?
A significant advantage of Wolfram Language is how good it is for busy people: even if you have time just to print just a few lines of code (see the article on Habrahabr. Wolfram Research opened the Tweet-a-Program service: interesting programs in Wolfram Language, whose length does not exceed 140 characters "), you can get something really useful. And, in this case, it was enough for me to look through three lines of code to find the problem.
First, I deployed a web API for a simple program on the Wolfram Language on the Wolfram Cloud:
![In [1]: = CloudDeploy [APIFunction [{}, 1 & amp;]] In[1]:= CloudDeploy[APIFunction[{}, 1 &]]](https://habrastorage.org/getpro/habr/post_images/2b5/1ea/576/2b51ea5767d8025cb779826b6936f26e.png)
Then I called the API 50 times in a row, each time measuring how long the call lasted ( % is the previous calculated result):
![In [2]: = Table [First [AbsoluteTiming [URLExecute [%]]], {50}] In[2]:= Table[First[AbsoluteTiming[URLExecute[%]]], {50}]](https://habrastorage.org/getpro/habr/post_images/992/74c/843/99274c84372d93274fa9d734da9c2403.png)
After that, I built a sequence of calls in time:
![In [3]: = ListLinePlot [%] In[3]:= ListLinePlot[%]](https://habrastorage.org/getpro/habr/post_images/7c2/178/fa8/7c2178fa8c7e501f098dddc0f48bf344.png)
And then he got something that did not fit in the head. Sometimes the call took 220 ms or something like that, but a delay of 900 ms was discovered twice. But the craziest thing was that the signal seems to be quantized!
I built a histogram:
![In [4]: = Histogram [%%, 40] In[4]:= Histogram[%%, 40]](https://habrastorage.org/getpro/habr/post_images/516/8bc/6a2/5168bc6a23afca0f5175f21568b48a01.png)
And, of course, there were several quick calls that were located on the left, rather slow calls in the middle, and the slowest calls on the right. It was weird!
I wondered if this was always the case. So I created a scheduled task — to make an API call every few minutes, and then send the data to Wolfram Data Drop. And when I returned in the morning, this is what I saw:

Even more strange picture! Where did the large-scale structure come from? I could still understand, for example, that a particular node in a cluster is slowly slowing down, but why is it then slowly recovering?
My first thought was that I ran into problems with the network, considering that I was more than a thousand miles away from the cloud server. Then I looked at the ping. But apart from a couple of strange peaks (hey, this is the Internet!), Everything was very stable.
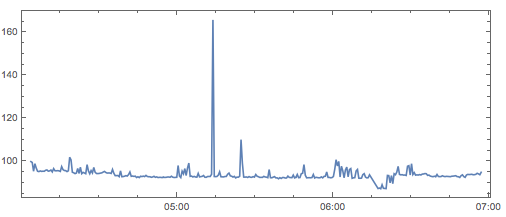
Something is wrong inside the servers
Well, it must be some kind of problem with the servers themselves. Wolfram Cloud contains a lot of different technologies, but basically it’s still pure Wolfram Language code that is easily tested. But behind the stratum of the language itself there is a modern server infrastructure. Much of it is practically the same as that used in Wolfram | Alpha for the last fifteen years to output billions of results, and that has been used in the Mathematica web for the last ten years. But, being a somewhat more demanding computing system, the Wolfram Cloud is a bit different.
And my first guess was that different settings could be the reason that something was going wrong in the web server layer. In the end, I hope the entire infrastructure from top to bottom will be written in pure Wolfram Language, but now we have to use the TomCat web server, which runs on Java. And the first thing I thought was that such slowdowns could be caused by the Java garbage collector. The analysis showed that the garbage collection initiated by Tomcat did cause some slowdowns, but they were insignificant and measured in units of milliseconds, not hundreds. So this could not be an explanation.
I was very focused on finding the problem. I have not had to dig so deeply in search of problems and mistakes for a long time. It felt as though I was doing experimental science. And, as is customary in experimental science, it is important to simplify the object of study as much as possible. Thus, I cut out most of the network elements, managing the “cloud from the cloud” (calling the API from the same cluster). Then I removed the load balancer, which sends requests to specific nodes of the cluster, blocking my requests to a specific node (which, by the way, third-party users cannot do if they do not have a private cloud ). However, the delay still remained.
After that, I began to collect more detailed data. My first step was to create an API that would return the absolute start and end time for the Wolfram Language code and compare it with the absolute time in the API. And that's what I saw:
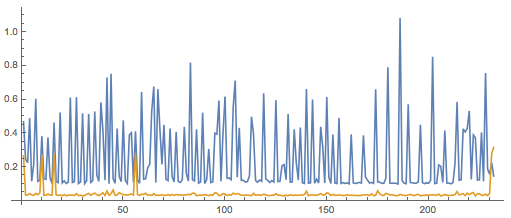
The blue line indicates the time before the Wolfram Language code starts; the golden line is after. I collected this data during the period when the system as a whole worked rather poorly. I saw serious decelerations in the period before initialization, and only a few isolated decelerations in the period after.
And again - it was very strange. It did not appear that the decelerations were specifically related to the period “before” or “after”. On the contrary, as if something accidental from outside the system knocked it out.
I was embarrassed by the fact that each cluster node in general contains eight cores, and each core works with its own instance of the Wolfram Engine . The engine is balanced and stable, and each instance of it can work for many hours or even days without rebooting. And I thought - what if some instances contain some errors? After that, I decided to build an API that would track the ID and time of the processes , and then, for example, build the dependence of the total process time on the execution time of the API components:
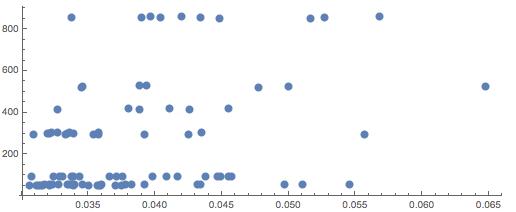
Indeed, the trends of new processes for a faster API call began to appear, but (especially noting the grouping of points near zero on the x axis), the effect was insignificant.
What feeds the CPU?
I started thinking about other Wolfram Cloud services running on the same machine. It would seem that it does not make sense that they can lead to the quantized slowdowns, but to simplify the system I wanted to get rid of them. First of all, we isolated the node on the production cluster. Then I started setting up my private Wolfram Private Cloud . But everything slowed down. Although, at different times and on different machines, their characteristics seemed to be somewhat different.
In a private cloud, I could just go into raw Linux and start looking around. The first thing I did was to start collecting results from the Unix utilities “top” and “ps axl” in Wolfram Language, and then I started analyzing them. And one thing was completely obvious: a lot of system time was constantly involved, the Linux kernel was always busy with something. And, in fact, it seemed that the slowdowns might not come from user code at all; they can come from something that happens in the kernel of the operating system.
Actually, it encouraged me to do a trace of system calls. I have not done anything like this for the past almost 25 years, but my past experience suggested that I have the opportunity to obtain a large amount of data, but difficult to interpret. However, now I have Wolfram Language.
The running “strace” utility on Linux, making API calls for a few seconds, contained 28,221,878 lines at its output. However, it took just a few lines of the Wolfram Language code to put together the start and end times for certain system calls to build a histogram of the duration of the system calls. Having done this for just a few system calls, I got this:
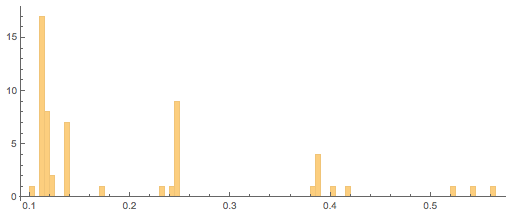
Interestingly, we received pronounced discrete peaks. And when I looked at the system calls corresponding to these peaks, it seemed that they all come from futex (the part of Linux responsible for synchronizing threads). Then I selected only calls from futex and saw sharp peaks at 250 ms, 500 ms and 1000 ms:

But were they really a problem? Call futex, in fact, is not active; they do not take up CPU time. And, in fact, this is a very typical situation - when some calls are waiting for I / O to complete them. So for me, the most interesting point was that there were no other system calls that would take hundreds of milliseconds.
So, the operating system itself slows down!
So what happens? I began to observe - what happens on the different cores of each node? Now Tomcat and other parts of our infrastructure do an excellent job with multithreading. Nevertheless, it turned out that what causes slowdowns causes all cores to slow down, even though they work with different threads. And the only thing that can do this is the core of the operating system.
But what would cause the Linux kernel to cause such slowdowns? I thought about the planner. I could not understand why our situation leads to inadequate behavior in the scheduler. But we all looked at the scheduler and tried to change various settings. No effect
Then I got an even stranger thought. The Wolfram Cloud instances that I used worked through virtual machines. And what if the slowdown came “from the outside of the Matrix”? I requested a version of the Wolfram Cloud running on bare metal - without a virtual machine. But before I was provided with it, I found a utility that measures the time it takes to lose a virtual machine, and it turned out to be negligible.
At this point, I dealt with this issue for an hour or two every day. At this time, I was just having a rich trip to the SXSW festival (see the article on Habrahabr " Stephen Wolfram: Frontiers of computational thinking (report from the SXSW festival) "). Until now, professionals in our cloud software design team have been actively involved in this issue, and I left this task to their skilled hands.
When I flew back, I came across other interesting moments. We divided each API call into 15 intermediate actions. Then one of our engineers with PhD in the field of physics compared the probability of slowing down at each step (left) with the average time spent on this step (right):

With one exception (which was caused by a known cause), we received a clear correlation. Everything looked as if the Linux kernel (and everything that works under its control) fell under the influence of something incomprehensible and at a completely random time, causing the same slowdowns that occurred at the time of calling some part of the API.
And we began to search for what caused these slowdowns. The next suspicious thing we noticed is a large number of I / O operations. In the configuration we tested, Wolfram Cloud used NFS to access the files. We tried to push NFS, change various parameters, use asynchronous mode, use UDP instead of TCP, change the I / O scheduler of the NFS server, etc. No changes. We tried to use a completely different file system called Ceph. Same problem. Then we tried to use a local disk as memory. In the end, it seems that it worked - most of the slowdowns disappeared, but some remained.
We took this as a sign and began to dig further into the area of I / O operations. We conducted an experiment that involved editing a huge notebook on a node when running a large number of API calls on the same node:
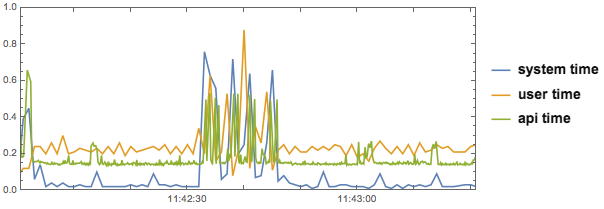
The result was interesting. During the period when the notebook was edited (and constantly saved), API calls lasted 500 ms instead of 100 ms. But why did simple file operations have such a strong influence on all 8 cores of a node?
The culprit found
We began to dig further, and soon we realized that simple file operations really were not, and we quickly understood why. You know, about five years ago, at the beginning of the development of Wolfram Cloud, we wanted to experiment with tracking file versions. And, as a prototype, someone introduced a simple version control system called RCS.
Many software systems in the world still use RCS, even though it has not had significant updates for almost 30 years, and by now much better solutions have emerged (like the ones we use for endless cancellation in notebooks) . But for some reason, that very prototype RCS was never replaced in our Wolfram Cloud codebase - and it was still running in every file!
One feature of RCS is that when a file is changed, even by just one bit, a large amount of data (sometimes as large as a file several times larger than the file itself) is written to disk. We weren't sure how many I / O operations in general could be expected. But it was clear that RCS makes this process unnecessarily more intensive.
Can I / O operations actually hang the entire Linux kernel? Perhaps there is some unknown global gateway. The disk subsystem may hang because it does not quickly flush the full buffers. The kernel may be busy re-displaying web pages in order to make large portions of memory available. Anything could happen at all, however, it was obvious that you just need to replace the RCS and see what changes it leads to.
We did it, and, lo and behold, these terrible decelerations immediately disappeared!
So, after a week of intensive debugging, we got a solution to our problem. And, when conducting the re-experiment, now everything worked as it should - the time for calling the API completely prevailed over the transfer time to the test cluster:
![Clean run times! Compare this to the In [3] image above. Clean run times! Compare this to the In[3] image above.](https://habrastorage.org/getpro/habr/post_images/0c0/e75/85c/0c0e7585ca90df54825616bb93ca8cf2.png)
Wolfram language and cloud
What did this teach me? First of all, my impression has increased that cloud software is the most difficult (even hostile) environment of development and debugging that I have ever encountered. Secondly, it made me realize how valuable Wolfram Language is as a kind of metasystem for analyzing, visualizing and organizing everything that happens within such a complex system as a cloud.
As for debugging, in this matter I am somewhat spoiled - since I write overwhelmingly at Wolfram Language, where debugging is very easy, and where I rarely had to spend more than a few minutes to find the error. Why is debugging so easy with Wolfram Language? First of all, I think this is because the code is usually short and readable . The same code is usually written in notebooks, where it can be tested, and each part of the program is documented when it is created. It is also an important detail that the Wolfram Language is a symbolic language, so you can always take any part of the program, and it will work independently.
Debugging software at lower levels is a completely different process. It is much more similar to the process of issuing a medical diagnosis , where they also deal with complex multicomponent systems and try to make a diagnosis based on the results of several measurements or experiments (if we think by analogies, then our version control problem might look like some terrible defect in DNA replication).
All this adventure in the cloud also very much emphasizes the value that we put on the Wolfram Cloud. Because a significant part of what the Wolfram Cloud is - protecting users from all the problems with the complexities of cloud infrastructure software, enabling them to develop and deploy anything directly in Wolfram Language.
Of course, in order to make this possible, we ourselves had to build the entire automated infrastructure. And now, thanks to this little adventure in “debugging with a scientific approach,” we are one step closer to this. And indeed, today, Wolfram Cloud has its own API, which works without any mysterious quantized slowdowns and is rapidly approaching the state when it can completely exit the beta version.
Source: https://habr.com/ru/post/256521/
All Articles