Debugging javascript build in IntelliJ IDEA / PHPStorm / WebStorm
According to the rules of the modern frontend, you need to give the user a minimum of files with a minimum weight. But during development, it is very inconvenient to write everything in one file, also in a compressed form, therefore, to solve this problem, different assemblies are used in the form of ready-made yeoman.io, generator-yeogurt, etc. Or assemble themselves with the use of Grunt, Gulp, etc. But it's not about that, it's about debugging javascript in these builds.
Perhaps in small projects this is not necessary, but in large projects there is nowhere, especially if you use the MVC framework and / or a bunch of self-written code.
On Habré there is already a good article on the topic of debugging js using the map file in chrome - "Introduction to Javascript Source Maps" . But if you work in the development environment, especially if this environment is from JetBrains, then it’s somehow wrong to get into chrome (although, of course, this is a very holivar topic). Therefore, I decided to write this article.
')
So let's get started.
First, to debug in IntelliJ IDEA / PHPStorm / WebStorm you will need GoogleChrome with plug-ins from JetBrains.
Further there are several options:
I did it through UglifyJS and therefore it will be in the example.
To do this, install the npm package uglify-js with a global key.
Next, go to File-> Settings-> Tools-> FileWatchers (if FileWatchers is not installed, then install it via plugins). Right click '+' and select UglifyJS in the drop-down menu:
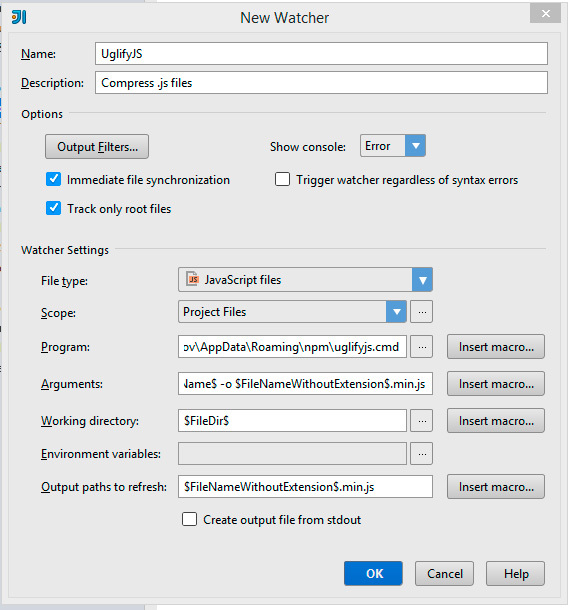
If everything is okay, then the program will find .cmdUglifyJS itself, if not, then you have to manually register it
On Windows it will be: C: \ Users \ UsersName \ AppData \ Roaming \ npm \ uglifyjs.cmd.
Then in 'Arguments:' we set the necessary arguments, including the arguments for creating the map file , according to the documentation .
Now ide will follow the specified js-files and create the map files itself.
Since I use gulp, I will give an example on it.
I will not describe the settings in detail, because on this topic and so many articles, just give an example of the grip file code that I use:
In this example, we use gulp-sourcemaps to create a map file, gulp-concat to concatenate files, gulp-uglify to minify, and gulp-rename to add the min suffix.
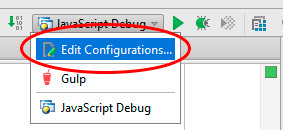
Click on the drop-down menu of the debugger and select 'EditConfigurations ...'
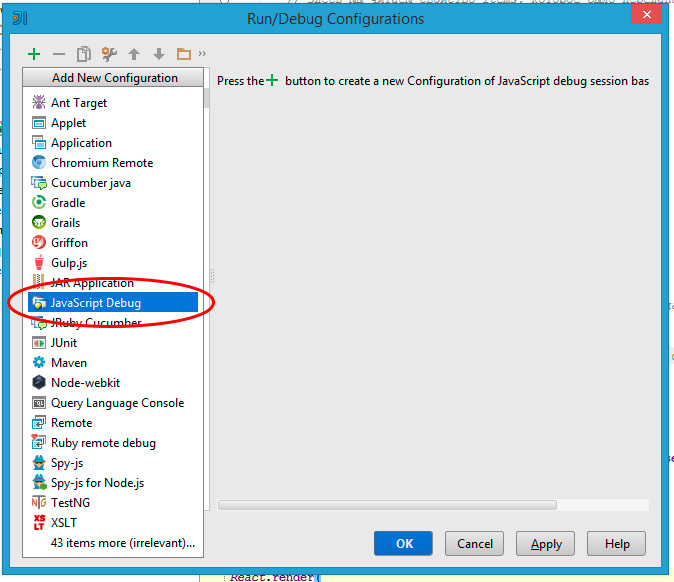
In the appeared window, in the upper left corner we press '+' and in the appeared drop-down list we select JavaScriptDebug.
In the debugger setup window, in the Name line we write the name of the task, in the URL we write, or the address of the site that will debug javascript, or the local directory / html file, which will open in the browser when debugging starts (I prefer to work with the site address). In the Browser: drop-down menu, select the browser that will open when you start debug.
If you set the url in the URL field, then the 'RemoteURLsoflocalfiles (optional):' field will appear, where you can specify the root folder of this url and the virtual address of the debugs files. (since your files will be written opposite your files / map / file.js)
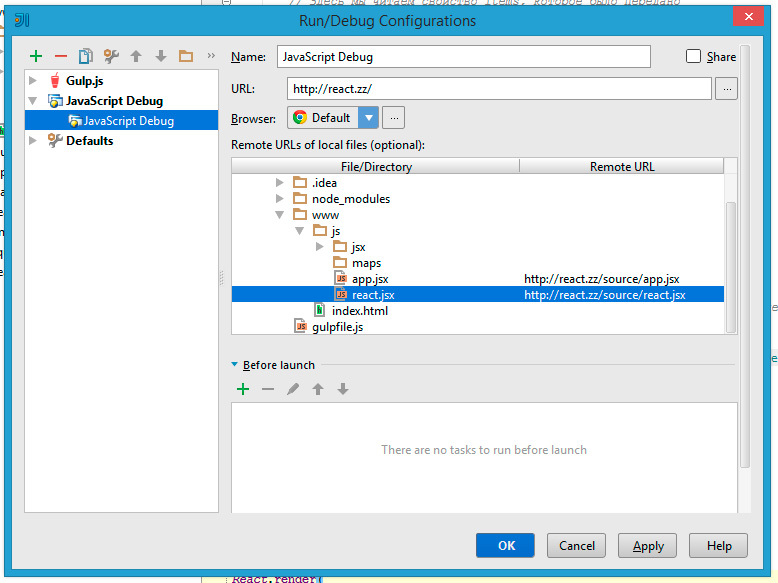
This is my example. You will have instead of .jsx just .js.
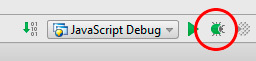
Now that everything is ready, click on the bug:
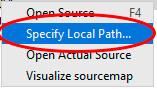
If everything is ok, then the browser will open at the specified address with the pop-up window “JetBrains IDE Support Debugs this Tab” (do not close this window during debugging, as the connection with ide will be broken immediately). In the debug window that opens, in the Scripts tab, you will be able to see your js files, in which you need to set breakpoints (most likely, they will have an address: your_sayt.ru / map / file.js, but it can be different, because the address where the source js files will be created virtually depends on the settings specified for the program that creates the map file for debag). If ide does not see breakpoints (red circle without a check mark), then in debug mode, in the Scripts tab, right-click on this file and select SpecifyLocalPath from the menu.
If everything is okay, then breakpoint will be ticked.
Thus, we get the full power of debugging javascripta in ide “without leaving the cashier”.
For further reading I recommend:
- As already mentioned, a good article on Habré about debugging js in chrome;
- Official JetBrains documentation to javascript supported by minifiers ;
- If someone does not know what Gulp is, you can read about it here ;
- For those who do not know what npm is, there is a link .
Perhaps in small projects this is not necessary, but in large projects there is nowhere, especially if you use the MVC framework and / or a bunch of self-written code.
On Habré there is already a good article on the topic of debugging js using the map file in chrome - "Introduction to Javascript Source Maps" . But if you work in the development environment, especially if this environment is from JetBrains, then it’s somehow wrong to get into chrome (although, of course, this is a very holivar topic). Therefore, I decided to write this article.
')
So let's get started.
First, to debug in IntelliJ IDEA / PHPStorm / WebStorm you will need GoogleChrome with plug-ins from JetBrains.
Further there are several options:
The first option is via ide and UglifyJS / YUI Compressor / ClosureCompiler
I did it through UglifyJS and therefore it will be in the example.
To do this, install the npm package uglify-js with a global key.
npm install uglify-js -g Next, go to File-> Settings-> Tools-> FileWatchers (if FileWatchers is not installed, then install it via plugins). Right click '+' and select UglifyJS in the drop-down menu:
If everything is okay, then the program will find .cmdUglifyJS itself, if not, then you have to manually register it
On Windows it will be: C: \ Users \ UsersName \ AppData \ Roaming \ npm \ uglifyjs.cmd.
Then in 'Arguments:' we set the necessary arguments, including the arguments for creating the map file , according to the documentation .
Now ide will follow the specified js-files and create the map files itself.
The second option is via gulp, grunt, browserify, etc.
Since I use gulp, I will give an example on it.
I will not describe the settings in detail, because on this topic and so many articles, just give an example of the grip file code that I use:
var gulp = require('gulp'); var sourcemaps = require('gulp-sourcemaps'); var uglify = require('gulp-uglify'); var rename = require('gulp-rename'); var concat = require('gulp-concat'); gulp.task('react', function(){ return gulp.src('www/js/*.js') .pipe(sourcemaps.init()) .pipe(concat('main.js')) .pipe(uglify()) .pipe(rename({ suffix: ".min" })) .pipe(sourcemaps.write('../maps')) .pipe(gulp.dest('www/js/main/')); }); In this example, we use gulp-sourcemaps to create a map file, gulp-concat to concatenate files, gulp-uglify to minify, and gulp-rename to add the min suffix.
Once you have decided on the option of creating a map file for the project, proceed to the debager settings in the IDE
Click on the drop-down menu of the debugger and select 'EditConfigurations ...'
In the appeared window, in the upper left corner we press '+' and in the appeared drop-down list we select JavaScriptDebug.
In the debugger setup window, in the Name line we write the name of the task, in the URL we write, or the address of the site that will debug javascript, or the local directory / html file, which will open in the browser when debugging starts (I prefer to work with the site address). In the Browser: drop-down menu, select the browser that will open when you start debug.
If you set the url in the URL field, then the 'RemoteURLsoflocalfiles (optional):' field will appear, where you can specify the root folder of this url and the virtual address of the debugs files. (since your files will be written opposite your files / map / file.js)
This is my example. You will have instead of .jsx just .js.
Now that everything is ready, click on the bug:
If everything is ok, then the browser will open at the specified address with the pop-up window “JetBrains IDE Support Debugs this Tab” (do not close this window during debugging, as the connection with ide will be broken immediately). In the debug window that opens, in the Scripts tab, you will be able to see your js files, in which you need to set breakpoints (most likely, they will have an address: your_sayt.ru / map / file.js, but it can be different, because the address where the source js files will be created virtually depends on the settings specified for the program that creates the map file for debag). If ide does not see breakpoints (red circle without a check mark), then in debug mode, in the Scripts tab, right-click on this file and select SpecifyLocalPath from the menu.
If everything is okay, then breakpoint will be ticked.
Thus, we get the full power of debugging javascripta in ide “without leaving the cashier”.
For further reading I recommend:
- As already mentioned, a good article on Habré about debugging js in chrome;
- Official JetBrains documentation to javascript supported by minifiers ;
- If someone does not know what Gulp is, you can read about it here ;
- For those who do not know what npm is, there is a link .
Source: https://habr.com/ru/post/255837/
All Articles