SQL Language Tutorial (DDL, DML) on the example of MS SQL Server dialect. Part three
Previous parts
- Part One - habrahabr.ru/post/255361
- Part Two - habrahabr.ru/post/255523
What will be discussed in this part
In this part we will introduce:
- with a CASE expression that allows conditional expressions to be included in the query;
- with aggregate functions that allow you to get all sorts of totals (aggregated values) calculated on the basis of detailed data obtained by the operator "SELECT ... WHERE ...";
- with the GROUP BY clause, which, along with aggregate functions, allows you to get totals for detailed data by groups;
- with the HAVING clause, which allows filtering by grouped data.
CASE expression is a conditional operator of the SQL language
This operator allows you to check the conditions and return, depending on the fulfillment of a particular condition, a particular result.
')
The CASE operator has 2 forms:
| The first form: | The second form: |
|---|---|
| CASE WHEN condition_1 THEN return_value_1 ... WHEN condition_N THEN return_value_N [ELSE return_value] END | CASE check_value WHEN compare_value_1 THEN return_value_1 ... WHEN Compare_Name THEN return_value_N [ELSE return_value] END |
Here, expressions can also act as values.
Let us consider an example of the first form CASE:
SELECT ID,Name,Salary, CASE WHEN Salary>=3000 THEN ' >= 3000' WHEN Salary>=2000 THEN '2000 <= < 3000' ELSE ' < 2000' END SalaryTypeWithELSE, CASE WHEN Salary>=3000 THEN ' >= 3000' WHEN Salary>=2000 THEN '2000 <= < 3000' END SalaryTypeWithoutELSE FROM Employees | ID | Name | Salary | SalaryTypeWithELSE | SalaryTypeWithoutELSE |
|---|---|---|---|---|
| 1000 | Ivanov I.I. | 5000 | ZP> = 3000 | ZP> = 3000 |
| 1001 | Petrov P.P. | 1500 | ZP <2000 | Null |
| 1002 | Sidorov S.S. | 2500 | 2000 <= ZP <3000 | 2000 <= ZP <3000 |
| 1003 | Andreev A.A. | 2000 | 2000 <= ZP <3000 | 2000 <= ZP <3000 |
| 1004 | Nikolaev N.N. | 1500 | ZP <2000 | Null |
| 1005 | Aleksandrov A.A. | 2000 | 2000 <= ZP <3000 | 2000 <= ZP <3000 |
WHEN conditions are checked sequentially, from top to bottom. When the first condition satisfies, the further check is interrupted and the value specified after the word THEN related to the WHEN block is returned.
If none of the WHEN conditions is fulfilled, the value specified after the word ELSE is returned (which in this case means “OTHER RETURN ...”).
If the ELSE block is not specified and no WHEN condition is met, then NULL is returned.
In both the first and second forms, the ELSE block goes at the very end of the CASE construction, i.e. after all when conditions.
Let us consider an example of the second form CASE:
Suppose we decided to reward all employees for the new year and asked to calculate the bonus amount according to the following scheme:
- Employees of the IT department to issue 15% of the salary;
- Accounting staff at 10% of the RFP;
- All the rest of 5% of the RFP.
Use the query with the CASE expression for this task:
SELECT ID,Name,Salary,DepartmentID, -- CASE DepartmentID -- WHEN 2 THEN '10%' -- 10% WHEN 3 THEN '15%' -- 15% - ELSE '5%' -- 5% END NewYearBonusPercent, -- CASE, Salary/100* CASE DepartmentID WHEN 2 THEN 10 -- 10% WHEN 3 THEN 15 -- 15% - ELSE 5 -- 5% END BonusAmount FROM Employees | ID | Name | Salary | DepartmentID | NewYearBonusPercent | BonusAmount |
|---|---|---|---|---|---|
| 1000 | Ivanov I.I. | 5000 | one | five% | 250 |
| 1001 | Petrov P.P. | 1500 | 3 | 15% | 225 |
| 1002 | Sidorov S.S. | 2500 | 2 | ten% | 250 |
| 1003 | Andreev A.A. | 2000 | 3 | 15% | 300 |
| 1004 | Nikolaev N.N. | 1500 | 3 | 15% | 225 |
| 1005 | Aleksandrov A.A. | 2000 | Null | five% | 100 |
This is a sequential check of the DepartmentID value with WHEN values. When the first DepartmentID with the WHEN value is reached, the check is interrupted and the value returned after the word THEN for the WHEN block is returned.
Accordingly, the value of the ELSE block is returned if the DepartmentID does not match any WHEN value.
If the ELSE block is absent, then in case of a DepartmentID mismatch, none of the WHEN values will be returned NULL.
It is easy to present the second CASE form using the first form:
SELECT ID,Name,Salary,DepartmentID, CASE WHEN DepartmentID=2 THEN '10%' -- 10% WHEN DepartmentID=3 THEN '15%' -- 15% - ELSE '5%' -- 5% END NewYearBonusPercent, -- CASE, Salary/100* CASE WHEN DepartmentID=2 THEN 10 -- 10% WHEN DepartmentID=3 THEN 15 -- 15% - ELSE 5 -- 5% END BonusAmount FROM Employees So, the second form is just a simplified notation for those cases where we need to make a comparison for equality of the same checked value with each WHEN value / expression.
Note. The first and second forms of CASE are part of the standard SQL language, so most likely they should be applicable in many DBMSs.
With MS SQL version 2012, a simplified IIF notation appeared. It can be used to simplify the CASE construction record, in case only 2 values are returned. The design of the IIF is as follows:
IIF(, true_, false_) Those. in essence, this is a wrapper for the following CASE construction:
CASE WHEN THEN true_ ELSE false_ END Let's look at an example:
SELECT ID,Name,Salary, IIF(Salary>=2500,' >= 2500',' < 2500') DemoIIF, CASE WHEN Salary>=2500 THEN ' >= 2500' ELSE ' < 2500' END DemoCASE FROM Employees CASE, IIF constructs can be nested in each other. Consider an abstract example:
SELECT ID,Name,Salary, CASE WHEN DepartmentID IN(1,2) THEN 'A' WHEN DepartmentID=3 THEN CASE PositionID -- CASE WHEN 3 THEN 'B-1' WHEN 4 THEN 'B-2' END ELSE 'C' END Demo1, IIF(DepartmentID IN(1,2),'A', IIF(DepartmentID=3,CASE PositionID WHEN 3 THEN 'B-1' WHEN 4 THEN 'B-2' END,'C')) Demo2 FROM Employees Since the CASE and IIF constructs are expressions that return a result, we can use them not only in the SELECT block, but also in other blocks that allow the use of expressions, for example, in WHERE or ORDER BY blocks.
For example, let us set a task - to create a list for issuing a salary certificate, as follows:
- First of all, the RFP should receive employees from whom the salary is less than 2500
- Those employees who have a salary greater than or equal to 2500, receive an RFP secondarily
- Within these two groups, you need to sort the lines by name (field Name)
Let's try to solve this problem by adding a CASE expression to the ORDER BY block:
SELECT ID,Name,Salary FROM Employees ORDER BY CASE WHEN Salary>=2500 THEN 1 ELSE 0 END, -- 2500 Name -- | ID | Name | Salary |
|---|---|---|
| 1005 | Aleksandrov A.A. | 2000 |
| 1003 | Andreev A.A. | 2000 |
| 1004 | Nikolaev N.N. | 1500 |
| 1001 | Petrov P.P. | 1500 |
| 1000 | Ivanov I.I. | 5000 |
| 1002 | Sidorov S.S. | 2500 |
As we see, Ivanov and Sidorov will be the last to leave work.
And an abstract example of using CASE in the WHERE clause:
SELECT ID,Name,Salary FROM Employees WHERE CASE WHEN Salary>=2500 THEN 1 ELSE 0 END=1 -- 1 You can try to remake the last 2 examples with the IIF function.
And finally, remember once again about NULL-values:
SELECT ID,Name,Salary,DepartmentID, CASE WHEN DepartmentID=2 THEN '10%' -- 10% WHEN DepartmentID=3 THEN '15%' -- 15% - WHEN DepartmentID IS NULL THEN '-' -- ( IS NULL) ELSE '5%' -- 5% END NewYearBonusPercent1, -- NULL , NULL CASE DepartmentID -- WHEN 2 THEN '10%' WHEN 3 THEN '15%' WHEN NULL THEN '-' -- !!! CASE ELSE '5%' END NewYearBonusPercent2 FROM Employees | ID | Name | Salary | DepartmentID | NewYearBonusPercent1 | NewYearBonusPercent2 |
|---|---|---|---|---|---|
| 1000 | Ivanov I.I. | 5000 | one | five% | five% |
| 1001 | Petrov P.P. | 1500 | 3 | 15% | 15% |
| 1002 | Sidorov S.S. | 2500 | 2 | ten% | ten% |
| 1003 | Andreev A.A. | 2000 | 3 | 15% | 15% |
| 1004 | Nikolaev N.N. | 1500 | 3 | 15% | 15% |
| 1005 | Aleksandrov A.A. | 2000 | Null | - | five% |
Of course, you could rewrite something like this:
SELECT ID,Name,Salary,DepartmentID, CASE ISNULL(DepartmentID,-1) -- NULL -1 WHEN 2 THEN '10%' WHEN 3 THEN '15%' WHEN -1 THEN '-' -- , ID (-1) ELSE '5%' END NewYearBonusPercent3 FROM Employees In general, the flight of fancy in this case is not limited.
For example, let's see how using the CASE and IIF you can simulate the function ISNULL:
SELECT ID,Name,LastName, ISNULL(LastName,' ') DemoISNULL, CASE WHEN LastName IS NULL THEN ' ' ELSE LastName END DemoCASE, IIF(LastName IS NULL,' ',LastName) DemoIIF FROM Employees The CASE construct is a very powerful tool in the SQL language, which allows you to impose additional logic to calculate the values of the result set. In this part, possession of the CASE-construction is still useful to us, therefore, in this part, first of all, attention is paid to it.
Aggregate functions
Here we consider only the main and most frequently used aggregate functions:
| Title | Description |
|---|---|
| COUNT (*) | Returns the number of rows received by the "SELECT ... WHERE ..." statement. In the absence of WHERE, the number of all records in the table. |
| COUNT (column / expression) | Returns the number of values (not equal to NULL) in the specified column / expression |
| COUNT (DISTINCT column / expression) | Returns the number of unique values that are not equal to NULL in the specified column / expression |
| SUM (column / expression) | Returns the sum of column / expression values. |
| AVG (column / expression) | Returns the average of the column / expression values. NULL values for counting are not counted. |
| MIN (column / expression) | Returns the minimum value by column / expression value |
| MAX (column / expression) | Returns the maximum value by column / expression values |
Aggregate functions allow us to make the calculation of the total value for a set of rows obtained using the SELECT statement.
Consider each function by example:
SELECT COUNT(*) [ - ], COUNT(DISTINCT DepartmentID) [ ], COUNT(DISTINCT PositionID) [ ], COUNT(BonusPercent) [- % ], MAX(BonusPercent) [ ], MIN(BonusPercent) [ ], SUM(Salary/100*BonusPercent) [ ], AVG(Salary/100*BonusPercent) [ ], AVG(Salary) [ ] FROM Employees | Total number of employees | The number of unique departments | The number of unique posts | Number of employees who have% bonus | Maximum bonus percentage | Min Bonus Percentage | The sum of all bonuses | Average bonus size | Average size of salary |
|---|---|---|---|---|---|---|---|---|
| 6 | 3 | four | 3 | 50 | 15 | 3325 | 1108.33333333333 | 2416.66666666667 |
For greater clarity, I decided to make an exception here and used the syntax [...] to set the aliases of the columns.
Let us analyze how each returned value is obtained, and for one thing we recall the constructions of the basic syntax of the SELECT statement.
First, because we did not specify WHERE conditions in the query, then the totals will be considered for the detailed data that is obtained by the query:
SELECT * FROM Employees those. for all rows in the Employees table.
For clarity, select only the fields and expressions that are used in the aggregate functions:
SELECT DepartmentID, PositionID, BonusPercent, Salary/100*BonusPercent [Salary/100*BonusPercent], Salary FROM Employees | DepartmentID | PositionID | BonusPercent | Salary / 100 * BonusPercent | Salary |
|---|---|---|---|---|
| one | 2 | 50 | 2500 | 5000 |
| 3 | 3 | 15 | 225 | 1500 |
| 2 | one | Null | Null | 2500 |
| 3 | four | thirty | 600 | 2000 |
| 3 | 3 | Null | Null | 1500 |
| Null | Null | Null | Null | 2000 |
This is the initial data (detailed lines), according to which the results of the aggregated query will be considered.
Now analyze each aggregated value:
COUNT (*) - because we did not specify the filter conditions in the WHERE clause in the query, then COUNT (*) gave us the total number of records in the table, i.e. this is the number of lines returned by the query: 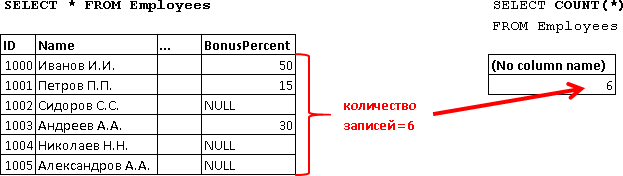 |
COUNT (DISTINCT DepartmentID) - returned to us the value of 3, i.e. This number corresponds to the number of unique department values indicated in the DepartmentID column without taking null values into account. Go through the values of the DepartmentID column and color the same values in one color (feel free to learn all the methods for learning):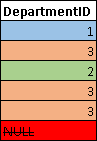 We throw away NULL, after which, we got 3 unique values (1, 2 and 3). Those. the value obtained by COUNT (DISTINCT DepartmentID), in expanded form, can be represented by the following sample: 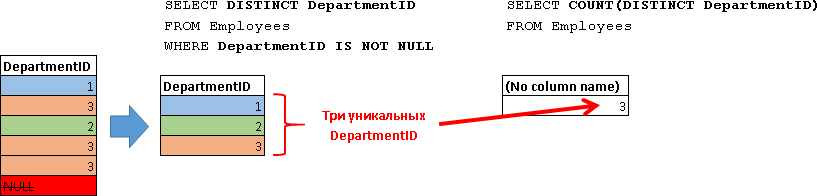 |
COUNT (DISTINCT PositionID) - the same thing that was said about COUNT (DISTINCT DepartmentID), only to the PositionID field. We look at the values of the PositionID column and do not regret the colors: |
COUNT (BonusPercent) - returns the number of rows that have the BonusPercent value, i.e. counts the number of entries for which BonusPercent IS NOT NULL. Here it will be easier for us, because no need to read unique values, just drop the records with NULL values. Take the values of the BonusPercent column and cross out all NULL values: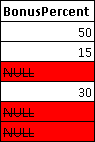 There are 3 values left. Those. In expanded form, the sample can be represented as follows: 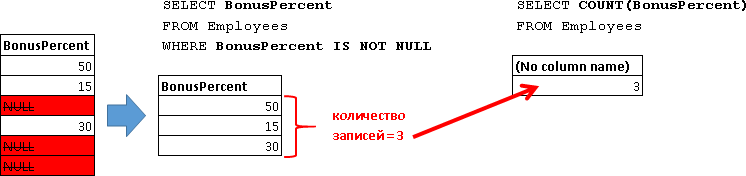 Since we did not use the words DISTINCT, then recurring BonusPercent, if any, without considering BonusPercent equal NULL, will be counted. For example, let's make a comparison of the result with and without DISTINCT. For greater clarity, we use the values of the DepartmentID field:  |
| MAX (BonusPercent) - returns the maximum value of BonusPercent, again without taking into account NULL values. We take the values of the BonusPercent column and look for the maximum value among them, we don’t pay attention to the NULL values: 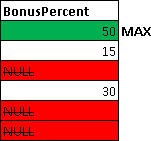 Those. we get the following value: |
MIN (BonusPercent) - returns the minimum BonusPercent value, again without null values. As in the case of MAX, we only look for the minimum value, ignoring NULL: Those. we get the following value: Visual presentation of MIN (BonusPercent) and MAX (BonusPercent): 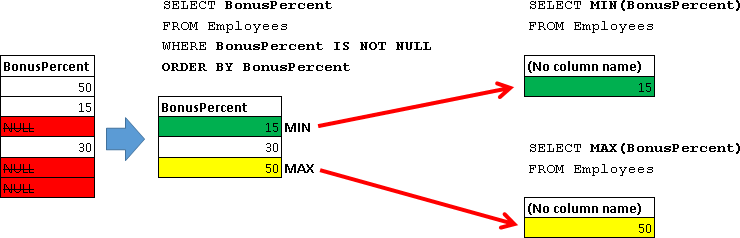 |
SUM (Salary / 100 * BonusPercent) - returns the sum of all non-NULL values. Parse the values of the expression (Salary / 100 * BonusPercent):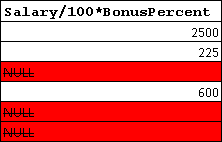 Those. the following values are summed up: 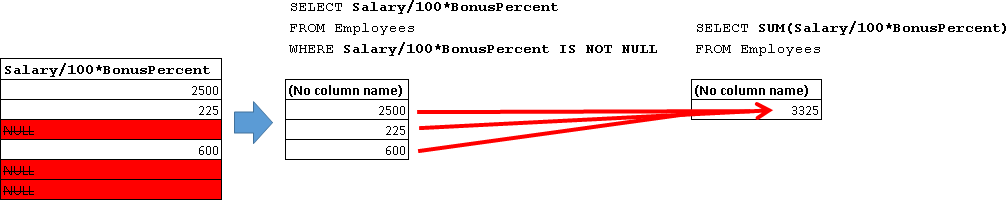 |
AVG (Salary / 100 * BonusPercent) - returns the average of the values. NULL expressions are not taken into account, i.e. this corresponds to the second expression: 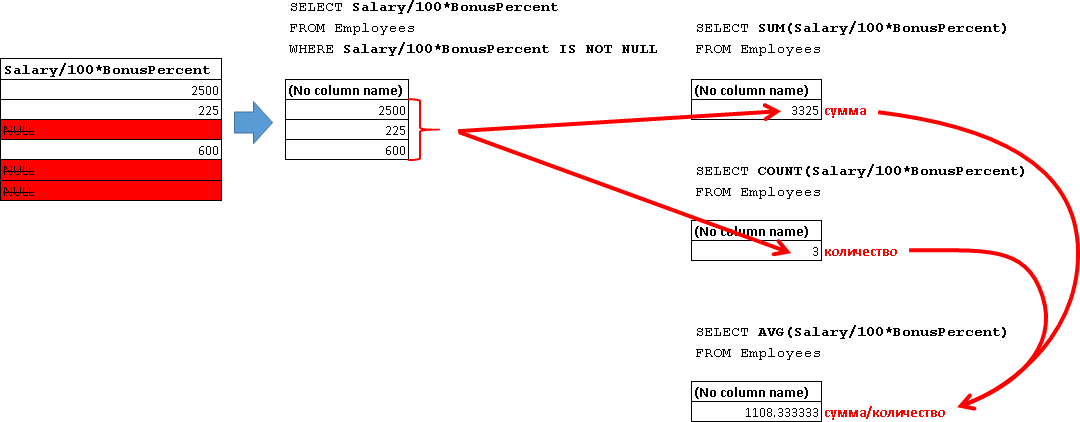 Those. again, NULL values are not taken into account when counting quantities. If you need to calculate the average for all employees, as in the third expression, which gives 554.166666666667, then use the preliminary conversion of NULL values to zero: |
| AVG (Salary) - in fact, here everything is the same as in the previous case, i.e. if the Salary employee is NULL, then he will not be taken into account. To account for all employees, respectively, do a preliminary conversion of NULL AVG values (ISNULL (Salary, 0)) |
Let's summarize some results:
- COUNT (*) - used to count the total number of rows that are received by the operator "SELECT ... WHERE ..."
- in all other above-mentioned aggregate functions when calculating the total, NULL values are not taken into account
- if we need to take into account all the lines, this is more relevant for the AVG function, then it is first necessary to process NULL values, for example, as shown above “AVG (ISNULL (Salary, 0))”
Accordingly, when specifying the additional condition in the WHERE block with the aggregate functions, only the totals that satisfy the condition in the rows will be calculated. Those. aggregate values are calculated for the result set, which is obtained using the SELECT clause. For example, let's do the same thing, but only in the context of the IT department:
SELECT COUNT(*) [ - ], COUNT(DISTINCT DepartmentID) [ ], COUNT(DISTINCT PositionID) [ ], COUNT(BonusPercent) [- % ], MAX(BonusPercent) [ ], MIN(BonusPercent) [ ], SUM(Salary/100*BonusPercent) [ ], AVG(Salary/100*BonusPercent) [ ], AVG(Salary) [ ] FROM Employees WHERE DepartmentID=3 -- - | Total number of employees | The number of unique departments | The number of unique posts | Number of employees who have% bonus | Maximum bonus percentage | Min Bonus Percentage | The sum of all bonuses | Average bonus size | Average size of salary |
|---|---|---|---|---|---|---|---|---|
| 3 | one | 2 | 2 | thirty | 15 | 825 | 412.5 | 1666.66666666667 |
I suggest you, for a greater understanding of the work of aggregate functions, to independently analyze each obtained value. Calculations here are, respectively, for detailed data received by the query:
SELECT DepartmentID, PositionID, BonusPercent, Salary/100*BonusPercent [Salary/100*BonusPercent], Salary FROM Employees WHERE DepartmentID=3 -- - | DepartmentID | PositionID | BonusPercent | Salary / 100 * BonusPercent | Salary |
|---|---|---|---|---|
| 3 | 3 | 15 | 225 | 1500 |
| 3 | four | thirty | 600 | 2000 |
| 3 | 3 | Null | Null | 1500 |
Go ahead. If the aggregate function returns NULL (for example, all employees do not have the Salary value), or there are no records in the sample, and in the report, for such a case we need to show 0, then the ISNULL function can wrap the aggregate expression:
SELECT SUM(Salary), AVG(Salary), -- ISNULL ISNULL(SUM(Salary),0), ISNULL(AVG(Salary),0) FROM Employees WHERE DepartmentID=10 -- , | (No column name) | (No column name) | (No column name) | (No column name) |
|---|---|---|---|
| Null | Null | 0 | 0 |
I believe that it is very important to understand the purpose of each aggregate function and how they calculate, because in SQL, this is the main tool for calculating totals.
In this case, we looked at how each aggregate function behaves independently, i.e. it was applied to the values of the entire record set obtained by the SELECT command. Next, we consider how the same functions are used to calculate the totals by groups, using the GROUP BY construct.
GROUP BY - data grouping
Before that, we already calculated the totals for a specific department, approximately as follows:
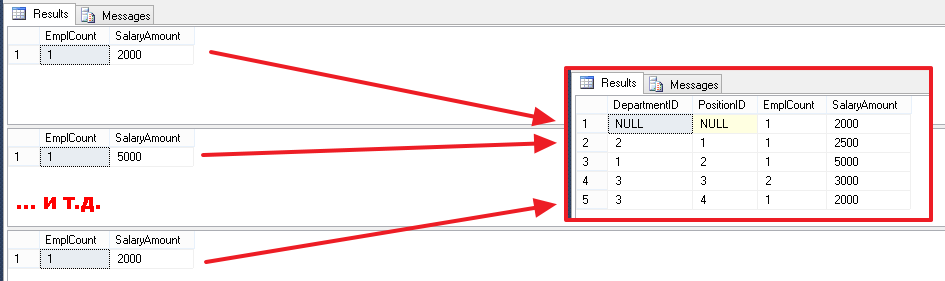
SELECT COUNT(DISTINCT PositionID) PositionCount, COUNT(*) EmplCount, SUM(Salary) SalaryAmount FROM Employees WHERE DepartmentID=3 -- Now imagine that we were asked to get the same figures in the context of each department. Of course, we can roll up our sleeves and fulfill the same request for each department. So, it is said, done, we write 4 requests:
SELECT '' Info, COUNT(DISTINCT PositionID) PositionCount, COUNT(*) EmplCount, SUM(Salary) SalaryAmount FROM Employees WHERE DepartmentID=1 -- SELECT '' Info, COUNT(DISTINCT PositionID) PositionCount, COUNT(*) EmplCount, SUM(Salary) SalaryAmount FROM Employees WHERE DepartmentID=2 -- SELECT '' Info, COUNT(DISTINCT PositionID) PositionCount, COUNT(*) EmplCount, SUM(Salary) SalaryAmount FROM Employees WHERE DepartmentID=3 -- SELECT '' Info, COUNT(DISTINCT PositionID) PositionCount, COUNT(*) EmplCount, SUM(Salary) SalaryAmount FROM Employees WHERE DepartmentID IS NULL -- As a result, we get 4 data sets:
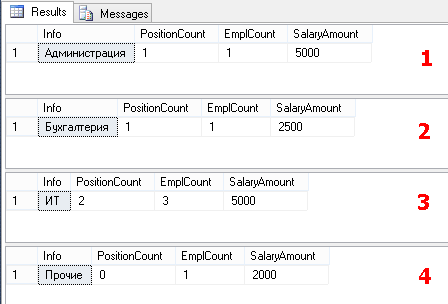
Please note that we can use the fields defined in the form of constants - "Administration", "Accounting", ...
In general, we extracted all the numbers we were asked for, merged everything into Excel and gave it to the director.
The director liked the report and he says: “add another column with information on the average salary”. And as always it needs to be done very urgently.
Hmm, what to do? In addition, let's imagine that we have not 3, but 15 departments.
This is just what the GROUP BY construct is about for such cases:
SELECT DepartmentID, COUNT(DISTINCT PositionID) PositionCount, COUNT(*) EmplCount, SUM(Salary) SalaryAmount, AVG(Salary) SalaryAvg -- FROM Employees GROUP BY DepartmentID | DepartmentID | Positioncount | Emplcount | Salaryamount | SalaryAvg |
|---|---|---|---|---|
| Null | 0 | one | 2000 | 2000 |
| one | one | one | 5000 | 5000 |
| 2 | one | one | 2500 | 2500 |
| 3 | 2 | 3 | 5000 | 1666.66666666667 |
We got all the same data, but now using only one request!
For now, do not pay attention, to the fact that the departments have been derived from us in the form of numbers, then we will learn to derive everything beautifully.
In the GROUP BY clause, you can specify several fields “GROUP BY field1, field2, ..., fieldN”, in this case the grouping will occur into groups that form the values of these fields “field1, field2, ..., fieldN”.
For example, let's group the data in the context of Departments and Positions:
SELECT DepartmentID,PositionID, COUNT(*) EmplCount, SUM(Salary) SalaryAmount FROM Employees GROUP BY DepartmentID,PositionID | DepartmentID | PositionID | Emplcount | Salaryamount |
|---|---|---|---|
| Null | Null | one | 2000 |
| 2 | one | one | 2500 |
| one | 2 | one | 5000 |
| 3 | 3 | 2 | 3000 |
| 3 | four | one | 2000 |
Let's now on this example, try to figure out how GROUP BY works
For the fields listed after GROUP BY from the Employees table, all unique combinations are defined by the DepartmentID and PositionID values, i.e. something like this happens:
SELECT DISTINCT DepartmentID,PositionID FROM Employees | DepartmentID | PositionID |
|---|---|
| Null | Null |
| one | 2 |
| 2 | one |
| 3 | 3 |
| 3 | four |
Then jogging is done for each combination and calculations of aggregate functions are done:
SELECT COUNT(*) EmplCount, SUM(Salary) SalaryAmount FROM Employees WHERE DepartmentID IS NULL AND PositionID IS NULL SELECT COUNT(*) EmplCount, SUM(Salary) SalaryAmount FROM Employees WHERE DepartmentID=1 AND PositionID=2 -- ... SELECT COUNT(*) EmplCount, SUM(Salary) SalaryAmount FROM Employees WHERE DepartmentID=3 AND PositionID=4 And then all these results are combined together and given to us in the form of one set:
From the main, it is worth noting that in the case of grouping (GROUP BY), in the list of columns in the SELECT block:
- We can only use the columns listed in the GROUP BY clause.
- You can use expressions with fields from the GROUP BY block.
- You can use constants, since they do not affect the result of grouping
- All other fields (not listed in the GROUP BY clause) can only be used with aggregate functions (COUNT, SUM, MIN, MAX, ...)
- It is not necessary to list all the columns from the GROUP BY block in the list of SELECT columns.
And a demonstration of all the above:
SELECT ' ' Const1, -- 1 Const2, -- -- CONCAT(' № ',DepartmentID) ConstAndGroupField, CONCAT(' № ',DepartmentID,', № ',PositionID) ConstAndGroupFields, DepartmentID, -- -- PositionID, -- , COUNT(*) EmplCount, -- - -- : COUNT, SUM, MIN, MAX, … SUM(Salary) SalaryAmount, MIN(ID) MinID FROM Employees GROUP BY DepartmentID,PositionID -- DepartmentID,PositionID | Const1 | Const2 | ConstAndGroupField | ConstAndGroupFields | DepartmentID | Emplcount | Salaryamount | MinID |
|---|---|---|---|---|---|---|---|
| String constant | one | Department number | Department number, Position number | Null | one | 2000 | 1005 |
| String constant | one | Department number 2 | Department number 2, Position number 1 | 2 | one | 2500 | 1002 |
| String constant | one | Department number 1 | Department number 1, Position number 2 | one | one | 5000 | 1000 |
| String constant | one | Department number 3 | Department number 3, Position number 3 | 3 | 2 | 3000 | 1001 |
| String constant | one | Department number 3 | Department number 3, Position number 4 | 3 | one | 2000 | 1003 |
It is also worth noting that grouping can be done not only by fields, but also by expressions. For example, group the data by employee, by year of birth:
SELECT CONCAT(' - ',YEAR(Birthday)) YearOfBirthday, COUNT(*) EmplCount FROM Employees GROUP BY YEAR(Birthday) Consider an example with a more complex expression. For example, we get the gradation of employees by year of birth:
SELECT CASE WHEN YEAR(Birthday)>=2000 THEN ' 2000' WHEN YEAR(Birthday)>=1990 THEN '1999-1990' WHEN YEAR(Birthday)>=1980 THEN '1989-1980' WHEN YEAR(Birthday)>=1970 THEN '1979-1970' WHEN Birthday IS NOT NULL THEN ' 1970' ELSE ' ' END RangeName, COUNT(*) EmplCount FROM Employees GROUP BY CASE WHEN YEAR(Birthday)>=2000 THEN ' 2000' WHEN YEAR(Birthday)>=1990 THEN '1999-1990' WHEN YEAR(Birthday)>=1980 THEN '1989-1980' WHEN YEAR(Birthday)>=1970 THEN '1979-1970' WHEN Birthday IS NOT NULL THEN ' 1970' ELSE ' ' END | RangeName | Emplcount |
|---|---|
| 1979-1970 | one |
| 1989-1980 | 2 |
| not specified | 2 |
| earlier 1970 | one |
Those. in this case, the grouping is done according to a previously calculated CASE-expression for each employee:
SELECT ID, CASE WHEN YEAR(Birthday)>=2000 THEN ' 2000' WHEN YEAR(Birthday)>=1990 THEN '1999-1990' WHEN YEAR(Birthday)>=1980 THEN '1989-1980' WHEN YEAR(Birthday)>=1970 THEN '1979-1970' WHEN Birthday IS NOT NULL THEN ' 1970' ELSE ' ' END FROM Employees 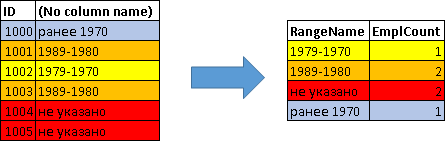
And of course you can combine expressions with fields in the GROUP BY block:
SELECT DepartmentID, CONCAT(' - ',YEAR(Birthday)) YearOfBirthday, COUNT(*) EmplCount FROM Employees GROUP BY YEAR(Birthday),DepartmentID -- SELECT ORDER BY DepartmentID,YearOfBirthday -- . , , , . , Excel , , , :
SELECT CASE DepartmentID WHEN 1 THEN '' WHEN 2 THEN '' WHEN 3 THEN '' ELSE '' END Info, COUNT(DISTINCT PositionID) PositionCount, COUNT(*) EmplCount, SUM(Salary) SalaryAmount, AVG(Salary) SalaryAvg -- FROM Employees GROUP BY DepartmentID ORDER BY Info -- Info | Info | PositionCount | EmplCount | SalaryAmount | SalaryAvg |
|---|---|---|---|---|
| Administration | one | one | 5000 | 5000 |
| Accounting | one | one | 2500 | 2500 |
| IT | 2 | 3 | 5000 | 1666.66666666667 |
| Other | 0 | one | 2000 | 2000 |
Although from the side it may look scary, but still it is better than it was originally. The disadvantage is that if they start a new department and its employees, then we will need to add CASE to prevent the employees of the new department from falling into the “Others” group.
But nothing, over time, we will learn to do everything beautifully so that the sample does not depend on the appearance of new data in the database, but is dynamic. A little ahead, to show to write what requests we are striving to come:
SELECT ISNULL(dep.Name,'') DepName, COUNT(DISTINCT emp.PositionID) PositionCount, COUNT(*) EmplCount, SUM(emp.Salary) SalaryAmount, AVG(emp.Salary) SalaryAvg -- FROM Employees emp LEFT JOIN Departments dep ON emp.DepartmentID=dep.ID GROUP BY emp.DepartmentID,dep.Name ORDER BY DepName , – . GROUP BY.
, GROUP BY.
, , , :
SELECT DepartmentID, SUM(CASE WHEN PositionID=1 THEN Salary END) [], SUM(CASE WHEN PositionID=2 THEN Salary END) [], SUM(CASE WHEN PositionID=3 THEN Salary END) [], SUM(CASE WHEN PositionID=4 THEN Salary END) [ ], SUM(Salary) [ ] FROM Employees GROUP BY DepartmentID | DepartmentID | Programmers | ||||
|---|---|---|---|---|---|
| Null | Null | Null | Null | Null | 2000 |
| one | Null | 5000 | Null | Null | 5000 |
| 2 | 2500 | Null | Null | Null | 2500 |
| 3 | Null | Null | 3000 | 2000 | 5000 |
Those. .
IIF:
SELECT DepartmentID, SUM(IIF(PositionID=1,Salary,NULL)) [], SUM(IIF(PositionID=2,Salary,NULL)) [], SUM(IIF(PositionID=3,Salary,NULL)) [], SUM(IIF(PositionID=4,Salary,NULL)) [ ], SUM(Salary) [ ] FROM Employees GROUP BY DepartmentID IIF NULL, .
CASE ELSE, NULL. , .
, NULL .
, :
SELECT DepartmentID, CASE WHEN PositionID=1 THEN Salary END [], CASE WHEN PositionID=2 THEN Salary END [], CASE WHEN PositionID=3 THEN Salary END [], CASE WHEN PositionID=4 THEN Salary END [ ], Salary [ ] FROM Employees | DepartmentID | Programmers | ||||
|---|---|---|---|---|---|
| one | Null | 5000 | Null | Null | 5000 |
| 3 | Null | Null | 1500 | Null | 1500 |
| 2 | 2500 | Null | Null | Null | 2500 |
| 3 | Null | Null | Null | 2000 | 2000 |
| 3 | Null | Null | 1500 | Null | 1500 |
| Null | Null | Null | Null | Null | 2000 |
, NULL , , . For example:
SELECT DepartmentID, ISNULL(SUM(IIF(PositionID=1,Salary,NULL)),0) [], ISNULL(SUM(IIF(PositionID=2,Salary,NULL)),0) [], ISNULL(SUM(IIF(PositionID=3,Salary,NULL)),0) [], ISNULL(SUM(IIF(PositionID=4,Salary,NULL)),0) [ ], ISNULL(SUM(Salary),0) [ ] FROM Employees GROUP BY DepartmentID | DepartmentID | Programmers | ||||
|---|---|---|---|---|---|
| Null | 0 | 0 | 0 | 0 | 2000 |
| one | 0 | 5000 | 0 | 0 | 5000 |
| 2 | 2500 | 0 | 0 | 0 | 2500 |
| 3 | 0 | 0 | 3000 | 2000 | 5000 |
, :
- , , CASE DepartmentID SELECT
- ORDER BY
GROUP BY, mean with aggregate functions, is one of the fixed assets used to obtain summary data from the database, because data is usually used in this form, because usually we are required to provide summary reports, rather than detailed data (sheets). And of course, it all revolves around the knowledge of the basic design, because Before you summarize (aggregate) something, you first need to select it correctly, using "SELECT ... WHERE ...".
Practice has an important place here, so if you set a goal to understand the SQL language, do not learn, but understand - practice, practice and practice, going through the most varied options that you can think of.
At the initial pores, if you are not sure of the correctness of the aggregated data obtained, make a detailed sample, including all the values for which the aggregation takes place. And check the correctness of the calculations manually for these detailed data. In this case, using Excel can help a lot.
Let's say you got to this point
Suppose you are an accountant Sidorov S.S., who decided to learn how to write SELECT queries.
Assume that you have already finished reading this textbook up to this point, and are already confident in using all the above basic structures, i.e. you can:
- Select detailed data for the WHERE clause from a single table
- Know how to use aggregate functions and grouping from one table.
Since at work they thought that you already knew everything, you were given access to the database (and this sometimes happens), and now you have developed and pulled out that same weekly report for the director.
Yes, but they did not take into account that you are not yet able to build queries from several tables, but only from one, i.e. you can't do something like this:
SELECT emp.*, -- Employees dep.Name DepartmentName, -- Name Departments pos.Name PositionName -- Name Positions FROM Employees emp LEFT JOIN Departments dep ON emp.DepartmentID=dep.ID LEFT JOIN Positions pos ON emp.PositionID=pos.ID | ID | Name | Birthday | ... | Salary | BonusPercent | DepartmentName | PositionName |
|---|---|---|---|---|---|---|---|
| 1000 | Ivanov I.I. | 02/19/1955 | 5000 | 50 | Administration | Director | |
| 1001 | Petrov P.P. | 12/03/1983 | 1500 | 15 | IT | Programmer | |
| 1002 | Sidorov S.S. | 06/07/1976 | 2500 | Null | Accounting | Accountant | |
| 1003 | Andreev A.A. | 04/17/1982 | 2000 | thirty | IT | Senior programmer | |
| 1004 | Nikolaev N.N. | Null | 1500 | Null | IT | Programmer | |
| 1005 | Aleksandrov A.A. | Null | 2000 | Null | Null | Null |
, , , , , .
, ?! – , , .. .., .. .., - (VIEW «», , , ), Employees, « » « », , ..
Since , -, , , , ViewEmployeesInfo.
, , .. -:
CREATE VIEW ViewEmployeesInfo AS SELECT emp.*, -- Employees dep.Name DepartmentName, -- Name Departments pos.Name PositionName -- Name Positions FROM Employees emp LEFT JOIN Departments dep ON emp.DepartmentID=dep.ID LEFT JOIN Positions pos ON emp.PositionID=pos.ID Those. , , , - «ViewEmployeesInfo», (.. ).
, :
SELECT * FROM ViewEmployeesInfo | ID | Name | Birthday | ... | Salary | BonusPercent | DepartmentName | PositionName |
|---|---|---|---|---|---|---|---|
| 1000 | Ivanov I.I. | 19.02.1955 | 5000 | 50 | Administration | Director | |
| 1001 | .. | 03.12.1983 | 1500 | 15 | IT | Programmer | |
| 1002 | .. | 07.06.1976 | 2500 | Null | Accounting | Accountant | |
| 1003 | .. | 17.04.1982 | 2000 | thirty | IT | Senior programmer | |
| 1004 | .. | Null | 1500 | Null | IT | Programmer | |
| 1005 | .. | Null | 2000 | Null | Null | Null |
Since «» (- ), :
SELECT DepartmentName, COUNT(DISTINCT PositionID) PositionCount, COUNT(*) EmplCount, SUM(Salary) SalaryAmount, AVG(Salary) SalaryAvg FROM ViewEmployeesInfo emp GROUP BY DepartmentID,DepartmentName ORDER BY DepartmentName | DepartmentName | PositionCount | EmplCount | SalaryAmount | SalaryAvg |
|---|---|---|---|---|
| Null | 0 | one | 2000 | 2000 |
| Administration | one | one | 5000 | 5000 |
| Accounting | one | one | 2500 | 2500 |
| IT | 2 | 3 | 5000 | 1666.66666666667 |
, , , .. , .
Those. , , ( ViewEmployeesInfo), . -, DepartmentName PositionName . Those. , , , Employees.
, , ( ):
SELECT ID, Name, Salary FROM ViewEmployeesInfo WHERE Salary IS NOT NULL AND Salary>0 ORDER BY Name | ID | Name | Salary |
|---|---|---|
| 1005 | .. | 2000 |
| 1003 | .. | 2000 |
| 1000 | Ivanov I.I. | 5000 |
| 1004 | .. | 1500 |
| 1001 | .. | 1500 |
| 1002 | .. | 2500 |
, .
, , SELECT-. , ( , OLAP, OLAP- ).
. SQL , , .
, , SQL , . , , .
HAVING –
, , , HAVING . HAVING – - WHERE, WHERE- , HAVING- . HAVING , , , .
Consider an example:
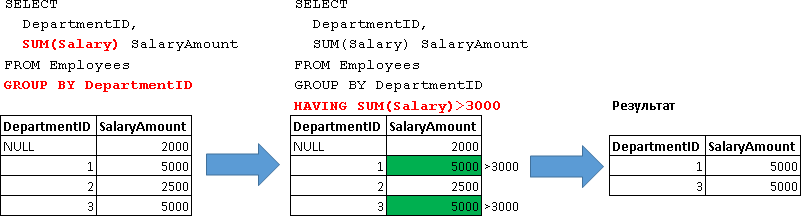
SELECT DepartmentID, SUM(Salary) SalaryAmount FROM Employees GROUP BY DepartmentID HAVING SUM(Salary)>3000 | DepartmentID | SalaryAmount |
|---|---|
| one | 5000 |
| 3 | 5000 |
Those. , 3000, .. «SUM(Salary)>3000».
Those. :
SELECT DepartmentID, SUM(Salary) SalaryAmount FROM Employees GROUP BY DepartmentID -- 1. HAVING:
SELECT DepartmentID, SUM(Salary) SalaryAmount FROM Employees GROUP BY DepartmentID -- 1. HAVING SUM(Salary)>3000 -- 2. HAVING- AND, OR NOT:
SELECT DepartmentID, SUM(Salary) SalaryAmount FROM Employees GROUP BY DepartmentID HAVING SUM(Salary)>3000 AND COUNT(*)<2 -- 2- 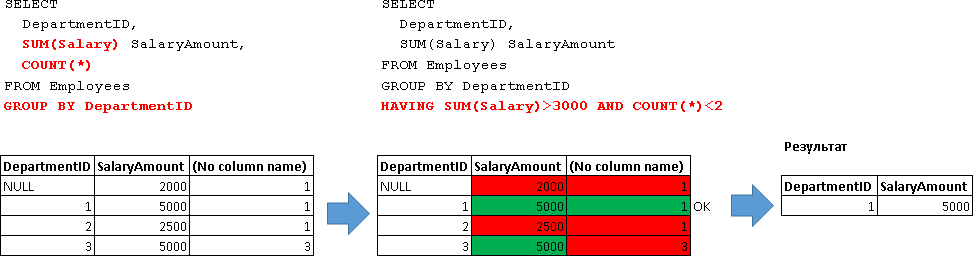
(. «COUNT(*)») HAVING.
, HAVING-:
SELECT DepartmentID FROM Employees GROUP BY DepartmentID HAVING SUM(Salary)>3000 AND COUNT(*)<2 -- 2- HAVING- GROUP BY:
SELECT DepartmentID, SUM(Salary) SalaryAmount FROM Employees GROUP BY DepartmentID -- 1. HAVING DepartmentID=3 -- 2. , .. WHERE-:
SELECT DepartmentID, SUM(Salary) SalaryAmount FROM Employees WHERE DepartmentID=3 -- 1. GROUP BY DepartmentID -- 2. Those. 3, .
Note. , , - .
, HAVING- .
Let's sum up
:
| / | Execution order | |
|---|---|---|
| SELECT | four | |
| FROM | 0 | |
| WHERE | one | , |
| GROUP BY | 2 | . , SELECT HAVING |
| HAVING | 3 | , |
| ORDER BY | five |
, DISTINCT TOP, .
:
SELECT TOP 1 -- 6. SUM(Salary) SalaryAmount FROM Employees GROUP BY DepartmentID HAVING SUM(Salary)>3000 ORDER BY DepartmentID -- 5. | SalaryAmount |
|---|
| 5000 |
SELECT DISTINCT -- SalaryAmount SUM(Salary) SalaryAmount FROM Employees GROUP BY DepartmentID | SalaryAmount |
|---|
| 2000 |
| 2500 |
| 5000 |
.
Conclusion
– .
, , . , , .. – , , , .
, . ( ) . SELECT ( , , – , , ..).
, SQL, :
- GROUP BY ROLLUP(…), GROUP BY GROUPING SETS(…), …
- PIVOT, UNPIVOT
- etc.
, .. , SQL, . SQL - , .. ( ).
SQL, , , .. , , . , SQL, .. . – , () .
SQL.
Part Four - habrahabr.ru/post/256045
Source: https://habr.com/ru/post/255825/
All Articles