Centralized collection of Windows event logs, without installing an agent, followed by visualization using ELK
The task of centralized processing of logs is quite simply formulated and arises when it is necessary to monitor the work of a large number of servers. I think it is not worth mentioning that from logs you can get a lot of information about the vital activity and well-being of systems. The fact that writing and reading logs is just as important as being able to write programs.
Accordingly, for the implementation of such a system, the administrator is tasked with: firstly, how to collect these logs, secondly, how to work with them conveniently and centrally. Thanks to a sufficiently developed bundle of ELK (Elasticsearch + Logstash + Kibana), more than once described on Habré, the administrator has the tools to easily search and display all the information present in the logs. Therefore, the answer to the second problem exists initially, and it remains only to solve the problem of collecting logs.
Since, in my case, the requirement for the system was the lack of a client on the servers, and the fact that the logs needed to be pulled from Windows servers, the powershell was chosen as the native Windows tool.
Based on this, the following model for collecting and displaying information from logs was compiled: logs are remotely collected from the powershell script servers, and then stored as files in the storage, then using ELK (Elasticsearch + Logstash + Kibana) they are processed and displayed.
')
An example of the operation of the entire bundle is shown in the image:
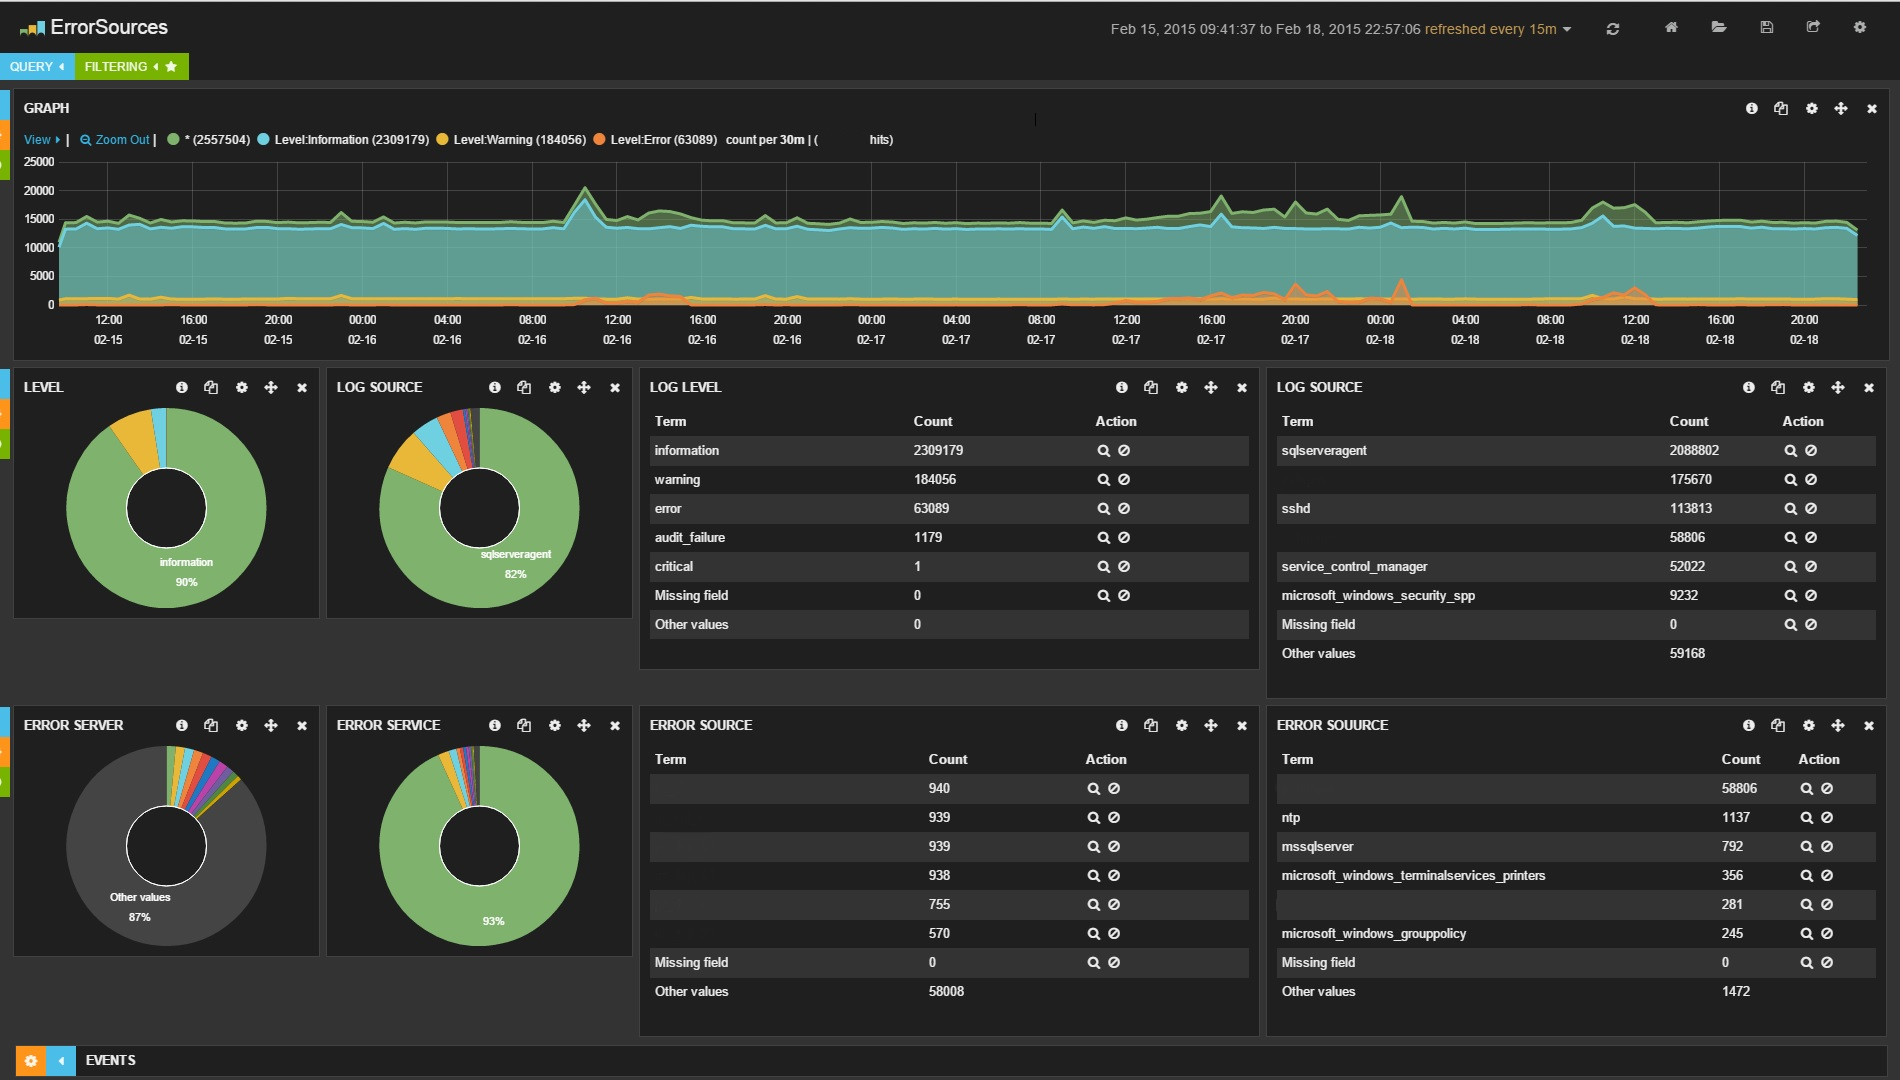
Preventing criticism, I will describe that this system does not set the task of collecting logs in real-time, the goal is only statistics that are collected for a certain period of time, and then displayed on the dashboard. It is used to come in the morning, see how the servers behaved themselves at night, and compare them with the results obtained, say, last week. In the proposed system, logs are collected once per hour, respectively, the lag between the current logs and what is output (to be exact, displayed and displayed on request) on the dashboard can be about an hour.
Currently, powershell has two ways to get logs from a remote computer:
But in the first case, the file is completely pumped with the event-logs of the system and only then they are processed on the computer where the script is executed. As a result, such requests are processed unnecessarily long. The possibility of sampling the logs (for example, only in the last 24 hours) does not work very well here, since the entire file is initially pulled out and only then some work is done with it.
In the second case, a WMI request is sent to the server, processing occurs on the server side and the key point here is that it is possible to limit the interval of the logs of interest to us already at the request stage (in the example below, the interval is set at 1 hour). Since this command works much faster than the first one, and the execution time of the request directly depends on the requested log spacing, I chose Get-WmiObject.
In the script below, there are several unobvious and difficult points:
First, the logic for limiting the time interval is described for sampling logs, when logs are required for the last hour, but not in the hour since the request, but in the last full hour, i.e. starting at 00 min. and ending 59 min.
The second point is that the time in the WMI format is different from the usual format, so it is always necessary to convert to WMI time format and back.
Upon completion of the script, the output is the following files: ComputerName-JournalName.json.
The json format somewhat does not conform to the standard (there are no opening and closing parentheses), but the Logstash parser normally digests and processes it. Three files are generated for each server: ComputerName-System.json ComputerName-Application.json ComputerName-Security.json Since the files have the same format, their processing is identical.
You can limit log collection to a specific log by simply editing the line: $ logjournals = “System”, “Application”, “Security”
Logstash comes next with the following configuration:
The data is entered into Elasticsearch, from where it is subsequently displayed using Kibana.
As a result, information is displayed on the screen (in my case for the last 2 days): about the most problematic servers, about the most problematic services; a graph is drawn in which you can immediately see an increase in the number of logs or errors at a particular point in time. You can always search by error text or user name, or sort by error level or id.
Accordingly, for the implementation of such a system, the administrator is tasked with: firstly, how to collect these logs, secondly, how to work with them conveniently and centrally. Thanks to a sufficiently developed bundle of ELK (Elasticsearch + Logstash + Kibana), more than once described on Habré, the administrator has the tools to easily search and display all the information present in the logs. Therefore, the answer to the second problem exists initially, and it remains only to solve the problem of collecting logs.
Since, in my case, the requirement for the system was the lack of a client on the servers, and the fact that the logs needed to be pulled from Windows servers, the powershell was chosen as the native Windows tool.
Based on this, the following model for collecting and displaying information from logs was compiled: logs are remotely collected from the powershell script servers, and then stored as files in the storage, then using ELK (Elasticsearch + Logstash + Kibana) they are processed and displayed.
')
An example of the operation of the entire bundle is shown in the image:
Preventing criticism, I will describe that this system does not set the task of collecting logs in real-time, the goal is only statistics that are collected for a certain period of time, and then displayed on the dashboard. It is used to come in the morning, see how the servers behaved themselves at night, and compare them with the results obtained, say, last week. In the proposed system, logs are collected once per hour, respectively, the lag between the current logs and what is output (to be exact, displayed and displayed on request) on the dashboard can be about an hour.
Currently, powershell has two ways to get logs from a remote computer:
- native powershell command: Get-EventLog -ComputerName $ computer –LogName System
- getting logs via WMI query: Get-WmiObject -Class win32_NTLogEvent -filter "logfile = 'System'" -ComputerName $ computer
But in the first case, the file is completely pumped with the event-logs of the system and only then they are processed on the computer where the script is executed. As a result, such requests are processed unnecessarily long. The possibility of sampling the logs (for example, only in the last 24 hours) does not work very well here, since the entire file is initially pulled out and only then some work is done with it.
In the second case, a WMI request is sent to the server, processing occurs on the server side and the key point here is that it is possible to limit the interval of the logs of interest to us already at the request stage (in the example below, the interval is set at 1 hour). Since this command works much faster than the first one, and the execution time of the request directly depends on the requested log spacing, I chose Get-WmiObject.
In the script below, there are several unobvious and difficult points:
First, the logic for limiting the time interval is described for sampling logs, when logs are required for the last hour, but not in the hour since the request, but in the last full hour, i.e. starting at 00 min. and ending 59 min.
The second point is that the time in the WMI format is different from the usual format, so it is always necessary to convert to WMI time format and back.
ServersEventLogs.ps1
Clear-Host # Active Directory ( powershell Active Directory) import-module activedirectory $computers = Get-ADComputer -SearchBase "OU=Servers,DC=domain,DC=ru" -Filter * | ForEach-Object {$_.Name} | Sort-Object # $logdir = "\\storage\Logs\ServersLog\" + $(Get-Date -UFormat "%Y_%m") # , if((Test-Path $logdir) -eq 0) { New-Item -ItemType directory $logdir -Force } # $domain = "domain" $username = "username" $password = 'password' $account = "$domain"+"\"+$($username) $accountpwd = ConvertTo-SecureString $password -AsPlainText -Force $credential = New-Object System.Management.Automation.PsCredential($account, $accountpwd) # , , : - , - . # : # BiginDate = 08/26/2014 12:00:00 # EndDate = 08/26/2014 13:00:00 # BiginDate = 08/26/2014 12:00:00 EndDate = 08/26/2014 13:00:00 $date = Get-Date Write-Host "Date = $date" $m = $date.Minute $s = $date.Second $begindate = (($date.AddSeconds(-$s)).AddMinutes(-$m)).addHours(-1) Write-Host "BiginDate = $begindate" $enddate = ($date.AddSeconds(-$s)).AddMinutes(-$m) Write-Host "EndDate = $enddate" # WMI $wmibegindate=[System.Management.ManagementDateTimeConverter]::ToDMTFDateTime($begindate) Write-Host "WMIBiginDate = $wmibegindate" $wmienddate=[System.Management.ManagementDateTimeConverter]::ToDMTFDateTime($enddate) Write-Host "WMIEndDate = $wmienddate" $logjournals = "System", "Application", "Security" foreach ($computer in $computers) { Write-Host "Processing computer: $computer" foreach ($logjournal in $logjournals) { Write-Host "Processing log: $logjournal" $systemlog = Get-WmiObject -Class win32_NTLogEvent -filter "logfile = '$logjournal' AND (TimeWritten>='$wmibegindate') AND (TimeWritten<'$wmienddate')" -computerName $computer -Credential $credential -ErrorAction SilentlyContinue foreach ($logstring in $systemlog) { $wmitime = $logstring.TimeGenerated $time = [System.Management.ManagementDateTimeconverter]::ToDateTime("$wmitime") #Write-Host $logtime $level = $logstring.Type #Write-Host "$level" $journal = $logstring.LogFile #Write-Host "$journal" $category = $logstring.CategoryString #Write-Host "$category" $source = $logstring.SourceName #Write-Host "$source" $message = $logstring.Message #Write-Host "$message" $code = $logstring.EventCode #Write-Host "$code" @{Server="$computer";Time="$time";Level="$level";Journal="$journal";Category="$category";Source="$source";Message="$message";Code="$code"} | ConvertTo-Json -depth 10 -Compress | Out-File "$logdir\$computer-$logjournal.json" -Encoding utf8 -Append } } } Upon completion of the script, the output is the following files: ComputerName-JournalName.json.
The json format somewhat does not conform to the standard (there are no opening and closing parentheses), but the Logstash parser normally digests and processes it. Three files are generated for each server: ComputerName-System.json ComputerName-Application.json ComputerName-Security.json Since the files have the same format, their processing is identical.
You can limit log collection to a specific log by simply editing the line: $ logjournals = “System”, “Application”, “Security”
Logstash comes next with the following configuration:
ServersEventLogs.conf
input { file { type => "ServersLogs" discover_interval => 1800 path => [ "//storage/Logs/ServersLog/*/*.json" ] codec => "json" } } filter { date { type => "ServersLogs" match => [ "Time", "MM/dd/YYYY HH:mm:ss" ] locale => "en" target => "Logtimestamp" } mutate { gsub => [ "Level", "[ -]", "_" ] gsub => [ "Source", "[ -]", "_" ] gsub => [ "Server", "[ -]", "_" ] remove_field => ["message"] remove_field => ["host"] } } output { elasticsearch { embedded => false host => "logserver" protocol => "http" cluster => "windowseventlogs" codec => "plain" index => "windowseventlogs-%{+YYYY.MM.dd}" } } The data is entered into Elasticsearch, from where it is subsequently displayed using Kibana.
As a result, information is displayed on the screen (in my case for the last 2 days): about the most problematic servers, about the most problematic services; a graph is drawn in which you can immediately see an increase in the number of logs or errors at a particular point in time. You can always search by error text or user name, or sort by error level or id.
Source: https://habr.com/ru/post/255815/
All Articles