New analysis tool for SIMD programs - Vectorization Advisor
Many of the posts on vectorization have been published on the company's blog, for example, a rather comprehensive review of the principles of auto-vectorization. With each release of new Intel processors, the topic is becoming increasingly relevant for maximum application performance. In this post, I will talk about Vectorization Advisor, which is included in many familiar Intel Advisor XE and allows you to solve many problems of vectorization code. However, first about why it is needed.

Figure 1. The width of vector registers for different microarchitecture processors
')
An important part of new microarchitecture processors is the increase in the length of vector registers and the emergence of new sets of vector instructions, known to all as MMX, SSE, AVX and AVX2, thanks to which several operations of the same type can be performed in one instruction. To better understand how vectorization can speed up your program, take a look at the following graph.
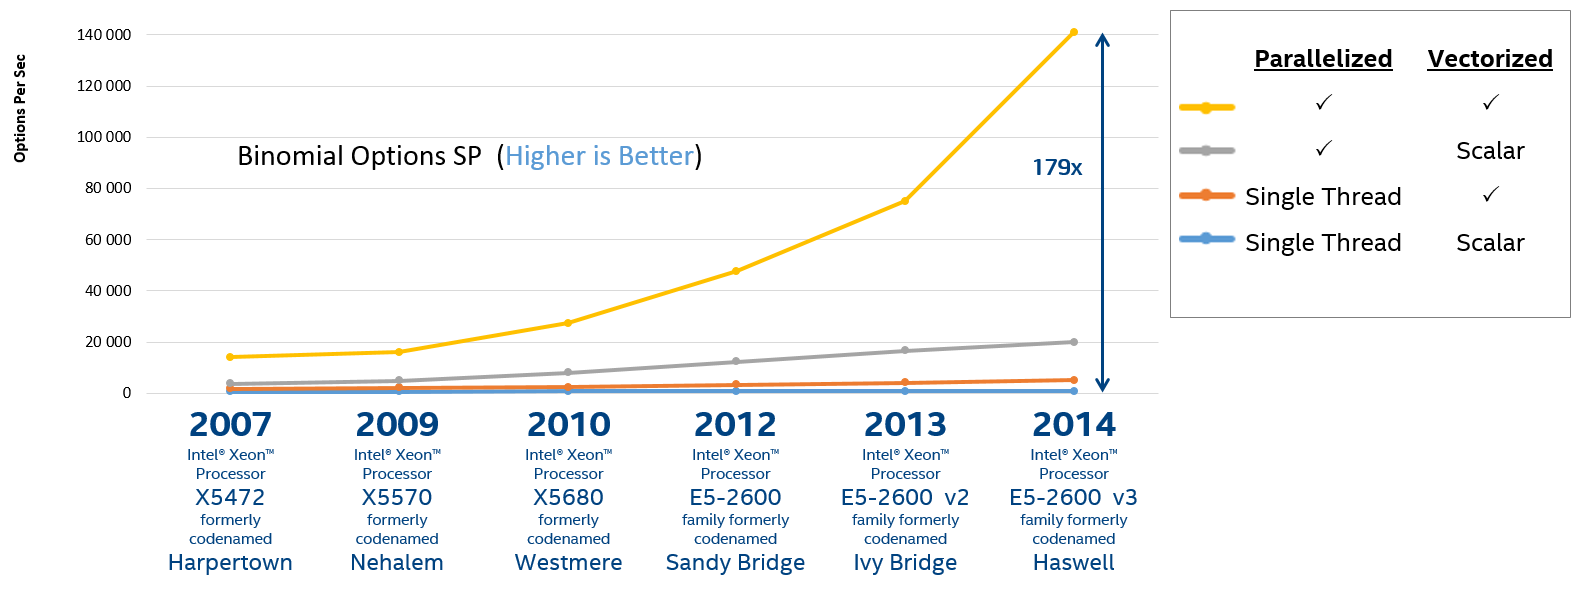
Figure 2. Performance of different versions of the program for calculating the binomial options
Despite the possible synthetic nature of this benchmark, he says that not only parallelism (threading) already familiar to many, but also the effective use of vector registers is a key factor for achieving maximum performance. There are several popular ways to achieve vectorization:
In addition, there are more complex ways, for example, the use of intrinsics and the use of vector instructions in assembly code.
Fortunately, with the release of new versions of compilers, auto-vectorization becomes more accessible and effective. To see how the compiler succeeded in this, you can add compilation keys (-optreport for Intel Compilers) and read the vectorization report with details for each cycle and the acceleration received. But for many cases, everything is far from being so simple and you have to somehow help the compiler to understand that the code can and should be vectorized or rewritten the code, making the code vectorized. Also, you should not think that the vectorized code is by default the most efficient in terms of performance. It is often possible to see that the cycle, though vectorized, but the real acceleration is rather small. These problems make the work of optimization engineers quite difficult and routine: you need to study the code, look at the messages from the compiler, examine the assembler code and data access patterns, check the correctness of the new version, modify the required part, evaluate the performance, etc.
Good news: Vectorization Advisor greatly simplifies the routine part!
The Intel Parallel Studio XE package provides ample opportunities for analyzing the code for performance evaluation, however, the earlier assessment of the code vectorization was not fully covered. Intel Parallel Studio XE 2016 Beta includes a heavily updated Intel Advisor XE 2016 Beta, which actually combines two products:
Where to begin? To focus on performance problems and their possible causes, you need to run Survey.
So the first thing that Vectorization Advisor does is launch your application and profile it. The tool provides a full report for each cycle, which includes analysis of hotspots, static analysis of binary modules, compiler messages. Moreover, the new product includes recommendations and diagnostics from vectorization experts, only a part of which can be found at the Intel Developer Zone.

Figure 3. Detailed program report after Survey analysis
The screenshots shown here and below show that after Survey the user receives a lot of important information: first you should pay attention to the time spent in the cycle (Self and Total time) in order to choose the most time-consuming. Then you can focus on the cycles that are not yet vectorized. In Figure 3 a scalar cycle is marked, which we will further consider and optimize. There is compiler diagnostics for this cycle - information about the reasons why the cycle was not vectorized, here the compiler assumes the presence of dependencies. Also, as shown below in the screenshot of step 1.1 (Figure 4), Vectorization Advisor is looking for performance problems and ways to solve them, and uses for this not only compiler information, but also static analysis of a binary file: acceleration estimates, various characteristics of assembler instructions, data types and so on. All these data can be found here, for each cycle.
It is assumed that the information obtained at this stage is sufficient to decide what needs to be improved and take the first steps towards a well-optimized program.
Often, to solve problems with inefficient generation of vectorized cycles, you need to know the number of iterations in the cycle. If the number of iterations is not constant (respectively, the compiler cannot evaluate it and use it for optimization), then it can be measured and give a hint to the compiler. To do this, Vector Analysis Advisor has a new type of analysis - Trip Counts. Another advantage of this analysis is that it integrates into the overall profile of the program, collected after Survey.
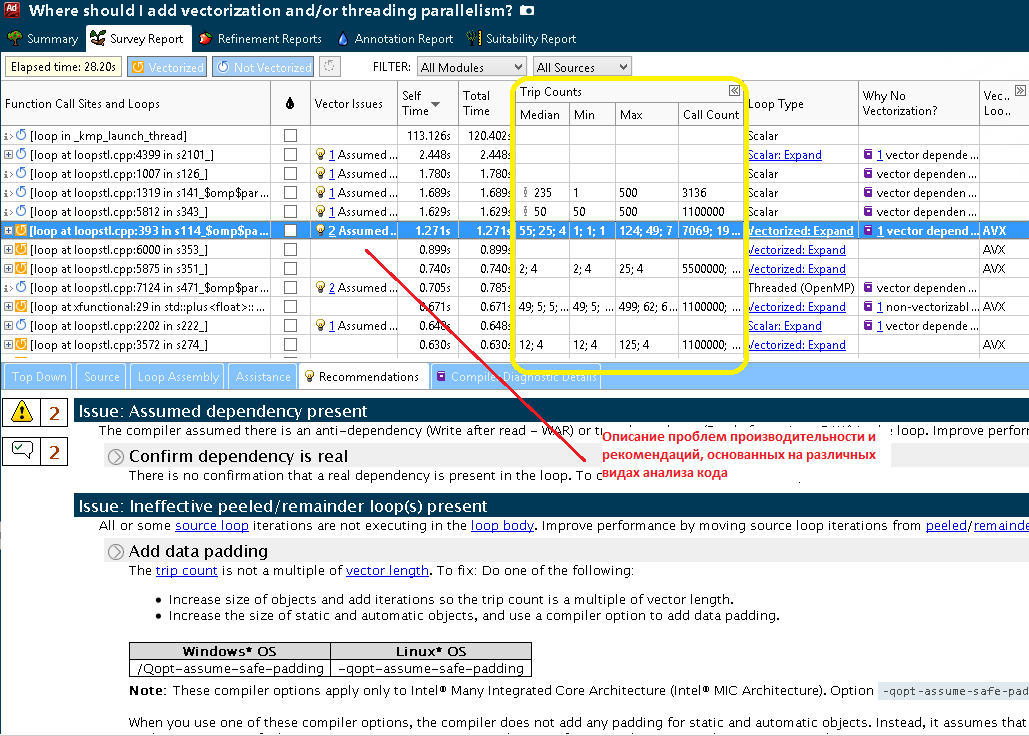
Figure 4. Program report, supplemented by the number of loop iterations
The yellow columns are those that appeared after searching for the number of iterations. Here we see the average, minimum and maximum number of iterations, as well as the number of occurrences in the cycle and an indicator showing a significant number of occurrences that have a different number of iterations. As noted earlier, the cycle we chose was not vectorized due to the assumed dependencies. Consider the example code in more detail:
The outer loop is parallelized using OpenMP threads. It would be nice to vectorize the internal loop, but Advisor XE talks about possible data dependencies, let's check it.
To check for possible dependencies on the data that potentially impede vectorization, we mark the cycles of interest and run Correctness.
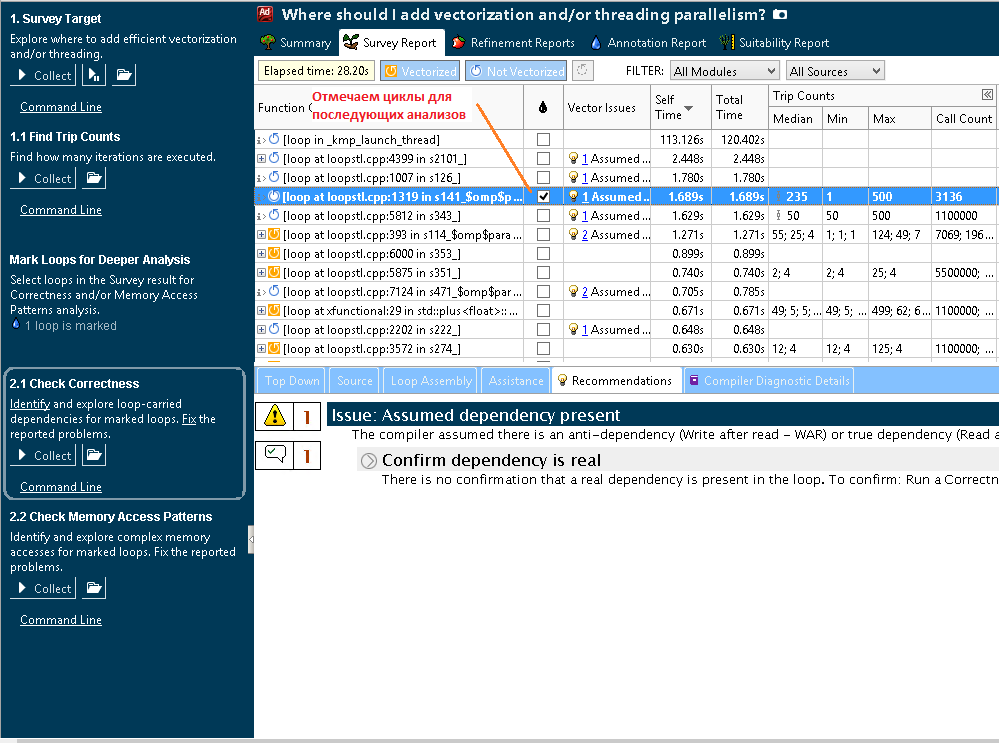
Figure 5. The choice of cycles for subsequent analysis on the correctness
After collecting the data, we see that Advisor XE did not find any problems in this example, precluding the possibility to vectorize the code:

Figure 6. Report after analyzing correctness
Since we were convinced of the security of vectorization (No dependencies found in Figure 6), we “force” the compiler to vectorize the cycle of interest to us, for this we add a directive
Reconstruct Survey and get the following result:

Figure 7. The result for the selected cycle for optimization
The loop was vectorized using AVX instructions. Cycle time fell to 0.77 seconds - received more than 2 times acceleration!
Similar to the analysis of correctness, the selected cycles can be checked for the efficiency of working with memory. This is important because vectorization can be more or less effective depending on the order of access to the data, for example, accessing aligned data usually gives a more efficient code. Note the cycles for which you want to get information and run the analysis of Memory Access Patterns.
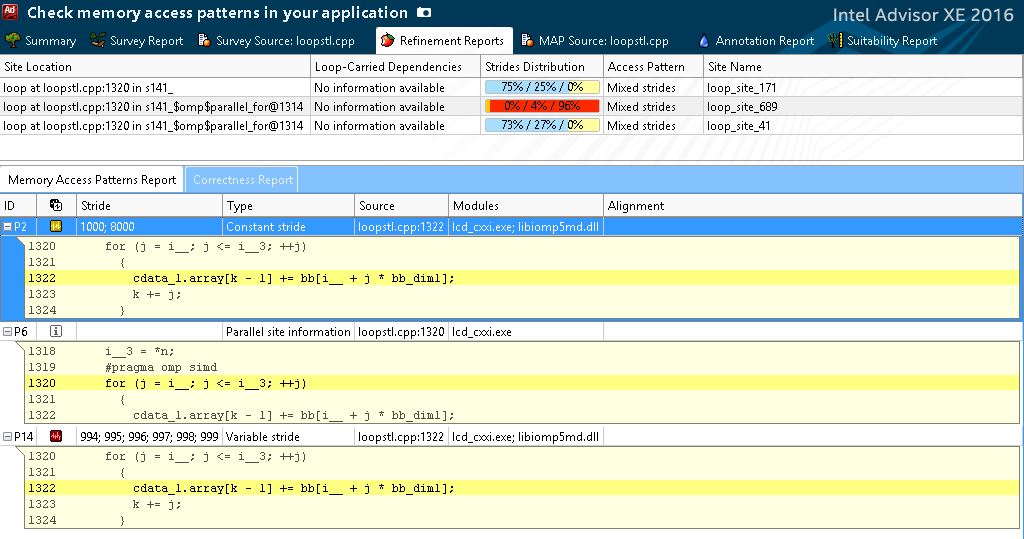
Figure 8. Data Access Template Report
As we see in Figure 8, the step of passing through the bb (stride) array is constant and equal to 8000 or 1000 (equal in different calls to bb_dim1). The step along the c_data_1.array array is variable (994; 995; 996 ...), which, however, is rather difficult to fix without rewriting the algorithm. It is desirable to make a single step, thereby organizing the prefetch of data, which the compiler ultimately does. This can be seen by analyzing the instructions in the Instruction Set Analysis column, there are specific to this Insert and Shuffles.
Vectorization Advisor will be useful where there is already a working code that needs to be further vectorized. With the help of a new tool, everyone can get not only a full report containing a detailed view of the “narrow” points of the application, but also get recommendations for eliminating them. Those who tried to do the analysis manually before the advent of Vectorization Advisor will save a huge amount of time, and those who did not know that it is possible will have a wonderful opportunity to optimize their application on their own!
Introduction
Figure 1. The width of vector registers for different microarchitecture processors
')
An important part of new microarchitecture processors is the increase in the length of vector registers and the emergence of new sets of vector instructions, known to all as MMX, SSE, AVX and AVX2, thanks to which several operations of the same type can be performed in one instruction. To better understand how vectorization can speed up your program, take a look at the following graph.
Figure 2. Performance of different versions of the program for calculating the binomial options
Despite the possible synthetic nature of this benchmark, he says that not only parallelism (threading) already familiar to many, but also the effective use of vector registers is a key factor for achieving maximum performance. There are several popular ways to achieve vectorization:
- auto-vectoring by the compiler;
- use of the OpenMP * 4.0 standard (I will use them later) and Intel Cilk Plus.
- managed compiler vectorization - using vector directives such as #pragma ivdep and #pragma vector;
- Intel Cilk Plus Array Notation;
In addition, there are more complex ways, for example, the use of intrinsics and the use of vector instructions in assembly code.
Fortunately, with the release of new versions of compilers, auto-vectorization becomes more accessible and effective. To see how the compiler succeeded in this, you can add compilation keys (-optreport for Intel Compilers) and read the vectorization report with details for each cycle and the acceleration received. But for many cases, everything is far from being so simple and you have to somehow help the compiler to understand that the code can and should be vectorized or rewritten the code, making the code vectorized. Also, you should not think that the vectorized code is by default the most efficient in terms of performance. It is often possible to see that the cycle, though vectorized, but the real acceleration is rather small. These problems make the work of optimization engineers quite difficult and routine: you need to study the code, look at the messages from the compiler, examine the assembler code and data access patterns, check the correctness of the new version, modify the required part, evaluate the performance, etc.
Good news: Vectorization Advisor greatly simplifies the routine part!
The Intel Parallel Studio XE package provides ample opportunities for analyzing the code for performance evaluation, however, the earlier assessment of the code vectorization was not fully covered. Intel Parallel Studio XE 2016 Beta includes a heavily updated Intel Advisor XE 2016 Beta, which actually combines two products:
- Threading assistant - everything that was in Intel Advisor earlier, with several improvements.
- Vectorization Advisor is a completely new analysis tool for SIMD programs.
Where to begin? To focus on performance problems and their possible causes, you need to run Survey.
Stage 1. Profiling (Survey Target)
So the first thing that Vectorization Advisor does is launch your application and profile it. The tool provides a full report for each cycle, which includes analysis of hotspots, static analysis of binary modules, compiler messages. Moreover, the new product includes recommendations and diagnostics from vectorization experts, only a part of which can be found at the Intel Developer Zone.
Figure 3. Detailed program report after Survey analysis
The screenshots shown here and below show that after Survey the user receives a lot of important information: first you should pay attention to the time spent in the cycle (Self and Total time) in order to choose the most time-consuming. Then you can focus on the cycles that are not yet vectorized. In Figure 3 a scalar cycle is marked, which we will further consider and optimize. There is compiler diagnostics for this cycle - information about the reasons why the cycle was not vectorized, here the compiler assumes the presence of dependencies. Also, as shown below in the screenshot of step 1.1 (Figure 4), Vectorization Advisor is looking for performance problems and ways to solve them, and uses for this not only compiler information, but also static analysis of a binary file: acceleration estimates, various characteristics of assembler instructions, data types and so on. All these data can be found here, for each cycle.
It is assumed that the information obtained at this stage is sufficient to decide what needs to be improved and take the first steps towards a well-optimized program.
Step 1.1 Finding the number of iterations (Find Trip Counts)
Often, to solve problems with inefficient generation of vectorized cycles, you need to know the number of iterations in the cycle. If the number of iterations is not constant (respectively, the compiler cannot evaluate it and use it for optimization), then it can be measured and give a hint to the compiler. To do this, Vector Analysis Advisor has a new type of analysis - Trip Counts. Another advantage of this analysis is that it integrates into the overall profile of the program, collected after Survey.
Figure 4. Program report, supplemented by the number of loop iterations
The yellow columns are those that appeared after searching for the number of iterations. Here we see the average, minimum and maximum number of iterations, as well as the number of occurrences in the cycle and an indicator showing a significant number of occurrences that have a different number of iterations. As noted earlier, the cycle we chose was not vectorized due to the assumed dependencies. Consider the example code in more detail:
#pragma omp parallel for private(i__3,j,k,i__) schedule(guided) if(i__2 > 101) for (i__ = 1; i__ <= i__2; ++i__) { k = i__ * (i__ + 1) / 2; i__3 = *n; for (j = i__; j <= i__3; ++j) { cdata_1.array[k - 1] += bb[i__ + j * bb_dim1]; k += j; } } The outer loop is parallelized using OpenMP threads. It would be nice to vectorize the internal loop, but Advisor XE talks about possible data dependencies, let's check it.
Stage 2.1 Dependency Check (Check Correctness)
To check for possible dependencies on the data that potentially impede vectorization, we mark the cycles of interest and run Correctness.
Figure 5. The choice of cycles for subsequent analysis on the correctness
After collecting the data, we see that Advisor XE did not find any problems in this example, precluding the possibility to vectorize the code:
Figure 6. Report after analyzing correctness
Since we were convinced of the security of vectorization (No dependencies found in Figure 6), we “force” the compiler to vectorize the cycle of interest to us, for this we add a directive
#pragma omp simd before the cycle: #pragma omp parallel for private(i__3,j,k,i__) schedule(guided) if(i__2 > 101) for (i__ = 1; i__ <= i__2; ++i__) { k = i__ * (i__ + 1) / 2; i__3 = *n; #pragma omp simd for (j = i__; j <= i__3; ++j) { cdata_1.array[k - 1] += bb[i__ + j * bb_dim1]; k += j; } } Reconstruct Survey and get the following result:
Figure 7. The result for the selected cycle for optimization
The loop was vectorized using AVX instructions. Cycle time fell to 0.77 seconds - received more than 2 times acceleration!
Step 2.2 Verify Memory Access Patterns Data Access Pattern
Similar to the analysis of correctness, the selected cycles can be checked for the efficiency of working with memory. This is important because vectorization can be more or less effective depending on the order of access to the data, for example, accessing aligned data usually gives a more efficient code. Note the cycles for which you want to get information and run the analysis of Memory Access Patterns.
Figure 8. Data Access Template Report
As we see in Figure 8, the step of passing through the bb (stride) array is constant and equal to 8000 or 1000 (equal in different calls to bb_dim1). The step along the c_data_1.array array is variable (994; 995; 996 ...), which, however, is rather difficult to fix without rewriting the algorithm. It is desirable to make a single step, thereby organizing the prefetch of data, which the compiler ultimately does. This can be seen by analyzing the instructions in the Instruction Set Analysis column, there are specific to this Insert and Shuffles.
findings
Vectorization Advisor will be useful where there is already a working code that needs to be further vectorized. With the help of a new tool, everyone can get not only a full report containing a detailed view of the “narrow” points of the application, but also get recommendations for eliminating them. Those who tried to do the analysis manually before the advent of Vectorization Advisor will save a huge amount of time, and those who did not know that it is possible will have a wonderful opportunity to optimize their application on their own!
Links
Source: https://habr.com/ru/post/255731/
All Articles