Hand on pulse: how we created a load tracking system for user servers

In our blog, we talked about how the infrastructure of the hosting provider as a whole is built, and also looked at some important customer services - for example, the ability to order servers for high loads , a common API, and the creation of private networks and virtual servers .
Today we will talk about how to create a system that allows 1cloud hosting clients in real time to see the status of their servers without any problems.
')
Why do you need it
Having the ability to quickly assess the current load on the servers is difficult to overestimate - it allows a flexible approach to infrastructure management. For example, if a surge of activity suddenly occurs, then seeing that the server owner can temporarily “raise” a new virtual machine (or increase resources on an existing one), and then disconnect it (and discard additional resources) when performance problems are resolved.
In addition, the availability of easily accessible information on loading for a certain period allows customers to understand what they are paying for. If the paid infrastructure is clearly excessive for the load of a specific project, you can simply refuse from unnecessary services, seriously saving (we had a separate topic about optimizing the cost of hosting).
How implemented
In order to organize the display of information about servers in the control panel, we needed a graphic library.
We tried a significant number of options, but we stopped at the HighCharts JS library - it is what Yandex.Metrica uses to display the graphs in the analysis panel.
In addition to this tool, there were other candidates, but HighCharts bribed with good documentation, general quality of work during the tests and responsive support, which helped us a few times. Here it is also necessary to say that the cost of using HighCharts was $ 590.
The table below shows other libraries that we considered during the project. None of them suited us like HighCharts, since all these projects were inferior to this JS library in terms of functionality, and the graphics obtained with their help were not so beautiful.
| Title | Link | License type |
|---|---|---|
| Mbostock d3 | https://github.com/mbostock/d3/wiki/Gallery | Is free |
| Flotcharts | www.flotcharts.org/flot/examples | Is free |
| jqPlot | www.jqplot.com/tests | Is free |
| Js charts | www.jscharts.com | Fee (licenses from $ 79 to $ 169) |
| Canvas 3D Graph | dragan.yourtree.org/code/canvas-3d-graph | Is free |
| Plotkit by alastair tse | www.liquidx.net/plotkit | Is free |
| Raphaël | raphaeljs.com | Is free |
| AM Charts | live.amcharts.com | At a charge ($ 700) |
We also integrated with vSphere using the .NET SDK - this was needed to obtain information about the load of each virtual machine. And then these data were displayed in the hosting control panel.
What happened
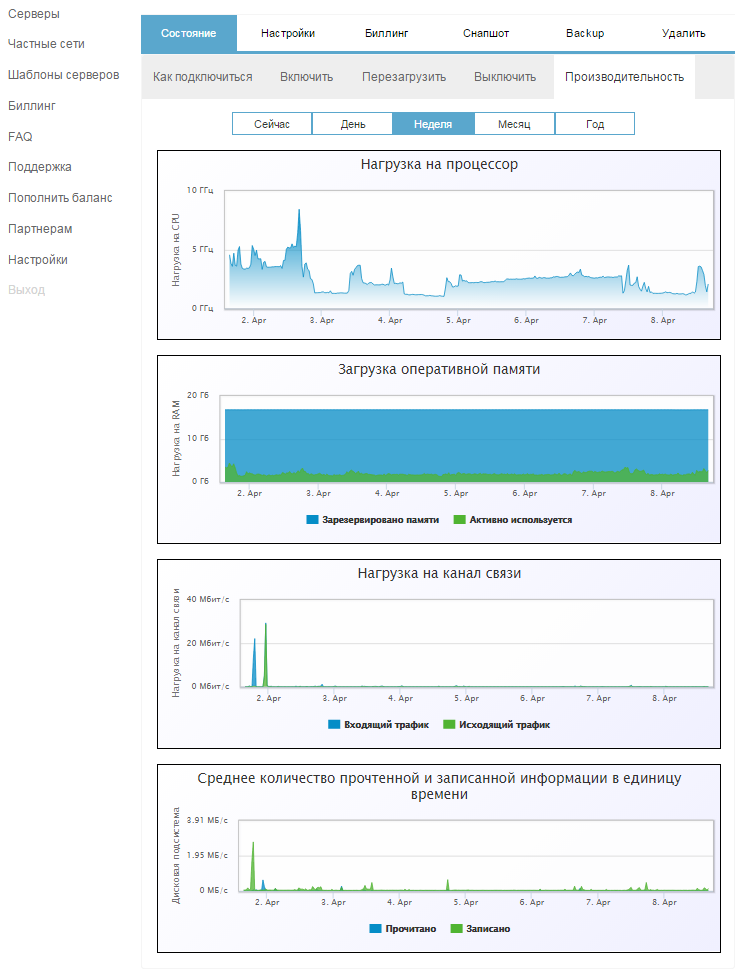
According to the results of the work carried out in the control panel on the site, it became possible to view statistics for each server. Data is displayed for several periods - “now”, “per day”, “per week”, “per month” and “per year”.
Among the available information data on:
- CPU load;
- RAM loading;
- The load on the communication channel;
- Disk subsystem: the number of IOPS (only for the selected period "Now");
- The disk subsystem: read / write - is displayed for any selected period except “Now”.
The interface of the graphic panel looks like this (by clicking on the image, it will open in full size):
Plans
The function of displaying information about server loading has been launched recently, and we have quite large-scale plans for its development.
In particular, with the help of the monitoring system, a mechanism will be implemented to automatically notify users about the critical load on its server. We also plan to introduce a payment model for only consumed resources (Pay as you go) and an infrastructure autoscaling system when the peak load on the current infrastructure is reached.
That's all, thank you for your attention. We will be happy to answer questions in the comments. Subscribe to our blog - in the next posts we will talk more about the many aspects of building hosting infrastructure.
Source: https://habr.com/ru/post/255271/
All Articles