Intel® Parallel Studio XE 2016 Beta - what's new?
A big update to the Intel® Parallel Studio XE package was released this week. Version 2016 includes three brand new products:
The beta version is available publicly and for free, the program lasts until June 23, but the licenses will work until September 25, 2015. To get the Beta version you need to register here .
This article is devoted to the review of the new functional, we will try to highlight in more detail the individual products in subsequent blogs - write in the comments what is of interest.
Intel® Advisor XE has traditionally been the tool for prototyping concurrency on threads. In the 2016 Beta version, it is actually divided into two large products:
Main features of Vectorization Advisor:
We will write more about Vectorization Advisor in the following blogs.
')
Optimized library for working with “big data” at different stages: obtaining data from the source, preliminary processing, transformation, data mining, modeling, validation and decision making.
The official name is Intel® Parallel Studio XE 2016 Beta, Composer Edition. The product combines the compiler and libraries. The Intel compiler extends the set of supported standards:
OpenMP * 4.0:
OpenMP * 4.1 TR 3:
C / C ++ standards:
The Fortran compiler began to support submodules, improved runtime checking of uninitialized variables (
The new version of VTune ™ Amplifier XE has expanded the functionality of profiling OpenMP and MPI applications. For OpenMP, the tool provides statistics on parallel regions and highlights those where there is the greatest potential for optimization. VTune Amplifier recognizes the main reasons for OpenMP inefficiency - load imbalance, overhead, synchronization, etc. Details have been written about OpenMP analysis.

VTune Amplifier greatly expanded the capabilities of MPI-profiling applications, and the most interesting - hybrid, MPI + OpenMP. Those. You can simultaneously analyze OpenMP and MPI communication imbalances.

In the Bottom-up table, you can group by MPI process and OpenMP regions within it, as well as by individual barriers (for example, in cycles) within a region:

Performance analysis of OpenCL programs running on Intel® HD Graphics becomes more convenient with the new “architecture diagram”, where you can visually see the GPU hardware blocks and their loading - busy cores and data traffic:

Other changes in VTune Amplifier XE:
The new option
Or VTune Amplifier, to analyze the performance of individual wounds:
Please note, in the example, the analysis is run only on the ranks 2 and 3 of the four running. Those. You can selectively profile individual processes.
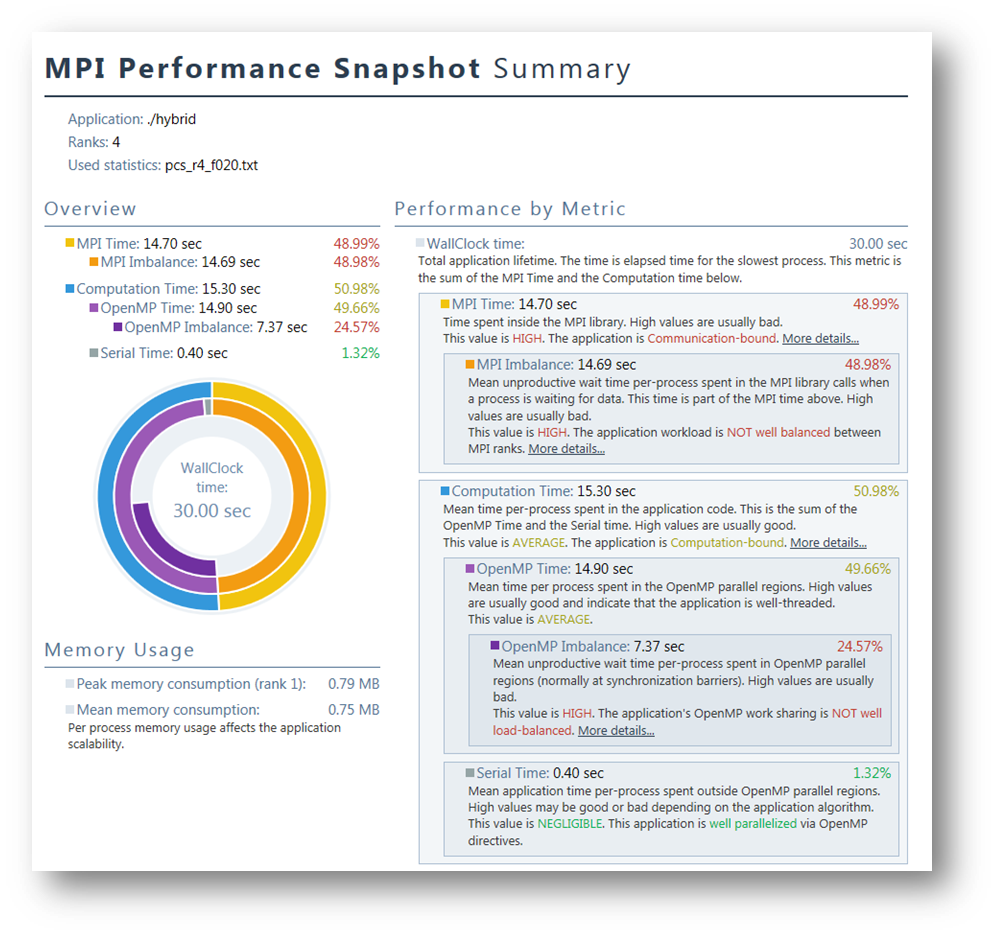
The main innovation is MPI Performance Snapshot . The tool is used for quick top-level performance evaluation - how the application scales, what is the load balance of MPI, OpenMP, and computing.
Improved analysis of hybrid applications: Intel® Trace Analyzer allows you to select MPI markets and generate the VTune ™ Amplifier command line for them using the new <code-gtool option from the Intel® MPI Library. Those. You first identify problematic MPI processes with the Intel® Trace Analyzer, and then study them in detail with the VTune ™ Amplifier.

Intel® Parallel Studio 2016 Beta carries a serious set of new features in a number of areas:
Some of this is the development of a traditional set for the HPC developer, but much is being extended to other areas, such as multimedia and data analysis.
It was a brief review, in the following posts we will write in more detail - let me know what is interesting in the first place.
Sign up for Intel® Parallel Studio XE 2016 Beta .
- Intel® Data Analytics Acceleration Library (Intel® DAAL) - C ++ and Java data analytics solution (statistics, machine learning, etc.).
- The new Vectorization Advisor in the Intel® Advisor XE 2016 Beta to optimize code for SIMD instructions, i.e. vectorization.
- MPI Performance Snapshot for quick overall performance evaluation of MPI programs.
The beta version is available publicly and for free, the program lasts until June 23, but the licenses will work until September 25, 2015. To get the Beta version you need to register here .
This article is devoted to the review of the new functional, we will try to highlight in more detail the individual products in subsequent blogs - write in the comments what is of interest.
Intel® Advisor XE 2016 Beta
Intel® Advisor XE has traditionally been the tool for prototyping concurrency on threads. In the 2016 Beta version, it is actually divided into two large products:
- Threading assistant - everything that was in Intel Advisor earlier, with several improvements.
- Vectorization Advisor is a completely new analysis tool for SIMD programs.
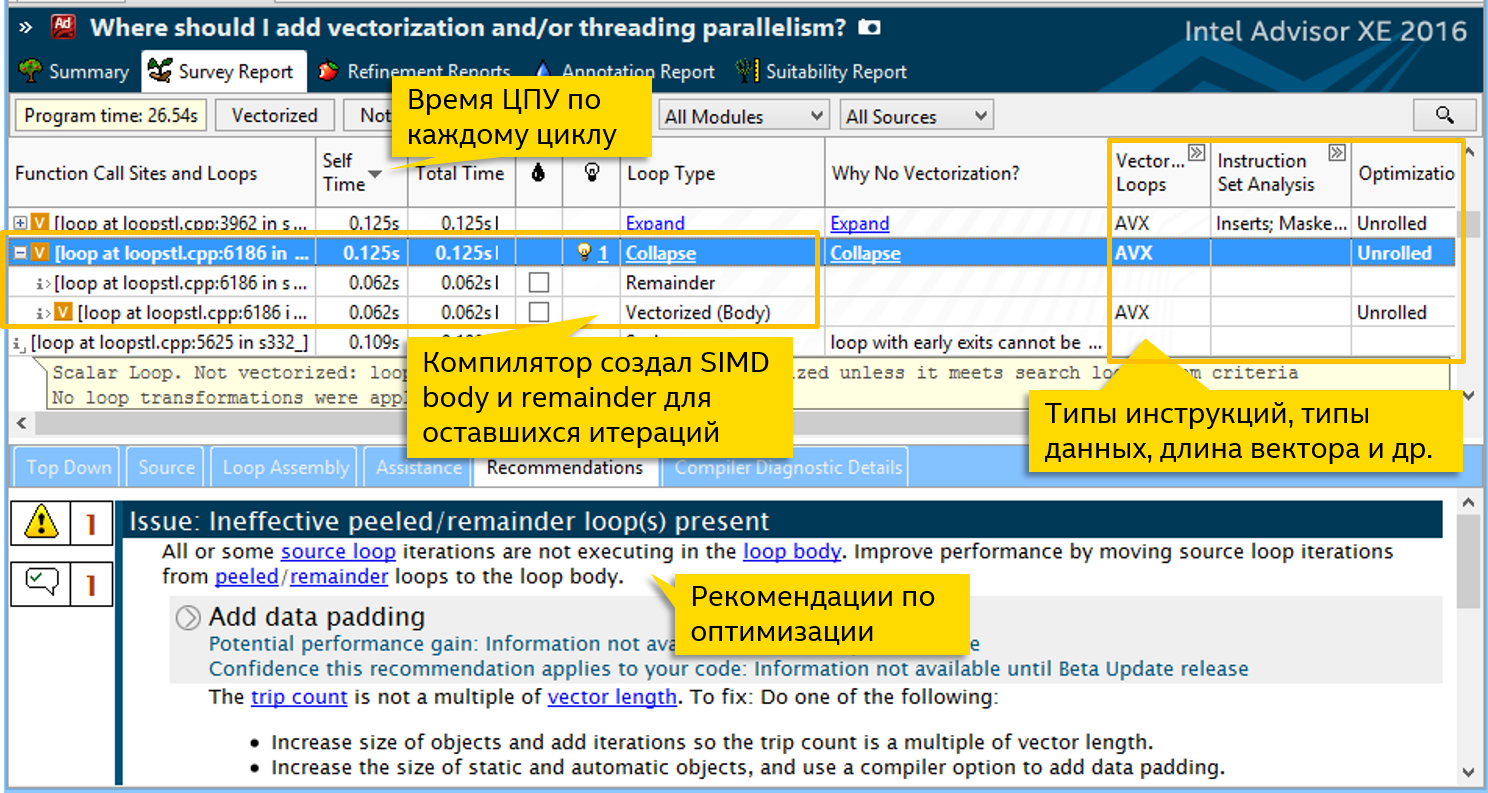
Main features of Vectorization Advisor:
- All information on the vectorization of cycles is collected in one place : CPU time, diagnostics from the compiler, analysis of used instructions and data types, etc. This allows you to focus on the important thing - to optimize the hottest cycles.
- Counting the number of iterations (trip counts) and call (call counts) cycles.
- Search for iterative dependencies
- Memory Access Template Analysis
- Optimization recommendations based on collected data.
We will write more about Vectorization Advisor in the following blogs.
')
Intel® Data Analytics Acceleration Library (Intel® DAAL) 2016 Beta
Optimized library for working with “big data” at different stages: obtaining data from the source, preliminary processing, transformation, data mining, modeling, validation and decision making.
- Intelligent data analysis - data similarity calculation, matrix factorization (SVD, QR, Cholesky), statistical moments, variational and covariance matrices, finding one-dimensional and multidimensional emissions, and associative rules.
- Methods of machine learning with and without a teacher: linear regression, naive Bayes classifier, boosting algorithms (AdaBoost, LogitBoost, BrownBoost), support vector machine, k-means clustering, likelihood function, etc.
- Support for local and distributed data sources , including CSV in files and in memory, MySQL, HDFS, and Resilient Distributed Dataset (RDD) objects from Apache Spark *.
- Compress and decompress data - Intel DAAL utilities provide efficient implementations of ZLIB, LZO, RLE, and BZIP2.
- Serialization and deserialization of data for efficient communications.
Compiler
The official name is Intel® Parallel Studio XE 2016 Beta, Composer Edition. The product combines the compiler and libraries. The Intel compiler extends the set of supported standards:
OpenMP * 4.0:
simdlenandsafelenfor cycles- array reductions (Fortran),
- User-defined reductions (C / C ++),
- option
collapse(N)foromp simd.
OpenMP * 4.1 TR 3:
- Non-structured data allocation with
omp target [enter | exit ] dataomp target [enter | exit ] data - Asynchronous offline with
nowaitoption foromp task - Offload dependencies with the option
dependforomp task - Modifiers
alwaysanddeleteformap
C / C ++ standards:
- C11: Unicode strings support, C11 anonymous unions, keywords
_Alignas, _Alighof, _Static_assert, _Thread_local, _Noreturn, and_Generic. - C ++ 14: generic lambdas, generalized lambda captures, digit separators, [[deprecated]] attribute, deduction of the return value type of the function, and member initialization.
The Fortran compiler began to support submodules, improved runtime checking of uninitialized variables (
[Q]init option), added support for IMPURE ELEMENTAL (F2008) and improved C Interoperability (F2015).Intel® VTune ™ Amplifier XE 2016 Beta
The new version of VTune ™ Amplifier XE has expanded the functionality of profiling OpenMP and MPI applications. For OpenMP, the tool provides statistics on parallel regions and highlights those where there is the greatest potential for optimization. VTune Amplifier recognizes the main reasons for OpenMP inefficiency - load imbalance, overhead, synchronization, etc. Details have been written about OpenMP analysis.
VTune Amplifier greatly expanded the capabilities of MPI-profiling applications, and the most interesting - hybrid, MPI + OpenMP. Those. You can simultaneously analyze OpenMP and MPI communication imbalances.
In the Bottom-up table, you can group by MPI process and OpenMP regions within it, as well as by individual barriers (for example, in cycles) within a region:
Performance analysis of OpenCL programs running on Intel® HD Graphics becomes more convenient with the new “architecture diagram”, where you can visually see the GPU hardware blocks and their loading - busy cores and data traffic:
Other changes in VTune Amplifier XE:
- Updated General Exploration analysis with an estimate of the reliability of sampling statistics.
- New tab “Platform” instead of “Tasks and Frames”
- Collecting hardware events without a driver on Linux
Intel® MPI Library 5.1 Beta
- Support for the main functionality of the standard MPI v3.0.
- Intel® True Scale Fabric support has been added.
- The
-use-app-topologyoption allows Hydra to-use-app-topologytune the MPI process alignment based on previously compiled statistics and the dynamically identified cluster topology. - The
--fastoption formpituneup automatic configuration by launching the IMB benchmark instead of the user application. IMB repeats the pattern of your program (in terms of MPI communications), the settings for it will be close to the settings for the program itself, but the actual calculations are not performed, the setup time is reduced. - The
--rank-placementoption formpituneoptimizes MPI configuration for a specific cluster topology, based on communication patterns.
The new option
-gtool allows -gtool to conveniently launch the analyzer tool for your MPI application. For example, Vectorization Advisor to analyze vectorization:mpirun -n 4 -gtool "advixe-cl -collect survey:2,3" ./your_appOr VTune Amplifier, to analyze the performance of individual wounds:
mpirun -n 4 -gtool "amplxe-cl -collect hostpots:2,3" ./your_appPlease note, in the example, the analysis is run only on the ranks 2 and 3 of the four running. Those. You can selectively profile individual processes.
Intel® Trace Analyzer and Collector 9.1 Beta
The main innovation is MPI Performance Snapshot . The tool is used for quick top-level performance evaluation - how the application scales, what is the load balance of MPI, OpenMP, and computing.
Improved analysis of hybrid applications: Intel® Trace Analyzer allows you to select MPI markets and generate the VTune ™ Amplifier command line for them using the new <code-gtool option from the Intel® MPI Library. Those. You first identify problematic MPI processes with the Intel® Trace Analyzer, and then study them in detail with the VTune ™ Amplifier.
Summary
Intel® Parallel Studio 2016 Beta carries a serious set of new features in a number of areas:
- Vectorization, optimization of the use of SIMD instructions (Intel Advisor XE)
- Big Data Analysis (Intel® DAAL)
- Unified analysis of hybrid HPC applications on MPI and OpenMP (Intel Trace Analyzer and Collector, VTune Amplifier XE)
- GPU analysis (VTune Amplifier XE)
- New Standards (Intel® Compiler, Intel® MPI)
Some of this is the development of a traditional set for the HPC developer, but much is being extended to other areas, such as multimedia and data analysis.
It was a brief review, in the following posts we will write in more detail - let me know what is interesting in the first place.
Sign up for Intel® Parallel Studio XE 2016 Beta .
Source: https://habr.com/ru/post/255175/
All Articles