R-prong electrocardiogram as a parameter of the tree of Pythagoras
While studying the electrocardiogram event detection algorithms for the research part of the thesis, I found that the RR interval of the cardiogram, calculated even with the accuracy of the second decimal place, fairly accurately characterizes the cardiovascular system of a particular person. Since I have been fond of fractal geometry for quite some time, an idea was instantly born in my head how to give “personal” qualities to some elementary fractal object.
This is how the Pythagorean Electrocardiographic Tree appeared.
The theoretical part - 1. About electrocardiogram
A graphic record of the potential difference created between different parts of the heart muscle during its excitation is called an electrocardiogram (ECG). The orientation and magnitude of these potentials of the heart on an electrocardiogram are expressed in the amplitude of the teeth and their directivity (polarity) with respect to the isoelectric line. And cover a range of 0.15 ... 300 Hz at a signal level of 0.3 ... 3 mV.
')
A normal ECG consists of the teeth and line segments (segments) horizontally between them (Figure 1).
Figure 1 - Schematic representation of a normal electrocardiogram.

In clinical practice, leads are used from different parts of the body surface. These leads are called superficial. At registration of an electrocardiogram 12 generally accepted assignments, six from extremities and six chest are usually used. The first three standard leads were suggested by Ainthoven. The heart rate (HR) is determined by the duration of one cardiac cycle, i.e. for the duration of the interval R - R.
The standard and most convenient for determining heart rate is the II-Einthoven lead, because in it the R wave has the greatest amplitude.
The practical part - 1
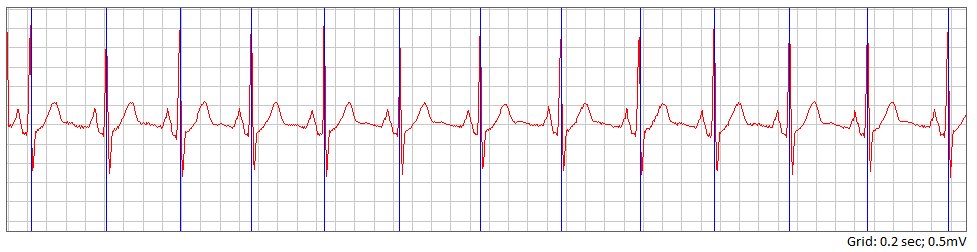
For the calculations, we will use the real ECG of a healthy person in the II lead by Einthoven, obtained from the database of physiological signals [1].
ECG parameters:
• ADC resolution of 12 bits;
• Sampling frequency 100 Hz;
• Duration 10 seconds;
Figure 2 - Image of a normal ECG from a DB.
Next, we define a QRS complex, to then select a R-wave from it. To do this, we use an algorithm based on the operator of the first derivative weighted and squared and on the moving average filter [2].
It sounds harder than it looks:
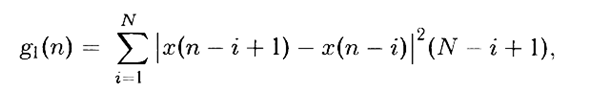
where x (n) is the ECG signal, N is the width of the window, within which the first-order difference is calculated, squared and weighted using the coefficient (N-i + 1) .
The weighting coefficient decreases linearly, starting from the current difference, to the difference calculated earlier by N samples in time, which provides a smoothing effect.
Further smoothing is performed using the moving average filter at M points:

With a sampling frequency of 100Hz, the width of the filter window is set to M = N = 8 . This algorithm gives a single peak for each QRS complex and suppresses P and T teeth. As a result of processing, we obtain the following ECG view (Figure 3).
Figure 3 - ECG image after filtration.

The search for the R wave in the processed signal can be performed using a simple peak search algorithm:
1. Scanning a fragment of the signal g (n) , on which a peak is expected, and determining the maximum value of gmax .
2. Determination of the threshold, as a fraction of the maximum, Th = 0.8gmax .
3. For all g (n)> Th, those samples are selected for which the corresponding values of g (n) are greater than a certain specified number M of previous or subsequent samples g (n) .
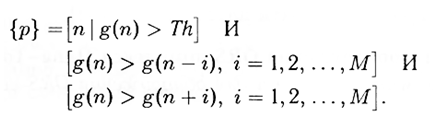
The set {p} thus defined contains the indices of all peaks found in the signal g (n) .
Peaks caused by artifacts can be rejected by additional conditions, for example, the minimum interval between two adjacent peaks.
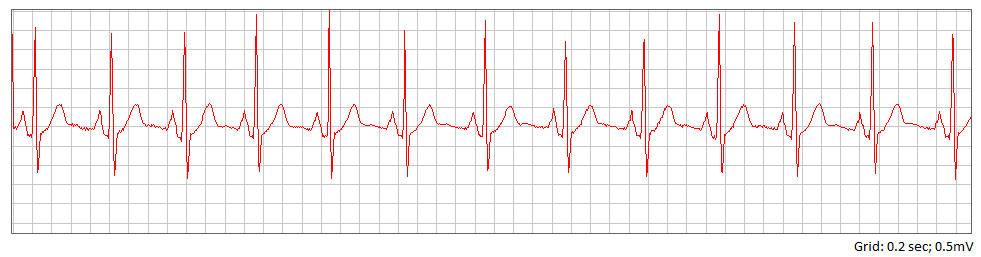
Figure 4 - ECG image with marked R-teeth.
Next is the simple task itself — determining the average RR interval of a given ECG. And in this case, it is equal to 733ms. "According to the fan" we calculate the heart rate: 60 / 0.733 = 81.85 beats / min. Now we have a value that characterizes the work of the heart of a particular person.
A little explanation:
The heart is not a metronome, it cannot tap a beat with equal time intervals between beats. RR interval for a healthy person varies in small limits. If the interval fluctuations are significant - this indicates the presence of arrhythmias and other disorders. The vibration mechanism is a very complex set of processes related to the electrical conductivity of a particular heart.
Using the value of the average RR interval as a parameter when building the tree of Pythagoras, you can give it "unique" ("personal") features.
The theoretical part - 2. About fractals
Geometric objects are called fractals: lines, surfaces, spatial bodies that have a highly rugged shape and possess the property of self-similarity. The founder of the theory of fractals, the Franco-American mathematician Benoit Mandelbrot formed the term fractal from the Latin participle fractus. The corresponding verb frangere is translated as breaking, breaking, i.e. create fragments of irregular shape. Self-similarity predetermines the scale invariance (scaling) of the main geometric features of a fractal object, their invariance with a change in scale. The recurrence of the ruggedness of the lines of fractal objects can be complete (in this case they speak of regular fractals), or some element of randomness can be observed (such fractals are called random). The structure of random fractals on a small scale is not exactly identical to the entire object, but their statistical characteristics coincide.
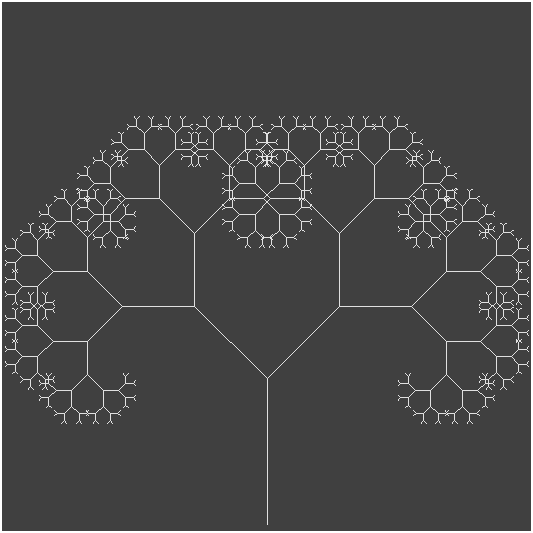
The Pythagorean tree is a form of a geometric regular fractal, based on a figure known as “Pythagorean pants” [3].
The principle of constructing a geometric fractal is recursion.
The practical part - 2
Pythagorean tree construction algorithm:
1) Build a vertical segment;
2) From the upper end of this segment we recursively construct another 2 segments of lesser length at an angle of 90 ° to each other;
3) Call the function of constructing two subsequent segments for each branch of the tree;
The function of building the tree of Pythagoras in C.
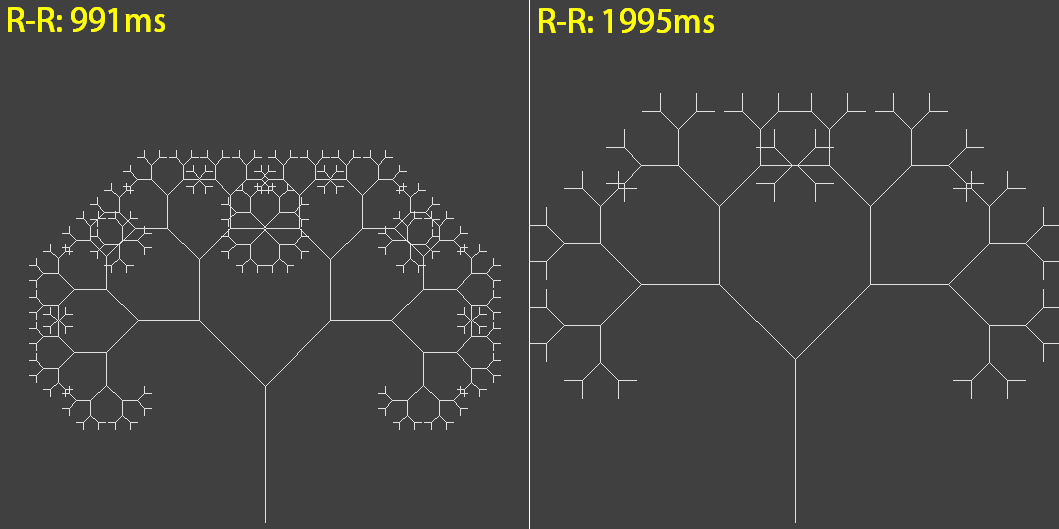
void Draw(double x, double y, double L, double a) { if(L > max) { L*=0.7; moveto(x,y); lineto((int)(x+L*cos(a)),(int)(yL*sin(a))); x=x+L*cos(a); y=yL*sin(a); Draw(x,y,L,a+Pi/n); Draw(x,y,L,a-Pi/m); } } Figure 5 - Pythagorean tree for ECG with RR: 733ms.

The only thing left to change is to use the calculated length of the average RR ECG interval as a variable L in the program.
Thus, you can get the "personal" tree of Pythagoras, which will "breathe", depending on the physical load, and the length of the branches and their twist - "as accurately as possible to describe" your personality.

Bibliography
1. Research resource of complex physiological signals: physionet.org ;
2. Rangayan R.M. Analysis of biomedical signals. Practical approach / Trans. from English Ed. A.P. Nemirko. - M .: Fizmatlit, 2010. - 220 p. - ISBN 978-5-9221-0730-3;
3. en.wikipedia.org/wiki/%D0%94%D0%B5%D1%80%D0%B5%D0%B2%D0%BE_%D0%9F%D0%B8%D1%84 %D0%B0 % D0% B3% D0% BE% D1% 80% D0% B0
Source: https://habr.com/ru/post/255141/
All Articles