Analysis of the shopping cart using MS Excel and MS SQL Server
If you are working in the field of trade, then surely the task of analyzing the shopping basket will be of interest to you. In simple words, this task boils down to determining which goods are most often bought together with other goods. With this information, you can easily increase sales, making a display of goods in accordance with the results of the analysis, or implement a system of recommendations to the buyer when selling goods.
To solve the problem, we need the following tools:
- Microsoft Excel (in my case, Microsoft Office 2013 Standard 2013).
- Microsoft SQL Server (in my case, Microsoft SQL Server 2014 Standard Edition).
Also for the analysis, we need sales data. Previously, I received the following sample using a report in the OLTP system (see Figure 1).
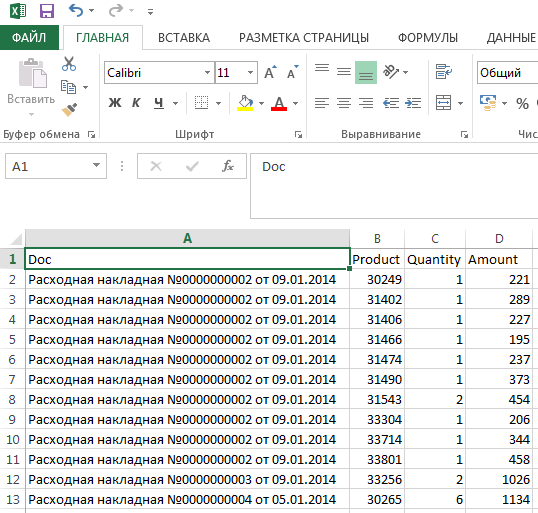
Fig. one.
')
In the sample there are:
- Document reference (Doc field).
- Product code (Product field).
- The quantity of the goods sold (the Quantity field).
- The amount of goods sold (field Amount).
Before we start analyzing the recycle bin, we’ll need to download a free Excel plug-in called Data Mining Add-ins for Excel . After installing the plug-in, the DATA MINING item will appear in the Excel main menu (see Figure 2).
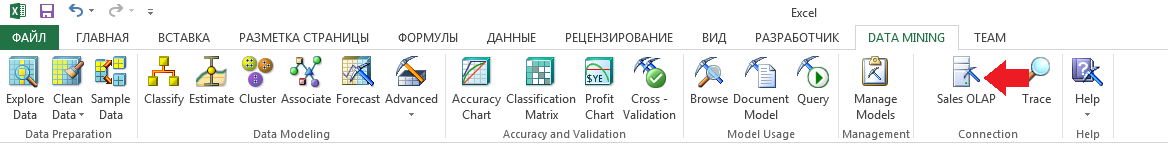
Fig. 2
The analysis itself is performed on the server by SQL Server Analysis Services, so you need to click the button in the toolbar in the Connections group (highlighted with a red arrow in Figure 2) and establish a connection with the Analysis Services server. Initially, there will be written “No connection”, click on this button and specify the connection parameters. After that, click the “Trace” button and uncheck the “Use session models” box (see Figure 3).
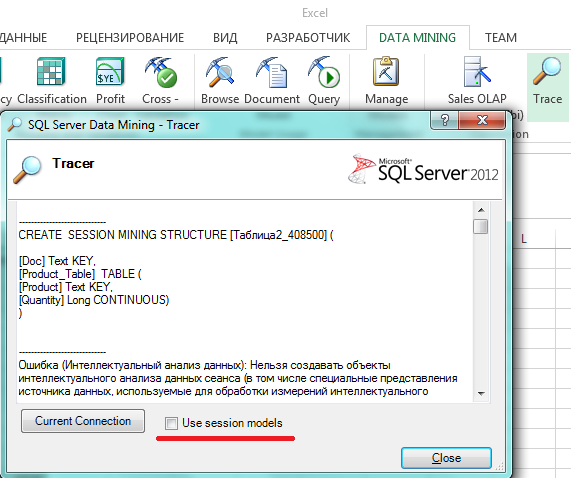
Fig. 3
Now everything is ready for analysis. Go to Excel, press Ctrl + A to select the table, go to the "Insert" tab and click on the "Table" button (see. Fig. 4).
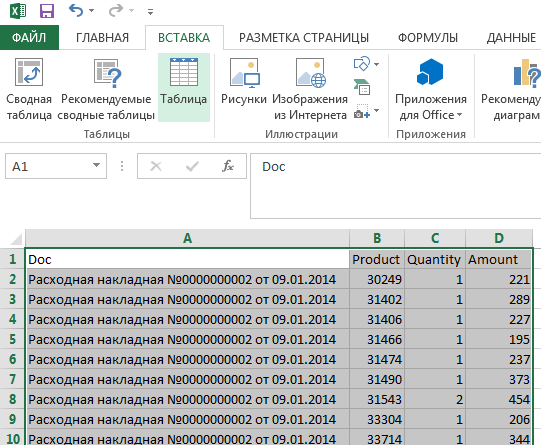
Fig. four.
After that we will see the following picture (see fig. 5).
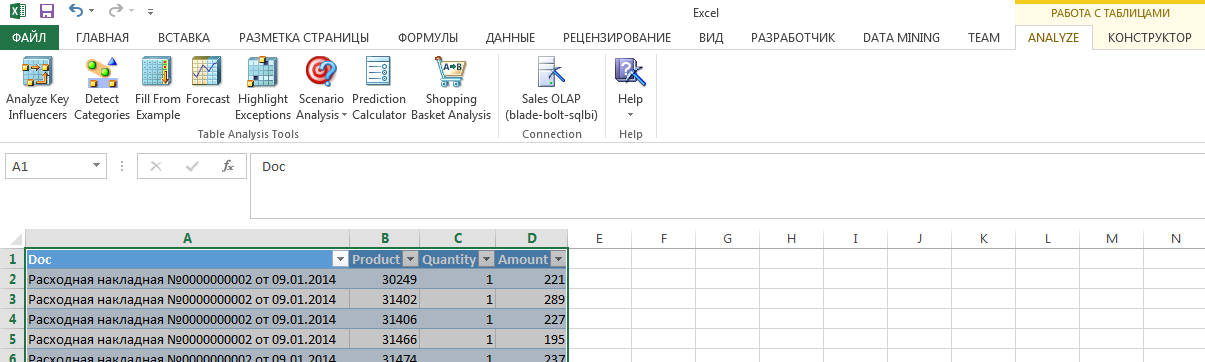
Fig. five.
Now click on the “Shopping Basket Analysis” button. (Pay attention to the adjacent buttons that allow you to perform other types of data analysis, for example, “Detecting Categories”, “Forecast” and others, but this is a topic for individual articles.) In the window that opens, fill in the parameters for analysis . As a transaction (Transaction ID), select the field Doc, Item - Product, Item Value - Quantity. Press the “Run” button (see fig. 6).
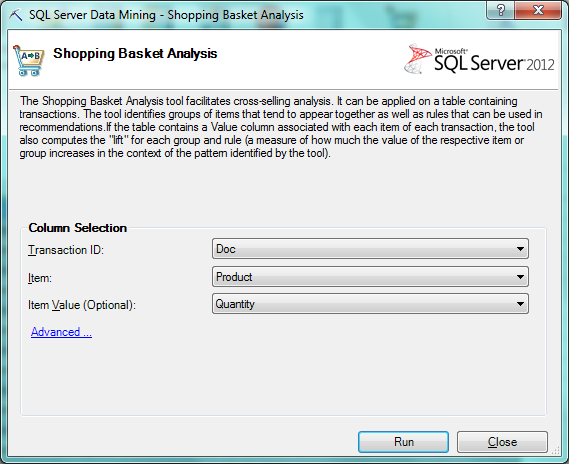
Fig. 6
During the calculation, the program will show such a window (see Fig. 7).
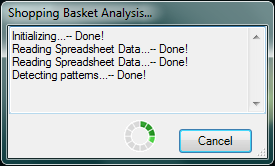
Fig. 7
After the calculation is completed, two new sheets will be automatically added to the Excel workbook:
- Shopping Basket Bundled Items.
- Shopping Basket Recommendations.
Consider the first received label “Shopping Basket Bundled Items”. In it, we see products that are bought together, sorted by total sales (see Fig. 8).
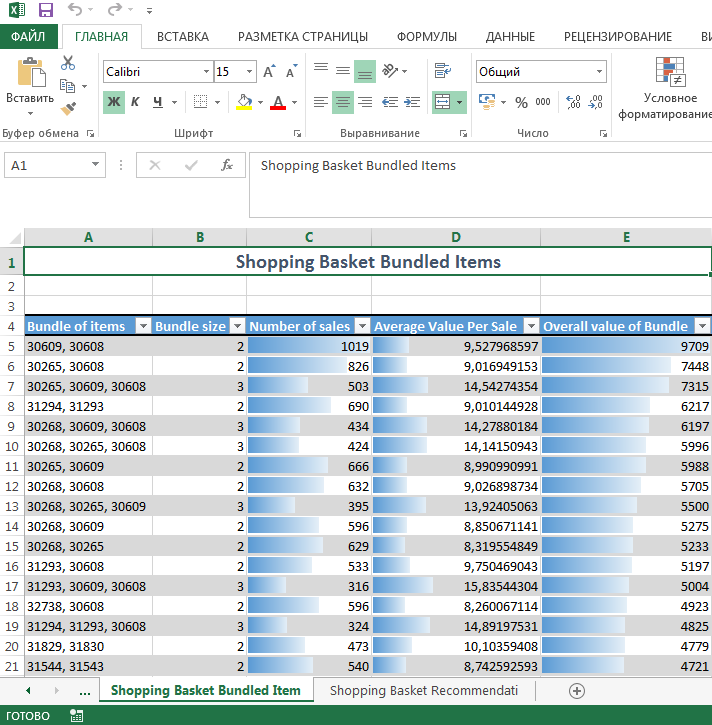
Fig. eight.
And the second table is “Shopping Basket Recommendations”. In it we see the recommendations of the following type - bought the product “Selected Item”, we recommend to buy the product “Recommendation” The data is sorted by the number of joint sales (see Fig. 9).

Fig. 9.
That's all. As you can see, the analysis of the shopping cart is quite simple.
Now back to the question of how to use the data. I personally offered my business the following:
- Check whether the display of goods in the retail network is consistent with the analysis data and, if necessary, change the display.
- Refine the automated system for collecting customer orders in wholesale sales so that when creating a pre-order the information about the recommended order addition is displayed to the sales representative.
If in the next quarter my innovations will bring sales growth, it will be an occasion to ask for a bonus :)
I hope this article will be useful to you. Thanks for reading.
Source: https://habr.com/ru/post/254863/
All Articles