Machine learning in navigation devices: we determine the maneuvers of the machine by the accelerometer and gyroscope
The programs that are available to us today for car navigation are of great help to drivers. They help us navigate in unfamiliar terrain and drive around traffic jams. This is a great work of people from all over the world, which has made our lives easier. But one cannot rest on our laurels, technologies are going forward and the quality of programs should also grow.
Today, in my opinion, one of the problems of navigation devices is that they do not lead the user through the lanes. This problem increases travel time, traffic jams and accidents. Recently, google maps began to display the road markings before the turn, which is already a good result, but even there you can improve a lot. Maps do not know on which lane the car is now located, by means of gps it is problematic to find out, gps has too much error for this. If we knew the current lane, then we would know the speed of movement along the lanes and could well tell the user in an explicit form which lane and when it would be better for him to change lanes. For example, the navigator would say “Continue to hold this lane until the intersection” or “Move to the far left lane”.
')
In this article we will try to tell you how we are trying to determine the rebuilds, the current lane of the car, turns, overtakings, and other maneuvers using machine learning from the accelerometer and gyroscope data.
Recommend rebuilding, it is possible not only if the movement along the lane is slow, for example, due to the fact that the cars are turning from the left lane. Also, it is possible to recommend rebuilding in the event that an accident occurs in the current lane. Now accidents and road problems are applied by users manually. One could make an algorithm that would map them automatically, depending on the maneuvers of the machines. If cars in the same place massively make a detour, then, apparently, there was some kind of problem. Knowing this, the system could warn drivers to change lanes in advance if they no longer occupy it.
Another problem related to the rather low accuracy of gps in the courtyards is that it is rather difficult to determine the position of the car on the winding paths of the surrounding areas. The position is issued with an accuracy of plus or minus 10 meters and it is unclear whether the car has already turned or not. And in an unfamiliar courtyard it is critical, because we focus on the navigator, but in fact he does not always know where we are now. If they could reliably accurately determine the turn, they could lead the user not only by gps, but help the positioning system with data about the turns and would know exactly where the user is.
Gps also can not immediately determine the turn of the car. She had to drive a few meters back before it was clear that the maneuver had been made. If we could determine a turn at once, then the new rebuilt route would be much faster for the user.
Rebuilding a pocket from the main road, also in the case of Gps, is a controversial point, it’s hard to tell now whether it’s rebuilt or not, according to its data, especially if the pocket is not deep. If there were an algoritm that would provide this information in an alternative way, then combining it with Gps, the accuracy could be significantly improved.
In my spare time, I and a few students of Computer Science Center are doing an open source project to identify road events using an accelerometer and a gyroscope. As a result, we want to make an accessible library with an open license, which will allow receiving data from sensors of a mobile phone or some other device at the input to output such events as rebuilding to another lane, overtaking, avoiding obstacles, turning and turning. The library user will have to implement the switch in his program and respond to certain events in the right way.
The library, in theory, can be used not only by telephones, but also, say, by devices based on microcontrollers that monitor transport. I will say right away that we are in the middle of the road and so far there is no certainty that we will be able to determine all the events, but it seems that something might work out.
Events are indicated by broken vertical lines:
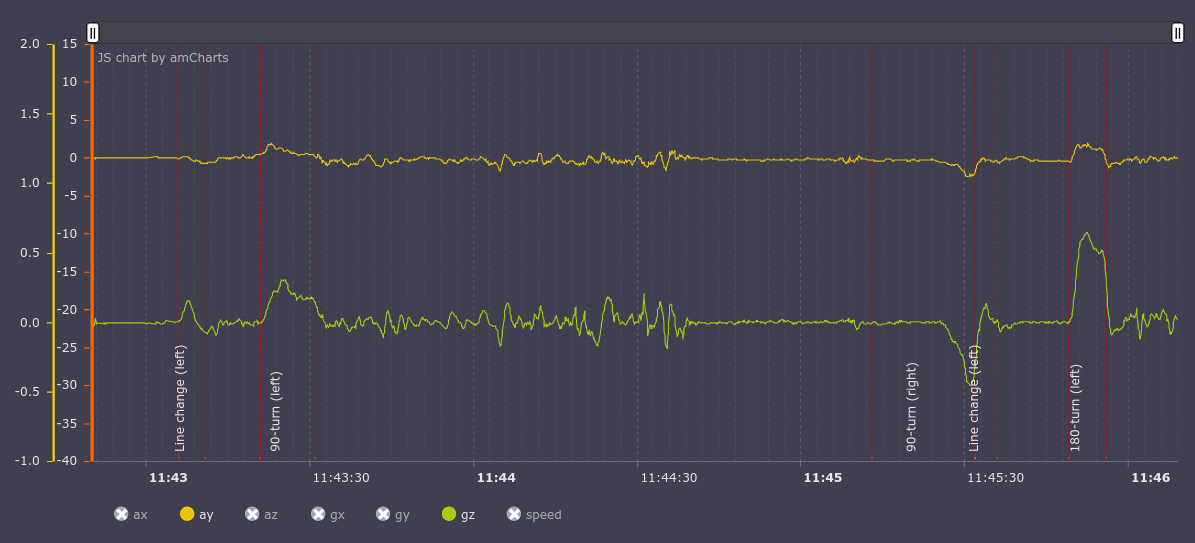
Let us leave only the y axis for the accelerometer (lateral overloads, upper graph) and the z axis of the gyroscope (machine rotation, top view, lower graph) active, you can see how the turns and turns are accompanied by increased lateral overloads and increasing rotation around the Z axis. accelerometer quickly change their performance from positive to negative.
It seems that a person, looking at these graphs, can more or less understand what type of event took place, respectively, the classifier based on the machine learning algorithm should also have no problems.
We collected the initial data: it is about 1000 kilometers of video recordings and telemetry collected from a telephone on the roads of St. Petersburg and Moscow.
Made the environment for easy work with video and data, which looks like this:
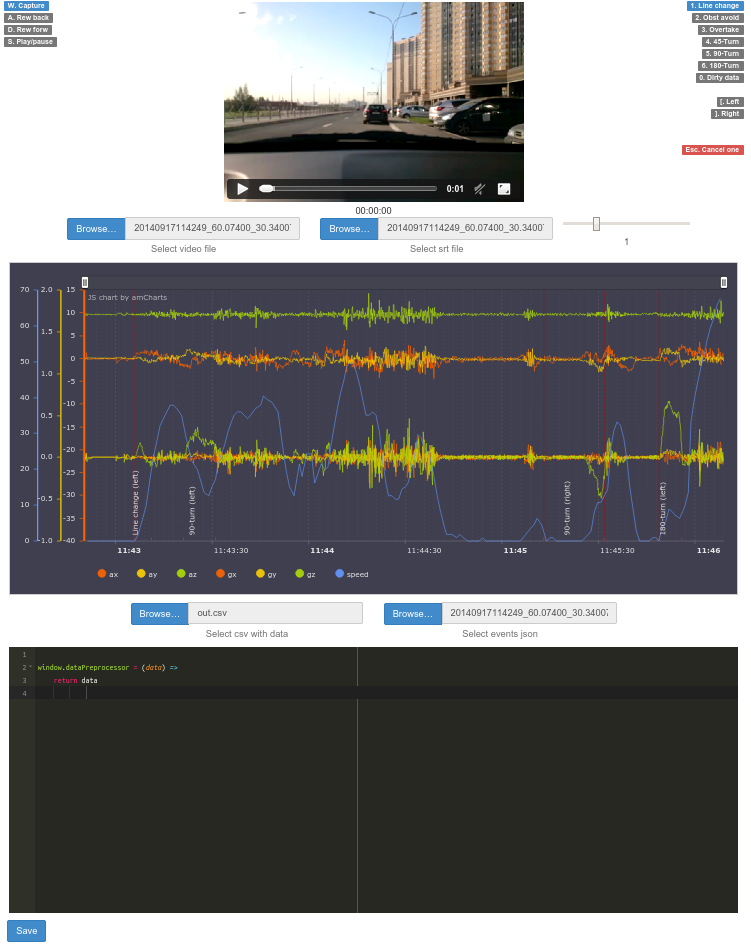
It consists of three parts. At the very top watching the video with the movement of the machine In the center there is a graph on which you can watch data from the accelerometer, gyroscope and current speed. In the window below, you can modify the data script (coffescript) on the fly to display on the graph (for example, we need a smoothed graph).
In addition, Dashboard provides the ability to mark events on the video, save them to a file and see them later marked on the chart with annotations.
Perhaps one of you in your tasks also compares the video sequence with the sensor data, or simply looks at the sensor data. If so, a dashboard in which we work is github.com/blindmotion/dashboard . It is quite convenient, allows you to scale, modify the data on the fly with a script and it has an open license, which means it can be freely used and modified.
Phone can be located as you like in the car, while its position may vary. We need to bring all the data to the same denominator for the transfer of our model. For this, a person from our team wrote a normalizer, a library that, regardless of the orientation of the device, always gives the z axis perpendicular to the Earth, the x axis coincides with the direction of movement of the car, and the y axis is perpendicular to the direction of movement is tangent to the Earth. It looks something like this:
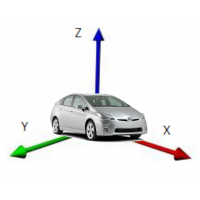
In order for this to work, we first focus on the vector of gravity and build the rotation matrix so that our z axis after the rotation coincides with this vector. The rotation matrix for the correct orientation of x and y is constructed in a slightly more complicated way.
Before normalization, the data looks like this:
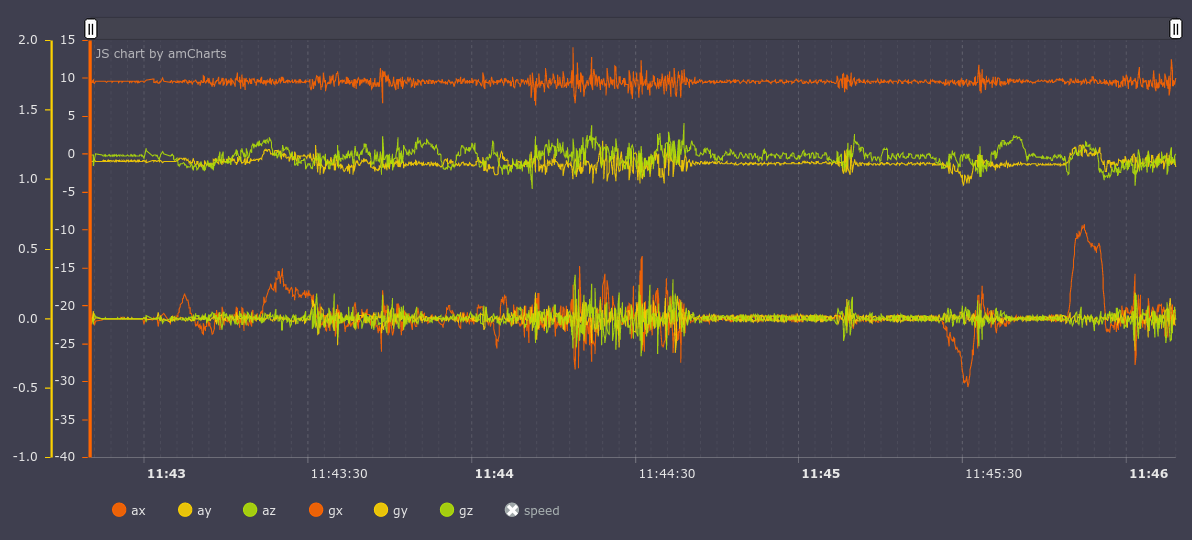
On the accelerometer graph, we see that the X axis (on the graph ax; a is an accelerometer, g is a gyroscope) has almost constantly a value of approximately 10g, which is wrong, since the X axis is parallel to the Earth. Perform normalization and get the following schedule:
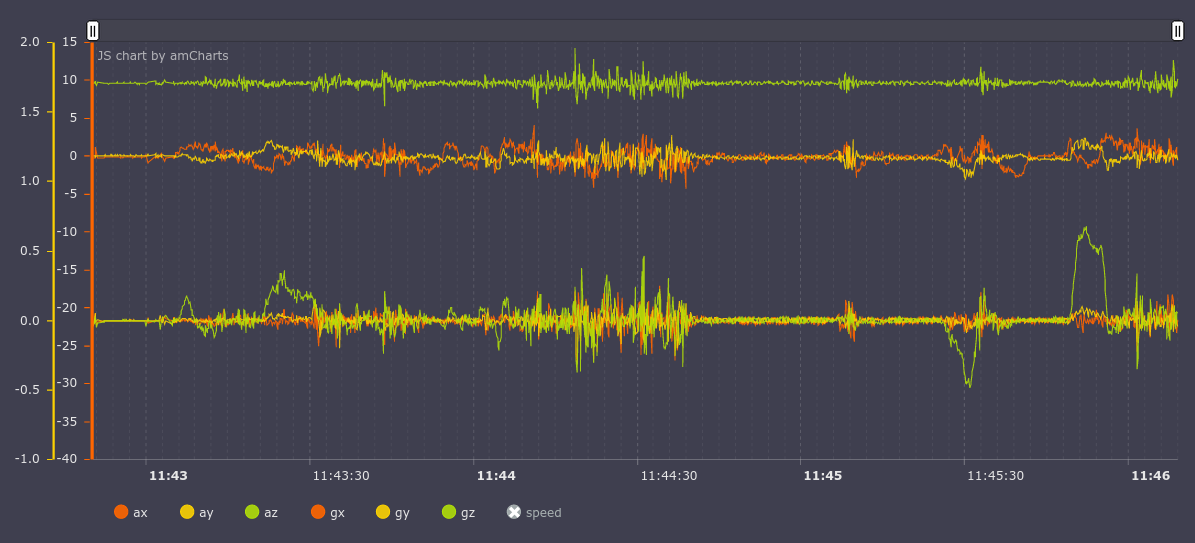
Now everything is in place, the value along the axis Z (az) is 10g, and X and Y are the corresponding values for the movement of the car.
The normalizer can also be useful in other projects that are not related to the classification of events on the road, but related to the processing of data from the sensors.
Now for the classification used feedforward neural network with three hidden layers and it looks like this:
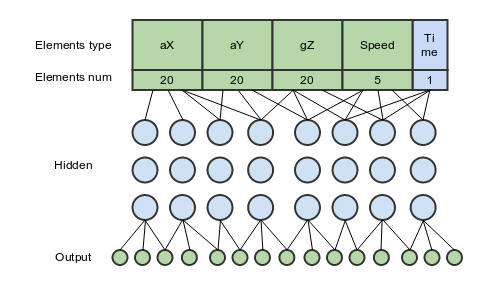
At the entrance serves 66 elements:
20 - accelerometer reading along the normalized X axis (lateral acceleration)
20 - accelerometer reading along the normalized Y axis (longitudinal acceleration)
20 - gyroscope reading along the normalized Z axis (rotation around an axis perpendicular to the Earth)
5 - gps speedometer readings
1 - the whole maneuver time
In this configuration, at first glance, the optimal ratio of input data and result is obtained, although adding other axes improves accuracy very little.
As I said before, the accelerometer and gyroscope readings are fed to the input and there are exactly 20 elements each. That is, we take a period of time, for this period we take the accelerometer readings along the X axis, along the Y axis and the gyroscope along the Z axis. We get three data arrays and not necessarily 20 elements in them initially. By the same 20, we bring them by extrapolation or interpolation.
I talked about the time span. How to choose it? Here we have data for the day. I spoke above about the dashboard, in which we mark the events. That is, in simple terms, we indicate there that from 12:00:34 to 12:00:41 we had a rebuilding to the left. So we indicate all the events that occurred and get some set of events (events). In addition to the events, the rest of the space is occupied by idle, that is, those periods of time during which there were neither rebuildings, turns, nor any other events.
Having received a lot of events in this way, we then successively train each model with each of these events. We give her these events and say that it was overtaking, say.
The model also learns what the absence of events is. We divide the rest of the time, where there are no events, into some intervals and also give models, saying that there is nothing here.
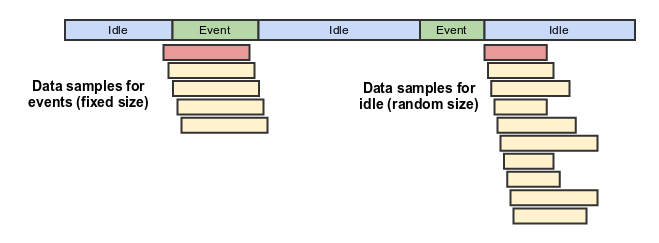
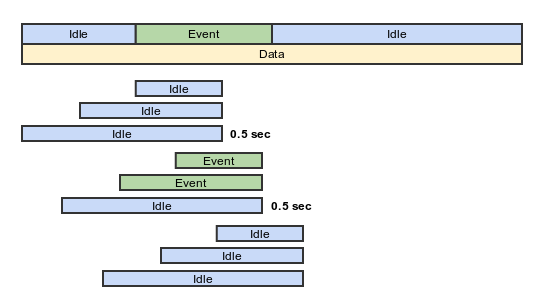
The figure shows this process. At the top of the line is the data on the time axis. Here we had nothing (idle), then the event went, then again nothing, another event, and again nothing. Below this line are samples (yellow squares) that are passed to the models for training.
Having already trained network we can classify events with its help. The mobile phone transmits us a constant stream of data from the sensors. We keep the history of all testimony in the last 30 seconds and pass on this history to our model in the hope that she will be able to find something there. Intervals of length 2, 4, 6, 8, 10, 15, 20, 25, 30 seconds (figuratively) are transmitted and the probability of a particular event predicted by the model is determined for each of the segments.
For example, segments:
[from “current time” to “2 seconds ago”] - probabilities: idle 51%, turning left 23%, turning right 52%
[current time - 4 seconds ago] - idle 62%, turn left 21%, turn right 60%
[current time - 6 seconds ago] - idle 50%, turn left 27%, turn right 91%
[current time - 8 seconds ago] - idle 52%, turn left 17%, turn right 72%
Here, for the length of time from the current moment to 6 seconds ago, the model gives a probability of 91% for turning to the right. Let's say this is more than our threshold of 90% and we add a turn to the right for this time on the event map.
As a result, we get a map of classified events, from which we can try to conclude which events did occur. In practice, the same event, if you make measurements in half a second steps for each of the intervals (that is, every half a second we repeat the above algorithm with segments) can be defined several times (the figure shows 2 times, two green events in the center of the picture). To deal with them, we use the clustering algorithm. I used density-based clustering (DBSCAN). His idea is something like this:
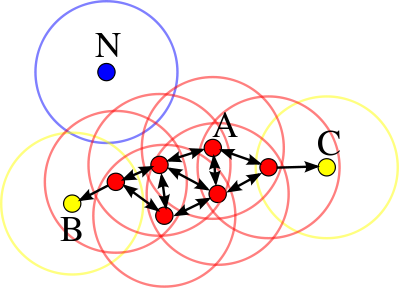
That is, if we were predicted at some point 8 times that there is a rebuilding here to the left, then we understand that yes, the rebuilding really was. In the figure, the horizontal axis is, say, time, and the red dots are the rebuilding determined by the model to the left for different segments close to each other.
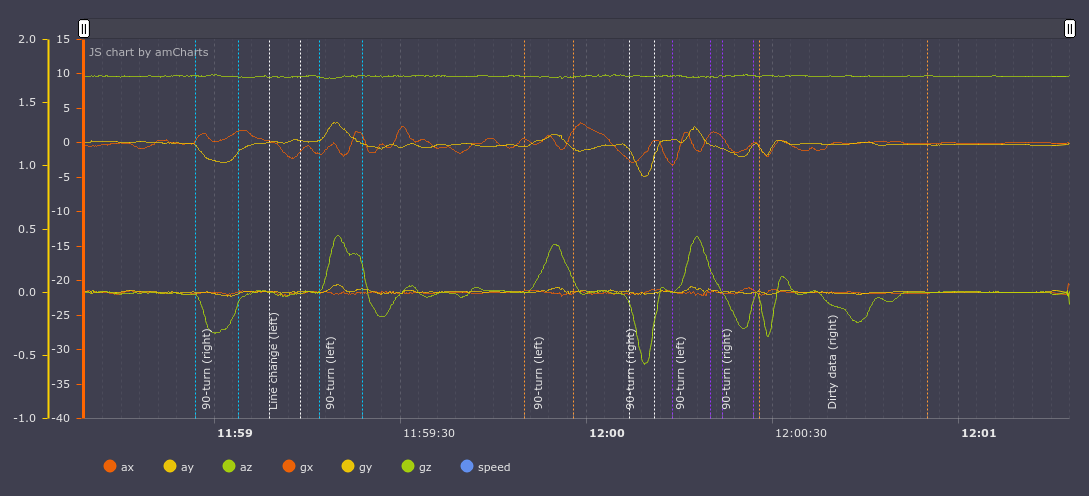
The results of the work can be visually compared by seeing the markup of events made by man and the algorithm.
Events marked by person:
And model:
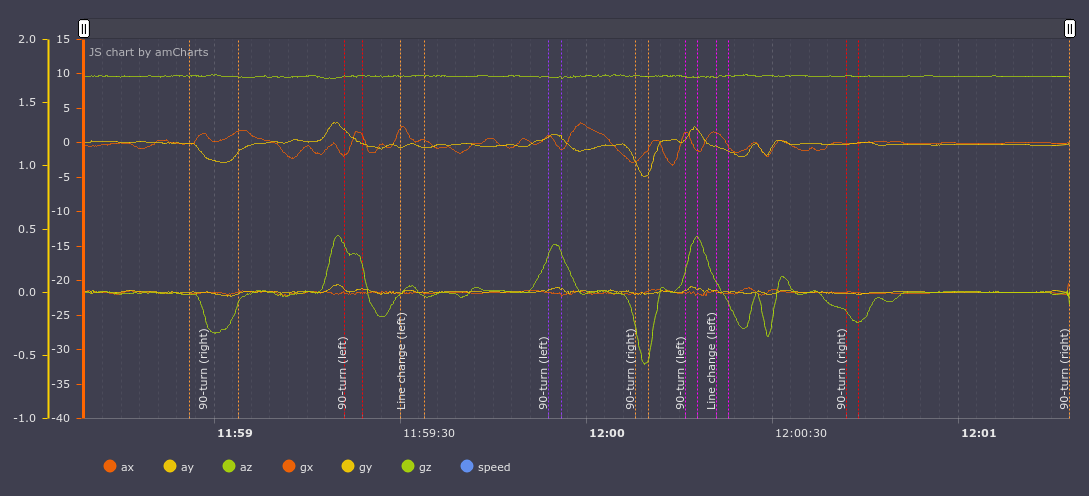
Here you can see that the model skipped rebuilding to the left after the first turn to the right and added rebuilding to the left after turning to the left. But, having seen the video, there this situation seems to be controversial, the trajectory is really similar to a rebuilding to the left. Well, then I missed the turn and at the time of parking I decided that I would turn.
Here is a video of this site (it is better to watch it in hd so that you can see the graph):
Here are the numbers for all the events that were made by the machine in two hours: all rebuilds, turns, overtaking. The number of correctly and incorrectly defined events.
Test set is data on which we did not study and for which our model and clustering algorithm were not corrected in any way.
Correct type:
59 - so many events were determined correctly
Wrong type:
16 - so many events were determined, but not correctly
False positive:
17 - so many events the neural network invented itself, in fact they should not be
False negative:
26 - events that were not identified by the model, but which actually exist
Correct percent
0.5% accuracy rate including False negative
0.6413043478260869 - accuracy percentage not including False negative. Metric with this approach: “I missed something and God bless him, just to not say it wrong”
In general, not bad, considering that there are 10 events in total (5 different, which are divided into left and right), then a random number generator would give us an accuracy of the order, say 10 percent accuracy. And then 50, which is good.
Of course, the numbers do not yet allow talking about the use of the library in real time, but it already allows collecting aggregated statistics and drawing some conclusions based on it, but there are still a lot of errors in terms of real time.
By real time, I mean that while working on a phone or other device, the algorithm will reliably be able to tell the program that it has just been rebuilt. By aggregated statistics, I understand a certain algorithm on the server that collects these events from all devices and draws conclusions based on this.
There is a big field for improvements and I think that in 6-9 months the algorithm can become quite suitable for use in real time.
This is what events look like in the eyes of a neural network. This is a strongly generalized representation, in fact, inside it is much more multifaceted, but by bringing to one plane something like this happens:
These are graphs of lateral acceleration (remember, Y axis). The top row is a rebuild: left and right. You can see that when rebuilding the acceleration changes from one side to the other.
The bottom row turns left and right, the acceleration increases to a certain value and then decreases by the end of the maneuver.
The project is here github.com/blindmotion/docs/wiki and we would be happy if you could use it. It consists of a fairly large number of parts, each of them in a separate repository, the documentation is on the above link.
Next, we plan to improve the classifier so that it can more accurately identify events. When this happens, then, probably, we will try to make a simple application for android, which will pronounce the event that occurred. Let's say you rebuilt or turned and the application reported it.
Our project is an open source project. First of all, you can help us with data. If you can install a video recorder and a program to record sensor values on your phone and turn them on when you are traveling, we would be very grateful and would add you to the list of data contributors on the githaba. We really need data from other people, because you probably have a different phone, another car and a different driving style. This will allow the model to learn from a variety of data.
We can also help us with the layout of these data in our deshbord, this is not the most exciting thing to do, you need to mark up such events as rebuilds, turns, etc. in the video, but welcome.
And of course you can take part in the development of the model itself and the final library. To work on a model, the threshold of entry is the ability to independently make a model that would work approximately the same as the existing one or better in terms of accuracy parameters. From where I can take the marked data for my own model, I naturally tell you.
If you want to help in some way - feel free to write in private or github.
I will be glad to answer your questions in the comments. Thanks for attention.
We do not set ourselves the goal to identify holes and irregularities on the roads; this has already been done before us. But in general, based on this platform, it seems that this is done easily.
Today, in my opinion, one of the problems of navigation devices is that they do not lead the user through the lanes. This problem increases travel time, traffic jams and accidents. Recently, google maps began to display the road markings before the turn, which is already a good result, but even there you can improve a lot. Maps do not know on which lane the car is now located, by means of gps it is problematic to find out, gps has too much error for this. If we knew the current lane, then we would know the speed of movement along the lanes and could well tell the user in an explicit form which lane and when it would be better for him to change lanes. For example, the navigator would say “Continue to hold this lane until the intersection” or “Move to the far left lane”.
')
In this article we will try to tell you how we are trying to determine the rebuilds, the current lane of the car, turns, overtakings, and other maneuvers using machine learning from the accelerometer and gyroscope data.
Recommend rebuilding, it is possible not only if the movement along the lane is slow, for example, due to the fact that the cars are turning from the left lane. Also, it is possible to recommend rebuilding in the event that an accident occurs in the current lane. Now accidents and road problems are applied by users manually. One could make an algorithm that would map them automatically, depending on the maneuvers of the machines. If cars in the same place massively make a detour, then, apparently, there was some kind of problem. Knowing this, the system could warn drivers to change lanes in advance if they no longer occupy it.
Another problem related to the rather low accuracy of gps in the courtyards is that it is rather difficult to determine the position of the car on the winding paths of the surrounding areas. The position is issued with an accuracy of plus or minus 10 meters and it is unclear whether the car has already turned or not. And in an unfamiliar courtyard it is critical, because we focus on the navigator, but in fact he does not always know where we are now. If they could reliably accurately determine the turn, they could lead the user not only by gps, but help the positioning system with data about the turns and would know exactly where the user is.
Gps also can not immediately determine the turn of the car. She had to drive a few meters back before it was clear that the maneuver had been made. If we could determine a turn at once, then the new rebuilt route would be much faster for the user.
Rebuilding a pocket from the main road, also in the case of Gps, is a controversial point, it’s hard to tell now whether it’s rebuilt or not, according to its data, especially if the pocket is not deep. If there were an algoritm that would provide this information in an alternative way, then combining it with Gps, the accuracy could be significantly improved.
How are these problems supposed to be solved?
In my spare time, I and a few students of Computer Science Center are doing an open source project to identify road events using an accelerometer and a gyroscope. As a result, we want to make an accessible library with an open license, which will allow receiving data from sensors of a mobile phone or some other device at the input to output such events as rebuilding to another lane, overtaking, avoiding obstacles, turning and turning. The library user will have to implement the switch in his program and respond to certain events in the right way.
The library, in theory, can be used not only by telephones, but also, say, by devices based on microcontrollers that monitor transport. I will say right away that we are in the middle of the road and so far there is no certainty that we will be able to determine all the events, but it seems that something might work out.
What do different events look like if they are displayed on a chart?
Events are indicated by broken vertical lines:
Let us leave only the y axis for the accelerometer (lateral overloads, upper graph) and the z axis of the gyroscope (machine rotation, top view, lower graph) active, you can see how the turns and turns are accompanied by increased lateral overloads and increasing rotation around the Z axis. accelerometer quickly change their performance from positive to negative.
It seems that a person, looking at these graphs, can more or less understand what type of event took place, respectively, the classifier based on the machine learning algorithm should also have no problems.
What has already been implemented
We collected the initial data: it is about 1000 kilometers of video recordings and telemetry collected from a telephone on the roads of St. Petersburg and Moscow.
Made the environment for easy work with video and data, which looks like this:
It consists of three parts. At the very top watching the video with the movement of the machine In the center there is a graph on which you can watch data from the accelerometer, gyroscope and current speed. In the window below, you can modify the data script (coffescript) on the fly to display on the graph (for example, we need a smoothed graph).
In addition, Dashboard provides the ability to mark events on the video, save them to a file and see them later marked on the chart with annotations.
Perhaps one of you in your tasks also compares the video sequence with the sensor data, or simply looks at the sensor data. If so, a dashboard in which we work is github.com/blindmotion/dashboard . It is quite convenient, allows you to scale, modify the data on the fly with a script and it has an open license, which means it can be freely used and modified.
We also made a normalizer for the accelerometer and gyroscope.
Phone can be located as you like in the car, while its position may vary. We need to bring all the data to the same denominator for the transfer of our model. For this, a person from our team wrote a normalizer, a library that, regardless of the orientation of the device, always gives the z axis perpendicular to the Earth, the x axis coincides with the direction of movement of the car, and the y axis is perpendicular to the direction of movement is tangent to the Earth. It looks something like this:
In order for this to work, we first focus on the vector of gravity and build the rotation matrix so that our z axis after the rotation coincides with this vector. The rotation matrix for the correct orientation of x and y is constructed in a slightly more complicated way.
Before normalization, the data looks like this:
On the accelerometer graph, we see that the X axis (on the graph ax; a is an accelerometer, g is a gyroscope) has almost constantly a value of approximately 10g, which is wrong, since the X axis is parallel to the Earth. Perform normalization and get the following schedule:
Now everything is in place, the value along the axis Z (az) is 10g, and X and Y are the corresponding values for the movement of the car.
The normalizer can also be useful in other projects that are not related to the classification of events on the road, but related to the processing of data from the sensors.
Passed the classifier
Now for the classification used feedforward neural network with three hidden layers and it looks like this:
At the entrance serves 66 elements:
20 - accelerometer reading along the normalized X axis (lateral acceleration)
20 - accelerometer reading along the normalized Y axis (longitudinal acceleration)
20 - gyroscope reading along the normalized Z axis (rotation around an axis perpendicular to the Earth)
5 - gps speedometer readings
1 - the whole maneuver time
In this configuration, at first glance, the optimal ratio of input data and result is obtained, although adding other axes improves accuracy very little.
Learn more about how training is organized.
As I said before, the accelerometer and gyroscope readings are fed to the input and there are exactly 20 elements each. That is, we take a period of time, for this period we take the accelerometer readings along the X axis, along the Y axis and the gyroscope along the Z axis. We get three data arrays and not necessarily 20 elements in them initially. By the same 20, we bring them by extrapolation or interpolation.
I talked about the time span. How to choose it? Here we have data for the day. I spoke above about the dashboard, in which we mark the events. That is, in simple terms, we indicate there that from 12:00:34 to 12:00:41 we had a rebuilding to the left. So we indicate all the events that occurred and get some set of events (events). In addition to the events, the rest of the space is occupied by idle, that is, those periods of time during which there were neither rebuildings, turns, nor any other events.
Having received a lot of events in this way, we then successively train each model with each of these events. We give her these events and say that it was overtaking, say.
The model also learns what the absence of events is. We divide the rest of the time, where there are no events, into some intervals and also give models, saying that there is nothing here.
The figure shows this process. At the top of the line is the data on the time axis. Here we had nothing (idle), then the event went, then again nothing, another event, and again nothing. Below this line are samples (yellow squares) that are passed to the models for training.
Lets have trained, what's next? Let us turn to the definition of events on the new data, that is, the classification.
Having already trained network we can classify events with its help. The mobile phone transmits us a constant stream of data from the sensors. We keep the history of all testimony in the last 30 seconds and pass on this history to our model in the hope that she will be able to find something there. Intervals of length 2, 4, 6, 8, 10, 15, 20, 25, 30 seconds (figuratively) are transmitted and the probability of a particular event predicted by the model is determined for each of the segments.
For example, segments:
[from “current time” to “2 seconds ago”] - probabilities: idle 51%, turning left 23%, turning right 52%
[current time - 4 seconds ago] - idle 62%, turn left 21%, turn right 60%
[current time - 6 seconds ago] - idle 50%, turn left 27%, turn right 91%
[current time - 8 seconds ago] - idle 52%, turn left 17%, turn right 72%
Here, for the length of time from the current moment to 6 seconds ago, the model gives a probability of 91% for turning to the right. Let's say this is more than our threshold of 90% and we add a turn to the right for this time on the event map.
As a result, we get a map of classified events, from which we can try to conclude which events did occur. In practice, the same event, if you make measurements in half a second steps for each of the intervals (that is, every half a second we repeat the above algorithm with segments) can be defined several times (the figure shows 2 times, two green events in the center of the picture). To deal with them, we use the clustering algorithm. I used density-based clustering (DBSCAN). His idea is something like this:
That is, if we were predicted at some point 8 times that there is a rebuilding here to the left, then we understand that yes, the rebuilding really was. In the figure, the horizontal axis is, say, time, and the red dots are the rebuilding determined by the model to the left for different segments close to each other.
Classifier results
The results of the work can be visually compared by seeing the markup of events made by man and the algorithm.
Events marked by person:
And model:
Here you can see that the model skipped rebuilding to the left after the first turn to the right and added rebuilding to the left after turning to the left. But, having seen the video, there this situation seems to be controversial, the trajectory is really similar to a rebuilding to the left. Well, then I missed the turn and at the time of parking I decided that I would turn.
Here is a video of this site (it is better to watch it in hd so that you can see the graph):
What is the accuracy of the classifier? For test set the following numbers
Here are the numbers for all the events that were made by the machine in two hours: all rebuilds, turns, overtaking. The number of correctly and incorrectly defined events.
Test set is data on which we did not study and for which our model and clustering algorithm were not corrected in any way.
Correct type:
59 - so many events were determined correctly
Wrong type:
16 - so many events were determined, but not correctly
False positive:
17 - so many events the neural network invented itself, in fact they should not be
False negative:
26 - events that were not identified by the model, but which actually exist
Correct percent
0.5% accuracy rate including False negative
0.6413043478260869 - accuracy percentage not including False negative. Metric with this approach: “I missed something and God bless him, just to not say it wrong”
In general, not bad, considering that there are 10 events in total (5 different, which are divided into left and right), then a random number generator would give us an accuracy of the order, say 10 percent accuracy. And then 50, which is good.
Of course, the numbers do not yet allow talking about the use of the library in real time, but it already allows collecting aggregated statistics and drawing some conclusions based on it, but there are still a lot of errors in terms of real time.
By real time, I mean that while working on a phone or other device, the algorithm will reliably be able to tell the program that it has just been rebuilt. By aggregated statistics, I understand a certain algorithm on the server that collects these events from all devices and draws conclusions based on this.
There is a big field for improvements and I think that in 6-9 months the algorithm can become quite suitable for use in real time.
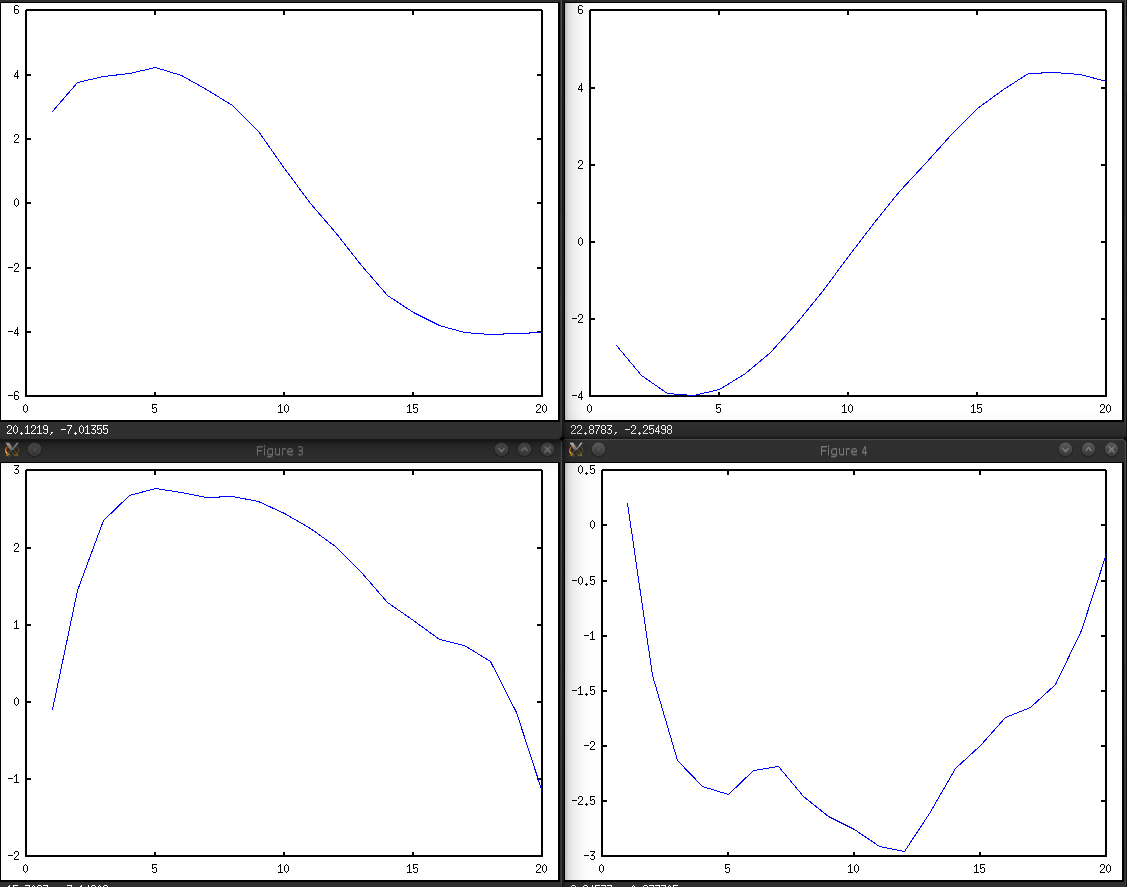
How different events look through the eyes of a neural network
This is what events look like in the eyes of a neural network. This is a strongly generalized representation, in fact, inside it is much more multifaceted, but by bringing to one plane something like this happens:
These are graphs of lateral acceleration (remember, Y axis). The top row is a rebuild: left and right. You can see that when rebuilding the acceleration changes from one side to the other.
The bottom row turns left and right, the acceleration increases to a certain value and then decreases by the end of the maneuver.
Where to look at the project
The project is here github.com/blindmotion/docs/wiki and we would be happy if you could use it. It consists of a fairly large number of parts, each of them in a separate repository, the documentation is on the above link.
What's next
Next, we plan to improve the classifier so that it can more accurately identify events. When this happens, then, probably, we will try to make a simple application for android, which will pronounce the event that occurred. Let's say you rebuilt or turned and the application reported it.
How can you help
Our project is an open source project. First of all, you can help us with data. If you can install a video recorder and a program to record sensor values on your phone and turn them on when you are traveling, we would be very grateful and would add you to the list of data contributors on the githaba. We really need data from other people, because you probably have a different phone, another car and a different driving style. This will allow the model to learn from a variety of data.
We can also help us with the layout of these data in our deshbord, this is not the most exciting thing to do, you need to mark up such events as rebuilds, turns, etc. in the video, but welcome.
And of course you can take part in the development of the model itself and the final library. To work on a model, the threshold of entry is the ability to independently make a model that would work approximately the same as the existing one or better in terms of accuracy parameters. From where I can take the marked data for my own model, I naturally tell you.
If you want to help in some way - feel free to write in private or github.
I will be glad to answer your questions in the comments. Thanks for attention.
FAQ.
We do not set ourselves the goal to identify holes and irregularities on the roads; this has already been done before us. But in general, based on this platform, it seems that this is done easily.
Source: https://habr.com/ru/post/254707/
All Articles