How to improve performance for free, without registration and SMS
Hi, Habr! I work as an intern in the St. Petersburg EMC Development Center and I want to give students a couple of tips on building a future career, as well as tell you about the tasks that I do in the company. This year, for one of my decisions, I received the Bright Internship Award as the Center's best intern, and I’m interested to get feedback on the results achieved. This article may be of interest to those involved in testing system performance.
The story of my acquaintance with EMC dates back to a hike at an IT exhibition for young IT applicants - Bit-Byte. I went through all the corporate stands, filled out dozens of very dubious leaves and took a few business cards. When you want to quickly begin to gain experience in their field and get paid for it, you don’t really think about a place to start a career.
Many companies claim that students come to them who are aware of its place in the IT market, its products, customers, etc. But based on my personal experience, I can say that it is not. 90% of students simply send resumes to all possible positions in several companies, even without changing the text for a specific job. And I was no exception: when I came home, I sent out my resume to all the e-mail addresses that were on the business cards I took. It always seemed to me that it was in the order of things: hundreds of people send letters with responses every month, dozens are invited for interviews, and only a few are hired. This forces you to cover as many companies as possible in your newsletter to increase your chances of being recruited. The next day I solved various test tasks, and a week later I was invited to several interviews.
')
It so happened that after my first visit to EMC, I was refused. This made me come to the second interview more seriously. The questions that were asked at the interviews are beyond the scope of this article, I can only say that these two meetings were completely different. At one of them they gave me the opportunity to solve algorithmic problems, and on the other there were many questions for a common IT outlook.
When I was hired by EMC, I completed my third year undergraduate degree. Then I understood perfectly well that now is the time to try my hand at real projects, in a team of professionals from whom you can learn a lot. It so happened that it was EMC that became my starting point in the world of industrial engineering. And after a year and a half, I can safely say that this is a great place to start.
In the internship program, much depends on the mentor whom you have been assigned, because he will give you the first tasks, suggest and monitor the implementation of the tasks, the choice of methods for solving them, etc. Huge plus if this person will conduct your interview. I think many experienced developers are trying to find a student trainee who is close in spirit and to other purely personal qualities, in addition to professional knowledge, skills and abilities. It was just such a creative union that gave me tremendous potential for future accomplishments. Now I can say with confidence that I was very lucky with a mentor.
I do not recall any special first impressions of working in a team in a large corporation. I was well aware of the conditions in which employees work in firms of this level. Habr teems with reviews of developers who moved to Google, Yahoo, Amazon and other corporations, with all the details and colors of overseas life. Rather, I was simply pleased with the fact that I had the opportunity to work in my specialty. Yes, the atmosphere here is very different from the one that prevails in the university, there was a pleasant feeling of novelty and lack of information in what is happening.
My work in the company is related to optimizing the performance of the EMC PowerPath product. In general terms, it is software running on servers in a SAN that optimizes the use of paths in storage networks based on FC, iSCSI and FCoE to provide predictable, scalable and consistent access to information. This software ensures efficient use of all data transfer channels and eliminates the need for several separate path management solutions for heterogeneous operating systems.
Optimization always involves many aspects of software development, you must understand the functionality of the product, be able to test it and automate the actions performed. At first it was quite difficult to penetrate into the logic of the product, and the process of adaptation to the existing code took quite a long time. I had to quickly learn Perl, tools for profiling various operating systems, the shell, standard Windows and Unix utilities.
In this particular case, testing consists of dynamic verification of the program's behavior on the final set of tests, the program itself is represented as a “black box”. In this case, the tests are selected from the usually performed actions of the application area and provide verification of compliance with the expected behavior of the system. Very often, when developing a software package, one has to face one of two problems. Either the quality of the developed product is below the minimum requirements: either the cost of testing exceeds all reasonable limits. In order to reduce the cost of testing the program behavior in various environments, it is necessary to automate this process as much as possible.
It was for creating EMC PowerPath test automation tools and multipathing systems built into the OS that I received the EMC Bright Internship Award. This approach to performance testing has significantly improved product performance by identifying problems (bottlenecks), the solution of which provided a significant increase in performance (in particular, on the AIX platform (> 30%)). The point is this: measurement of the bandwidth of the basic OS utilities is carried out in order to compare the obtained calculations with the results for the software product from EMC, deployed with various physical and software components of the subsystem. This is done without unnecessary time, automated and unified. A complex was needed that would be highly efficient and versatile from the point of view of applicability to test automation on any operating system (AIX, ESXi, RHEL, WS), and also would not require significant labor costs for its application. Next, I will talk about how I did it.
First, let's define the software for data generation (I / O benchmarks) - this is an application that allows you to run a synthetic test of disk and network subsystems, both for single and cluster systems. It can be used as a basic tool for laboratory research and troubleshooting. It can be easily configured to reproduce the load (imitation of behavior) from many popular applications by specifying test patterns.
To test the balancing mechanism used in the product, in terms of evaluating its performance, I use three different software products for generating data blocks: Iometer, Iorate and Vdbench. Their comparative characteristics are given in the table:
One of the key parameters is the ability to generate random data blocks, since EMC manufactures storage systems that support deduplication technology. Such storage systems retain only links to repeating blocks (for example, 4 kB each), which is much faster than writing a whole block. Based on this, the load from repetitive data for some storage systems does not provide adequate performance results, in which case Vdbench is used.
In order to run the program for generating data, it needs to send a configuration file to the input, which will describe all the parameters of the upcoming launch. To test the performance of storage and load balancing between data paths, I use two types of tests:
A pattern is a sample that is used to describe all the parameters of a data block. Each test can consist of one or several patterns, specified in percentage. The pattern has the following parameters:
The random access time is the average time during which the hard drive performs the positioning operation of the read / write head on an arbitrary section of the magnetic disk. Only relevant for devices based on the principle of magnetic recording.
As an explanation of the above, the table lists the UIO tests for performance testing:
As a result of launching the software for generating data with a configuration file (or several), a specific quantitative result will be obtained for each type of test.
In addition to the pattern, each test has several basic characteristics, some of which are integral:
The values of these parameters are entered into the configuration file and do not change during the launch.
Each of the three programs, Iometer, Iorate, Vdbench, generates one or several output files containing, besides useful information for further analysis, and various minor data on the launch. Therefore, it is necessary to develop scripts that will allow parsing the resulting files in order to extract and convert data into the desired unified format.
To automate the process of obtaining visual information about the current state of the load balancing tools, it is necessary to unify the test results obtained from different operating systems and various data generators. For this, it is necessary to develop special scripts that can be run absolutely on all platforms supported by this generator.
These scripts, in addition to generating the resulting file, will have to completely control the testing process, log the operations performed and the current system configuration. Also, scripts should be able to change load balancing policies, check the availability and availability of devices.
Let us dwell on the organization of the "laboratory" for research:
Host side:
With the exception of AIX with proprietary IBM hosts, the Dell PowerEdge R710 physical machines are used:
Memory: 11898Mb RAM
Processor: Intel Xeon CPU E5530 @ 2.40GHz
CPU: 2394.172 MHz
Cache Size: 8192 KB
with 2 physical sockets, 8 physical cores, 8 hyper-threading cores.
The remaining settings of the host, in conjunction with the test case:
OS: ESXi, RHEL, Windows Server, AIX
Number of cores: 4/8/16
Logical Units: 4/8/16
Logical Unit size: 5GB (Small volume drives for maximum IOPS)
Threads per LU: 64 for 4 LU, 32 for 8 LU, 8 for 16 LU, 4 for> 16LU
Storage side:
EMC XtremIO, 1 X-Brick configuration
EMC Symmetrix VMAX
EMC VNX
SAN:
Dedicated FC Switch, 8Gb Fiber Channel ports

Jamming configuration
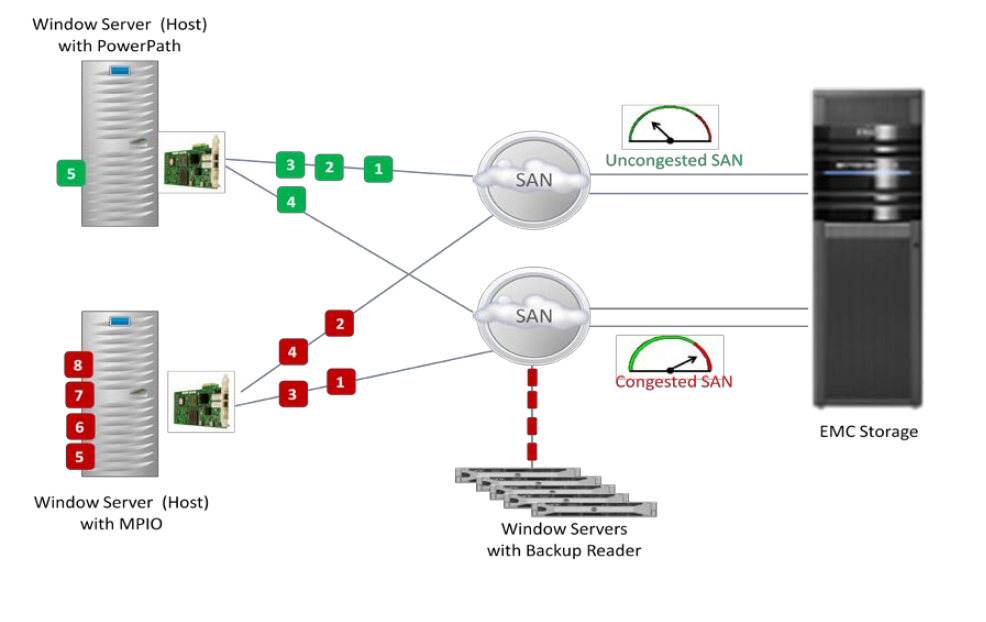
Jamming test configuration is used to simulate bottlenecks in a SAN. Specifically, this illustration uses the Windows Server OS, although in fact it can be any. The system uses two hosts: one with the PowerPath preinstalled (then MPIO), and performance calculations are performed on it; the other is stressful. Each server is connected to a different SAN with storage. The red path to the data is marked, green is the free path.
PowerPath Adaptive Policy determines how busy the path is and allows you to redistribute the load on the free. This configuration allows you to create conditions that may well arise in a real laboratory at the customers (a specific path fails, an illiterate configuration, one common SAN to several servers, etc.). Conditions in which native multipathing will function at the speed of the slowest path, and the PowerPath must show a significantly higher IOPS.
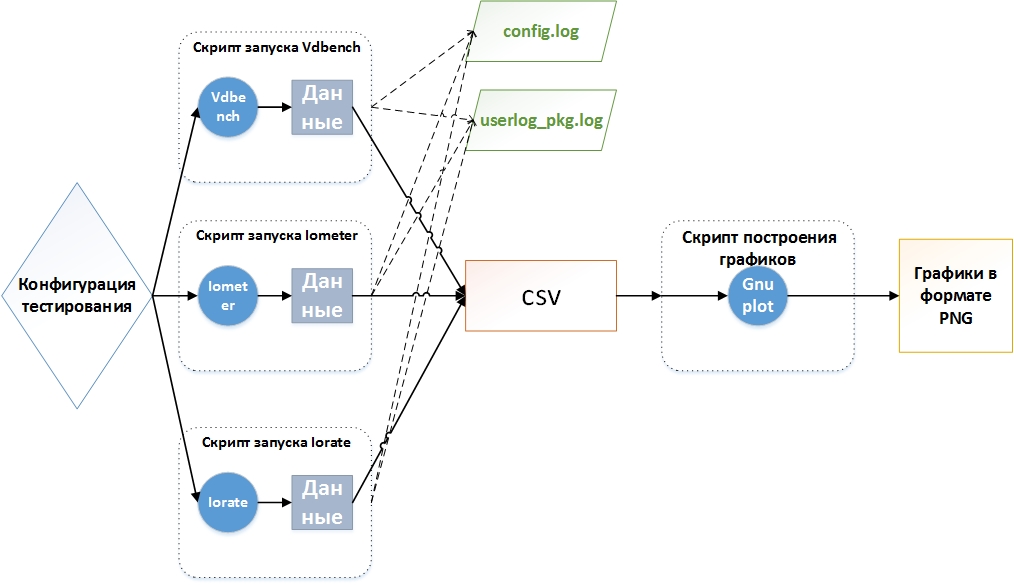
The results are presented in the form of graphs, which are built using the Gnuplot program. It has its own command system, it can work in command line mode and execute scripts read from files. Gnuplot can both save graphics as various graphic file formats (command mode) and display them on the screen.
The figure shows the complete scheme for automated testing, from configuration to obtaining results to be further evaluated.
Let us dwell in more detail on the configuration of testing. An important parameter at the start of testing scenarios is the number of launches. Often, when testing PowerPath and NMP, the problem arises of deviation of the obtained performance value from the average value, expressed as a percentage. In this paper, it was decided to take for tolerance a value less than or equal to 5%. If the variance from the average for all starts exceeds the set bar, then we cannot assess the throughput, and such tests require further analysis and replay.
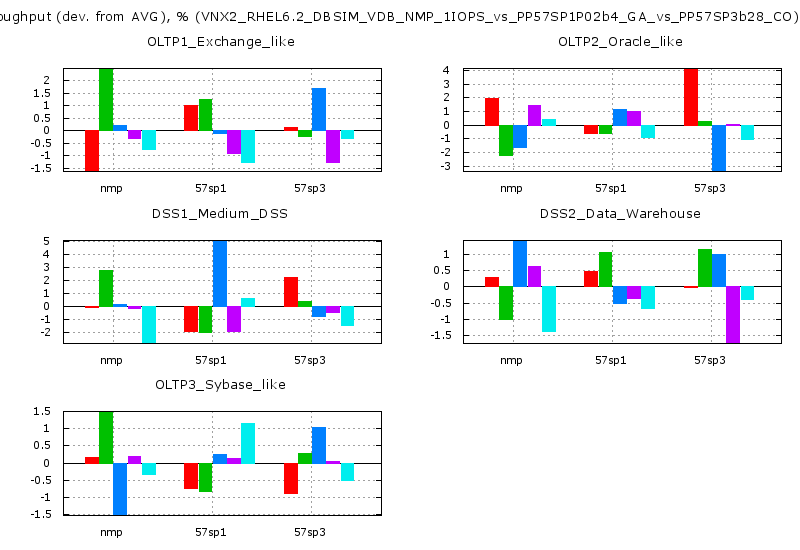
As an example, below is the result of a real DBSIM test. Gnuplot was used to build histograms, and a special script was generated at the input. All the construction of the resulting images was written in Perl. I cannot go into details of the implementation of this automation object due to commercial secrets.
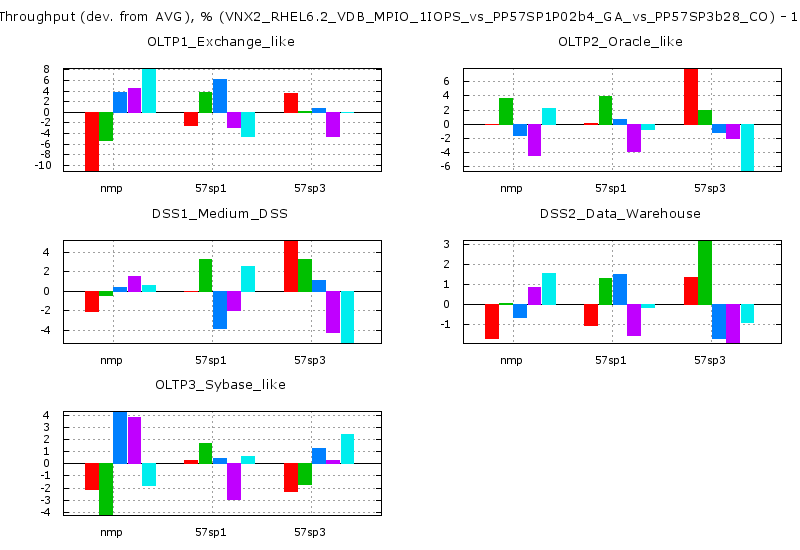
The “y” axis represents the deviation of a particular launch from the average value in% (throughput). Focusing on the x axis, we can see which version of PowerPath or NMP (Native Multipathing), the built-in balancing tool) belong to these results. The graph clearly shows that in some tests there are launches with a deviation of more than 5%, and some approach this value. Such testing requires further research.
The deviation itself is primarily related to the physical and software implementation of a specific storage system. In addition, it can be caused by the presence of a large number of threads that control the sending and receiving of data from the disk. This phenomenon does not occur on all storage systems and is practically independent of the IO-generator. In addition to the number of launches, the following parameters affect the objectivity of the final results:
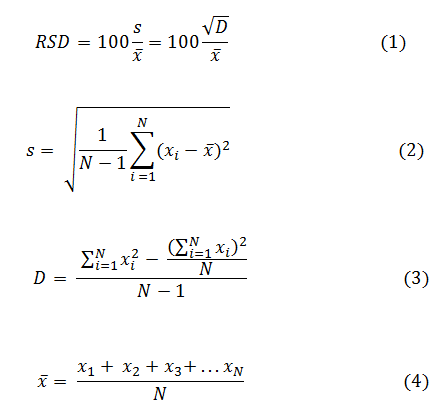
In order to ensure the quality and relevance of the test results, a great deal of analytical work was done. In configurations in which there is a large scatter of the resulting data, tests were run with a long execution time, and the values of bandwidth were saved to the log at intervals of 10 seconds. With the help of a statistical analysis of the results obtained, it is possible to correctly select various time intervals and the number of launches for specific tests in a given configuration. These intervals can be summed up and get the time intervals of any duration. For such amounts, the relative standard deviation (RSD or relative standard deviation, also called the coefficient of variation) is calculated, which characterizes the homogeneity of the data, which is a valuable statistical characteristic. The magnitude of the coefficient of variation can be judged on the degree of variation of the characteristics of the population. The greater its value, the greater the spread relative to the average value, the less homogeneous the set in its composition and the less representative the average. The coefficient of variation (1) is the ratio of the standard deviation (2) to the arithmetic mean (4), expressed as a percentage. The standard deviation, in turn, can be found as the root of the variance (3). N is the number of independent tests.
In contrast to the deviation from the mean, which we paid attention to when constructing histograms, RSD makes it possible to most accurately represent the dispersion of a trait and its value relative to the values themselves (relative indicator, not absolute). Now we select the time interval for a specific test and we will consider it acceptable if the RSD value for all such intervals is less than or equal to 5%.
After the calculations and the redistribution of time intervals, we repeat the testing and build graphs using the same Perl script. The magnitude of the deviation from the average has noticeably decreased and the test results most accurately reflect the real picture of the software performance.
Let's summarize the work done:
For myself, I can conclude that a quick, transparent and unified conduct of automatic testing of the product being developed allows it to develop at a significantly faster rate. In particular, thanks to this approach, we were able to increase the performance of the EMC PowerPath on AIX by more than 30%.
I want to advise you not to delay the start of a career in your specialty, because work experience in the professional sphere is valued above others. Upon graduation from the university, in addition to scientific publications, general knowledge and the average score, it is desirable to have experience related to the practice and “combat” use of knowledge. And then you will be highly appreciated as a specialist with relevant skills, able to participate in real projects and generate profits.
Some lyrics (or how I stopped being afraid and got an internship)
The story of my acquaintance with EMC dates back to a hike at an IT exhibition for young IT applicants - Bit-Byte. I went through all the corporate stands, filled out dozens of very dubious leaves and took a few business cards. When you want to quickly begin to gain experience in their field and get paid for it, you don’t really think about a place to start a career.
Many companies claim that students come to them who are aware of its place in the IT market, its products, customers, etc. But based on my personal experience, I can say that it is not. 90% of students simply send resumes to all possible positions in several companies, even without changing the text for a specific job. And I was no exception: when I came home, I sent out my resume to all the e-mail addresses that were on the business cards I took. It always seemed to me that it was in the order of things: hundreds of people send letters with responses every month, dozens are invited for interviews, and only a few are hired. This forces you to cover as many companies as possible in your newsletter to increase your chances of being recruited. The next day I solved various test tasks, and a week later I was invited to several interviews.
')
It so happened that after my first visit to EMC, I was refused. This made me come to the second interview more seriously. The questions that were asked at the interviews are beyond the scope of this article, I can only say that these two meetings were completely different. At one of them they gave me the opportunity to solve algorithmic problems, and on the other there were many questions for a common IT outlook.
When I was hired by EMC, I completed my third year undergraduate degree. Then I understood perfectly well that now is the time to try my hand at real projects, in a team of professionals from whom you can learn a lot. It so happened that it was EMC that became my starting point in the world of industrial engineering. And after a year and a half, I can safely say that this is a great place to start.
In the internship program, much depends on the mentor whom you have been assigned, because he will give you the first tasks, suggest and monitor the implementation of the tasks, the choice of methods for solving them, etc. Huge plus if this person will conduct your interview. I think many experienced developers are trying to find a student trainee who is close in spirit and to other purely personal qualities, in addition to professional knowledge, skills and abilities. It was just such a creative union that gave me tremendous potential for future accomplishments. Now I can say with confidence that I was very lucky with a mentor.
I do not recall any special first impressions of working in a team in a large corporation. I was well aware of the conditions in which employees work in firms of this level. Habr teems with reviews of developers who moved to Google, Yahoo, Amazon and other corporations, with all the details and colors of overseas life. Rather, I was simply pleased with the fact that I had the opportunity to work in my specialty. Yes, the atmosphere here is very different from the one that prevails in the university, there was a pleasant feeling of novelty and lack of information in what is happening.
Entry about performance evaluation
My work in the company is related to optimizing the performance of the EMC PowerPath product. In general terms, it is software running on servers in a SAN that optimizes the use of paths in storage networks based on FC, iSCSI and FCoE to provide predictable, scalable and consistent access to information. This software ensures efficient use of all data transfer channels and eliminates the need for several separate path management solutions for heterogeneous operating systems.
Optimization always involves many aspects of software development, you must understand the functionality of the product, be able to test it and automate the actions performed. At first it was quite difficult to penetrate into the logic of the product, and the process of adaptation to the existing code took quite a long time. I had to quickly learn Perl, tools for profiling various operating systems, the shell, standard Windows and Unix utilities.
In this particular case, testing consists of dynamic verification of the program's behavior on the final set of tests, the program itself is represented as a “black box”. In this case, the tests are selected from the usually performed actions of the application area and provide verification of compliance with the expected behavior of the system. Very often, when developing a software package, one has to face one of two problems. Either the quality of the developed product is below the minimum requirements: either the cost of testing exceeds all reasonable limits. In order to reduce the cost of testing the program behavior in various environments, it is necessary to automate this process as much as possible.
It was for creating EMC PowerPath test automation tools and multipathing systems built into the OS that I received the EMC Bright Internship Award. This approach to performance testing has significantly improved product performance by identifying problems (bottlenecks), the solution of which provided a significant increase in performance (in particular, on the AIX platform (> 30%)). The point is this: measurement of the bandwidth of the basic OS utilities is carried out in order to compare the obtained calculations with the results for the software product from EMC, deployed with various physical and software components of the subsystem. This is done without unnecessary time, automated and unified. A complex was needed that would be highly efficient and versatile from the point of view of applicability to test automation on any operating system (AIX, ESXi, RHEL, WS), and also would not require significant labor costs for its application. Next, I will talk about how I did it.
What was done
First, let's define the software for data generation (I / O benchmarks) - this is an application that allows you to run a synthetic test of disk and network subsystems, both for single and cluster systems. It can be used as a basic tool for laboratory research and troubleshooting. It can be easily configured to reproduce the load (imitation of behavior) from many popular applications by specifying test patterns.
To test the balancing mechanism used in the product, in terms of evaluating its performance, I use three different software products for generating data blocks: Iometer, Iorate and Vdbench. Their comparative characteristics are given in the table:
| Title | YAP | Open source | Supported OS | Generate random data blocks |
|---|---|---|---|---|
| lometer | C ++ | Yes | Windows, Linux, Solaris, Netware | Not |
| lorate | C | Yes | AIX, HP-UX, HP-US, Solaris zLinux, Linux | Not |
| Vdbench | Java | Yes | All major | Yes |
One of the key parameters is the ability to generate random data blocks, since EMC manufactures storage systems that support deduplication technology. Such storage systems retain only links to repeating blocks (for example, 4 kB each), which is much faster than writing a whole block. Based on this, the load from repetitive data for some storage systems does not provide adequate performance results, in which case Vdbench is used.
In order to run the program for generating data, it needs to send a configuration file to the input, which will describe all the parameters of the upcoming launch. To test the performance of storage and load balancing between data paths, I use two types of tests:
- UIO (Uniformed I / O) - tests with a fixed data size, each of which is based on only one pattern.
- DBSIM (DataBase SIMulation) - tests based on mixing different patterns in a certain ratio to emulate the operation of a real business system, for example, OLTP. With this approach, blocks of different sizes are sent in turn.
A pattern is a sample that is used to describe all the parameters of a data block. Each test can consist of one or several patterns, specified in percentage. The pattern has the following parameters:
- The size of the data block;
- % read / write;
- % random / sequential I / O, disk access model when reading or writing a block. With a sequential model of disk access, writing and reading occur much faster, since it does not perform a random access operation.
The random access time is the average time during which the hard drive performs the positioning operation of the read / write head on an arbitrary section of the magnetic disk. Only relevant for devices based on the principle of magnetic recording.
As an explanation of the above, the table lists the UIO tests for performance testing:
| Test name | Size, byte | % reading | % random model |
|---|---|---|---|
| 4K_Seq_Read_Only | 4096 | 100 | 0 |
| 64K_Rand_Write_Only | 65536 | 0 | 100 |
| 256K_Rand_Read_50 | 262144 | 50 | 100 |
As a result of launching the software for generating data with a configuration file (or several), a specific quantitative result will be obtained for each type of test.
In addition to the pattern, each test has several basic characteristics, some of which are integral:
- Run time - the time during which all the results of the calculations will affect the final result. Usually measured in seconds.
- Warm up time - warm-up time, during which the results of calculations are not included in the final result. Measured in seconds.
- Pause time - idle time between tests. Measured in seconds.
- IO rate - the maximum possible data transfer rate, measured in read / write operations per second (IOPS), by default without restrictions.
The values of these parameters are entered into the configuration file and do not change during the launch.
Each of the three programs, Iometer, Iorate, Vdbench, generates one or several output files containing, besides useful information for further analysis, and various minor data on the launch. Therefore, it is necessary to develop scripts that will allow parsing the resulting files in order to extract and convert data into the desired unified format.
To automate the process of obtaining visual information about the current state of the load balancing tools, it is necessary to unify the test results obtained from different operating systems and various data generators. For this, it is necessary to develop special scripts that can be run absolutely on all platforms supported by this generator.
These scripts, in addition to generating the resulting file, will have to completely control the testing process, log the operations performed and the current system configuration. Also, scripts should be able to change load balancing policies, check the availability and availability of devices.
Configuration "laboratory" for research
Let us dwell on the organization of the "laboratory" for research:
Standard system configuration
Host side:
With the exception of AIX with proprietary IBM hosts, the Dell PowerEdge R710 physical machines are used:
Memory: 11898Mb RAM
Processor: Intel Xeon CPU E5530 @ 2.40GHz
CPU: 2394.172 MHz
Cache Size: 8192 KB
with 2 physical sockets, 8 physical cores, 8 hyper-threading cores.
The remaining settings of the host, in conjunction with the test case:
OS: ESXi, RHEL, Windows Server, AIX
Number of cores: 4/8/16
Logical Units: 4/8/16
Logical Unit size: 5GB (Small volume drives for maximum IOPS)
Threads per LU: 64 for 4 LU, 32 for 8 LU, 8 for 16 LU, 4 for> 16LU
Storage side:
EMC XtremIO, 1 X-Brick configuration
EMC Symmetrix VMAX
EMC VNX
SAN:
Dedicated FC Switch, 8Gb Fiber Channel ports
Factory default settings in terms of number of FC adapters
Jamming configuration
Jamming test configuration is used to simulate bottlenecks in a SAN. Specifically, this illustration uses the Windows Server OS, although in fact it can be any. The system uses two hosts: one with the PowerPath preinstalled (then MPIO), and performance calculations are performed on it; the other is stressful. Each server is connected to a different SAN with storage. The red path to the data is marked, green is the free path.
PowerPath Adaptive Policy determines how busy the path is and allows you to redistribute the load on the free. This configuration allows you to create conditions that may well arise in a real laboratory at the customers (a specific path fails, an illiterate configuration, one common SAN to several servers, etc.). Conditions in which native multipathing will function at the speed of the slowest path, and the PowerPath must show a significantly higher IOPS.
The results are presented in the form of graphs, which are built using the Gnuplot program. It has its own command system, it can work in command line mode and execute scripts read from files. Gnuplot can both save graphics as various graphic file formats (command mode) and display them on the screen.
The figure shows the complete scheme for automated testing, from configuration to obtaining results to be further evaluated.
Test configuration
Let us dwell in more detail on the configuration of testing. An important parameter at the start of testing scenarios is the number of launches. Often, when testing PowerPath and NMP, the problem arises of deviation of the obtained performance value from the average value, expressed as a percentage. In this paper, it was decided to take for tolerance a value less than or equal to 5%. If the variance from the average for all starts exceeds the set bar, then we cannot assess the throughput, and such tests require further analysis and replay.
As an example, below is the result of a real DBSIM test. Gnuplot was used to build histograms, and a special script was generated at the input. All the construction of the resulting images was written in Perl. I cannot go into details of the implementation of this automation object due to commercial secrets.
The “y” axis represents the deviation of a particular launch from the average value in% (throughput). Focusing on the x axis, we can see which version of PowerPath or NMP (Native Multipathing), the built-in balancing tool) belong to these results. The graph clearly shows that in some tests there are launches with a deviation of more than 5%, and some approach this value. Such testing requires further research.
The deviation itself is primarily related to the physical and software implementation of a specific storage system. In addition, it can be caused by the presence of a large number of threads that control the sending and receiving of data from the disk. This phenomenon does not occur on all storage systems and is practically independent of the IO-generator. In addition to the number of launches, the following parameters affect the objectivity of the final results:
- Runtime (run time);
- Warm up time;
- Downtime (pause time).
In order to ensure the quality and relevance of the test results, a great deal of analytical work was done. In configurations in which there is a large scatter of the resulting data, tests were run with a long execution time, and the values of bandwidth were saved to the log at intervals of 10 seconds. With the help of a statistical analysis of the results obtained, it is possible to correctly select various time intervals and the number of launches for specific tests in a given configuration. These intervals can be summed up and get the time intervals of any duration. For such amounts, the relative standard deviation (RSD or relative standard deviation, also called the coefficient of variation) is calculated, which characterizes the homogeneity of the data, which is a valuable statistical characteristic. The magnitude of the coefficient of variation can be judged on the degree of variation of the characteristics of the population. The greater its value, the greater the spread relative to the average value, the less homogeneous the set in its composition and the less representative the average. The coefficient of variation (1) is the ratio of the standard deviation (2) to the arithmetic mean (4), expressed as a percentage. The standard deviation, in turn, can be found as the root of the variance (3). N is the number of independent tests.
In contrast to the deviation from the mean, which we paid attention to when constructing histograms, RSD makes it possible to most accurately represent the dispersion of a trait and its value relative to the values themselves (relative indicator, not absolute). Now we select the time interval for a specific test and we will consider it acceptable if the RSD value for all such intervals is less than or equal to 5%.
After the calculations and the redistribution of time intervals, we repeat the testing and build graphs using the same Perl script. The magnitude of the deviation from the average has noticeably decreased and the test results most accurately reflect the real picture of the software performance.
As a result
Let's summarize the work done:
- Such an implementation of the automation of performance testing of load balancing allows you to quickly obtain the final results of tests, which clearly reflect the current performance of the product with respect to the solutions supported by OS vendors.
- Product developers for specific platforms can quantify the degree of performance improvement / degradation relative to previous versions.
- For configurations where there is a variation in the final results, analytical work was carried out to ensure significantly more stable results.
For myself, I can conclude that a quick, transparent and unified conduct of automatic testing of the product being developed allows it to develop at a significantly faster rate. In particular, thanks to this approach, we were able to increase the performance of the EMC PowerPath on AIX by more than 30%.
Parting words for students
I want to advise you not to delay the start of a career in your specialty, because work experience in the professional sphere is valued above others. Upon graduation from the university, in addition to scientific publications, general knowledge and the average score, it is desirable to have experience related to the practice and “combat” use of knowledge. And then you will be highly appreciated as a specialist with relevant skills, able to participate in real projects and generate profits.
Source: https://habr.com/ru/post/254599/
All Articles