We facilitate the support of iOS applications. Part 1 - without looking up from Xcode
Good day. I would like to talk about how to facilitate the support of iOS applications.
Anyone who created an iOS application, and it came at least to open β-testing, most likely is familiar with the phrase: “I was playing with the application and that’s what happened ...”. And after this phrase, you could spend a few hours trying to understand how “this” turned out.
')
If you are familiar with this situation, or want to know how to save yourself from this in the future - I ask under the cat.
And so, we have created an application for ourselves or for the customer and the testing process is underway. Testers, as well as the customer, can be for 1000km from you. So, let's consider a few situations in which you are informed about a strange bug, and it is either difficult for you or not to reproduce it at all.
That is, either it is difficult to get to the problem (you need to get far into the application with very special conditions, but at least the weather outside the window should be -40, and your location should be at the equator), or you need to repeat the same action many times. In the latter case, the fact that you get into the breakpoint at each iteration is somehow annoying, but it is on this line of code that something should happen, we really need to stop on it when we are lucky enough to reproduce the bug.
Everyone who develops applications for iOS / MAC, necessarily set breakpoints and tried to understand what happens before the application crashes / behaves incorrectly. Unfortunately, developers often use a small part of the functionality that is available to them. I rummaged through Habr and found only one article about the full use of breakpoints. About debugging an application with lldb is generally deaf (well, or my search abilities prevented me from finding the right article).
And so, you were able to get the same launch that reproduces the incorrect behavior. And let's say it happens when the UIViewController just appeared, but bad luck, you don’t have an implemented method - [MyViewController viewDidAppear:] and you don’t have a UINavigationViewController delegate or anything similar in your code that would help put the breakpoint to the right moment. It is in this situation that Symbolic breakpoint will be useful to you.
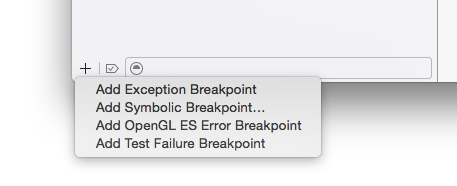
You just need to drive a character - [UIViewController viewDidAppear:]

and you stop at the right moment.
Another very useful application of Symbolic breakpoint is that you got a project from another developer and there is a description of the problem from the tester. And you understand how to get there in the application, but how to compare it with the code? The code base can be huge, and the animation hints at what is going on - [UINavigationController pushViewController: animated:] , but where this happens is not clear. Add Symbolic breakpoint : - [UINavigationController pushViewController: animated:] and we will stop on all calls to this method.
However, when using Symbolic breakpoint for system functions, you have neither self nor _cmd , nothing that is usually available. So you have to get to the controller outside, and lldb will help you.
The most popular is po (print object). It prints - [NSObject debugDescription] , unlike NSLog , which prints - [NSObject description] . It is worth bearing in mind that when you override the description for more convenient logging in the application, do not forget also the debugDescription .
Let's continue from where we left off: you have a console and you are in the right place of the application. But, at a minimum, you need to get a complete hierarchy of UIView and all the ivar's MyViewController would be nice ?
To find out the pointer to the UIWindow of our application, we need to type
We got a pointer to a UIWindow; let's now get a pointer to a rootViewController
And so, we have a pointer to our MyViewController . Suppose we need its integer _ivar , nobody created a property for it (there’s no need for us to getter and setter).
Typing
Displaying information about objects is only part of the functionality. Do you want the animation to become slower on the device, like in the simulator by pressing Toggle Slow Animations ? Here's an option for you how to do this without restarting the application.
Done - at the time of this launch you have slow animations and you can do it at exactly the right moment in time and precisely at this launch. And as you get tired, return the value 1 .
Maybe these examples are naive, but they make it clear the basic functionality. And yes, remember, I described an incredible alignment --40 && equator. Now, no one bothers you to change the values on the fly, before performing a critical piece of code, and everything will look as if you are at the equator and outside your -40 window.
For me, the parade hit is pviews and pvc . These commands will derive the UIView and UIViewController hierarchy. If you suddenly need to understand what the team is and how it works - type help <command name> .
In general, I recommend that you familiarize yourself with this tool, or at least deliver it, because when the problem persists and you still reproduce the problem, all that remains is to tear the hair on your head if you don’t have such an assistant at hand.
The delightful functions lldb and chisel do not end with the above. You can go deeper into them. But, on most small projects, this will be quite enough.
- We facilitate the support of iOS applications. Part 1 - without looking up from Xcode
- We facilitate the support of iOS applications. Part 2 - location and network
- We facilitate the support of iOS applications. Part 3 - Fall and Logs
Anyone who created an iOS application, and it came at least to open β-testing, most likely is familiar with the phrase: “I was playing with the application and that’s what happened ...”. And after this phrase, you could spend a few hours trying to understand how “this” turned out.
')
If you are familiar with this situation, or want to know how to save yourself from this in the future - I ask under the cat.
And so, we have created an application for ourselves or for the customer and the testing process is underway. Testers, as well as the customer, can be for 1000km from you. So, let's consider a few situations in which you are informed about a strange bug, and it is either difficult for you or not to reproduce it at all.
The hit parade is difficult to reproduce or difficult to debug.
That is, either it is difficult to get to the problem (you need to get far into the application with very special conditions, but at least the weather outside the window should be -40, and your location should be at the equator), or you need to repeat the same action many times. In the latter case, the fact that you get into the breakpoint at each iteration is somehow annoying, but it is on this line of code that something should happen, we really need to stop on it when we are lucky enough to reproduce the bug.
Everyone who develops applications for iOS / MAC, necessarily set breakpoints and tried to understand what happens before the application crashes / behaves incorrectly. Unfortunately, developers often use a small part of the functionality that is available to them. I rummaged through Habr and found only one article about the full use of breakpoints. About debugging an application with lldb is generally deaf (well, or my search abilities prevented me from finding the right article).
Breakpoints
Excellent article , but I did not see the description of Symbolic breakpoint there . So, I recommend reading the article, and I will tell you about Symbolic breakpoints .And so, you were able to get the same launch that reproduces the incorrect behavior. And let's say it happens when the UIViewController just appeared, but bad luck, you don’t have an implemented method - [MyViewController viewDidAppear:] and you don’t have a UINavigationViewController delegate or anything similar in your code that would help put the breakpoint to the right moment. It is in this situation that Symbolic breakpoint will be useful to you.
You just need to drive a character - [UIViewController viewDidAppear:]
and you stop at the right moment.
Another very useful application of Symbolic breakpoint is that you got a project from another developer and there is a description of the problem from the tester. And you understand how to get there in the application, but how to compare it with the code? The code base can be huge, and the animation hints at what is going on - [UINavigationController pushViewController: animated:] , but where this happens is not clear. Add Symbolic breakpoint : - [UINavigationController pushViewController: animated:] and we will stop on all calls to this method.
However, when using Symbolic breakpoint for system functions, you have neither self nor _cmd , nothing that is usually available. So you have to get to the controller outside, and lldb will help you.
Lldb
During the launch of the application, click on pause - see (lldb) ? This is a debug console. There are many useful commands that he can perform, and the very first one is help . Now you can see the rest of the useful commands.The most popular is po (print object). It prints - [NSObject debugDescription] , unlike NSLog , which prints - [NSObject description] . It is worth bearing in mind that when you override the description for more convenient logging in the application, do not forget also the debugDescription .
Let's continue from where we left off: you have a console and you are in the right place of the application. But, at a minimum, you need to get a complete hierarchy of UIView and all the ivar's MyViewController would be nice ?
To find out the pointer to the UIWindow of our application, we need to type
po [[[UIApplication sharedApplication] delegate] window] We got a pointer to a UIWindow; let's now get a pointer to a rootViewController
po [(UIWindow *)<pointer> rootViewController] Now we have a pointer to the main controller. With similar manipulations, we can reach the controller we need by going through the child’s or property’s.And so, we have a pointer to our MyViewController . Suppose we need its integer _ivar , nobody created a property for it (there’s no need for us to getter and setter).
Typing
po ((MyViewController *)<pointer>)->_ivar Now we have everything we need.Displaying information about objects is only part of the functionality. Do you want the animation to become slower on the device, like in the simulator by pressing Toggle Slow Animations ? Here's an option for you how to do this without restarting the application.
expr -- ((CALayer *)[[[[UIApplication sharedApplication] delegate] window] layer]).speed = 0.2 Done - at the time of this launch you have slow animations and you can do it at exactly the right moment in time and precisely at this launch. And as you get tired, return the value 1 .
Maybe these examples are naive, but they make it clear the basic functionality. And yes, remember, I described an incredible alignment -
chisel
There is one big minus in the previous description - a very long and expensive walk to the desired controller. But there is a project that will help you - chisel . This comrade knows a lot, a list of commands can be found here . If you do not understand how the view is, because it is transparent, you can highlight the border (for example, the mask command). You can, knowing the text on the button, find it (command pa11y). And if you prepare in advance and make the text accessibilityLabel match the text of the element, then you can search for anything. After installing chisel , the list of its commands will be added to the full list of what lldb can do .For me, the parade hit is pviews and pvc . These commands will derive the UIView and UIViewController hierarchy. If you suddenly need to understand what the team is and how it works - type help <command name> .
In general, I recommend that you familiarize yourself with this tool, or at least deliver it, because when the problem persists and you still reproduce the problem, all that remains is to tear the hair on your head if you don’t have such an assistant at hand.
The delightful functions lldb and chisel do not end with the above. You can go deeper into them. But, on most small projects, this will be quite enough.
Attach to Process
Suppose that we have a good start for debugging, we have put chisel , and now we can dial help at the right moment in lldb and, thanks to the embedded and add. to the teams, to understand what is wrong with us, right here and right here on this launch. We can do all this while our application is launched from Xcode on a device or simulator. And what to do if we caught a bug just in the process of using the application on the device? You can have time to go to Xcode and ask him to join the application. For this you need Xcode → Debug → Attach to Process. It is possible by the name of the application, but my Xcode itself guesses the target.Conclusion
Today we have considered the case when you have an application, β-testing is underway, there is an incredible description or an incomprehensible result, and no ideas how this happened. Hope you now have a referral to start an investigation.Source: https://habr.com/ru/post/254563/
All Articles