AggreGate Network Manager: platform + box for umbrella monitoring of IT infrastructure

Diagnosing reliability and performance problems in complex IT infrastructures requires an understanding of the holistic view of all processes and events, as well as the ability to track critical trends. The need to introduce a single (“umbrella”) IT infrastructure management system is justified by classical reasons for business:
')
- Maximizing return on investment in business applications and services . The management system allows you to assess and optimize the resources necessary for the operation of the company's IT services. This ensures minimal operating costs and accelerates the payback of new IT services.
- Improving the quality of IT services . Maintaining and improving the quality of IT services requires a detailed understanding of their current state. Often, the performance degradation remains unnoticed for a long time by the company's own services, damaging the reputation and trust of customers. Automated monitoring provides the necessary reporting on the compliance of services to their service level agreements (SLA) defined for them, reducing the risk of undetected degradation to a minimum.
- Reduced downtime for IT services and components . Proactive monitoring allows you to prevent many failures of equipment and applications, as well as minimize the duration and degree of degradation of services. In cases where failures do occur, the continuous monitoring system allows for faster localization and correction of problematic components. Financial losses caused by several hours of unavailability of business services are not always adequately evaluated and are often comparable to the costs of implementing an IT management system.
- Improving the efficiency of employees of the IT infrastructure operation department . Eliminating IT administrators from routine day-to-day duties, such as analyzing the current situation and managing configurations, as well as from urgent tasks to eliminate incidents, the management system allows employees to use the released time for one-time tasks to further automate processes, which ultimately leads to business performance in general.
What was written above is understood (intuitively or consciously) by almost all CIOs, heads of IT infrastructure operation departments and system administrators. However, the degree of "maturity" of the IT infrastructure is very different from country to country, from industry to industry, from company to company. And the approach to automating the management and monitoring of IT is very much dependent on the degree of development of the IT infrastructure as a whole.
We conditionally single out several levels of development of the approach to IT infrastructure management:
- Life without monitoring . All infrastructure components and services operate on their own, without operational control. The elimination of incidents is done by connecting to the individual components of infrastructure and services, building a picture of what happened happens “in the head” of admins, debriefing - usually according to logs.
- Reactive monitoring . Of course, from the word "reaction", and not "reactivity". At this stage the classical monitoring system of the initial class is being introduced. This can be either the simplest pinging machine, or a system that periodically polls infrastructure components using standard protocols (SNMP, WMI, etc.) or with the help of agents. The collected data is saved and visualized using dashboards. Also, the simplest event consolidation (SNMP traps, Syslog) and sending alerts on critical events and threshold violations are performed.
- Proactive monitoring . It differs from the reactive by the ability to predict incidents and avoid them in cases where the development of the incident is not fast and the monitoring system has the ability to warn operators of a negative trend. Systems with proactive monitoring capabilities usually also provide additional features, such as, for example, dynamic alarm thresholds, traffic analysis, VoIP monitoring through SIP calls and IP SLA data collection, etc.
- Integrated IT management . While at this stage in Russia there is a small number of large companies. As part of the integrated, or, in other words, “umbrella” IT management, one system combines all the functions of monitoring infrastructure and services with the functions of automated configuration management, while providing a single point of integration with the corporate system of the ITSM / Service Desk class. Systems of this class implement scenarios of complex correlation of chains of events and their enrichment with data from the asset inventory system. As a result, it is possible to train the system in the methods of finding the root cause of failure (root cause analysis). A set of ready-made root cause search algorithms is usually part of the boxed product.
The number of IT monitoring systems and networks in the world market is quite large. However, most of them are highly specialized products, such as traffic monitoring and decomposition solutions or Java application monitoring solutions.
If we talk about universal complex systems, the circle is sharply narrowed. All more or less well-known solutions, both free and commercial, are mentioned in the article "Comparison of network monitoring systems" on Wikipedia ( Russian version , English version ).
All universal IT monitoring solutions can also be conditionally divided into several categories that have their pros and cons:
- Free open source systems . This class includes, for example, Nagios, Cacti, Zenoss, Zabbix, Pandora FMS and OpenNMS. Freeness of the system itself is not always lower total cost of ownership - setting up through configuration files and the need to write scripts for many monitoring scenarios ultimately is expensive. The costs of administrators are indirect and are distributed over a long period of time, so they often remain unnoticeable for the company. At the same time, systems of this class have some advantage in flexibility over low-cost commercial systems, since open source allows experienced network engineers to solve most of the problems of classical monitoring by adding a system and without signing a contract for paid technical support.
- Commercial products with fixed functionality . This segment includes most commercial network monitoring solutions, including WhatsUp Gold, OpManager, Solarwinds, PRTG, AccelOps, AdRem NetCrunch, op5 Monitor, and SevOne. Such commercial systems are usually very quickly deployed and well solve typical tasks out of the box. Most products have good usability, again as part of the implementation of standard monitoring scenarios. The main disadvantage of all such systems is low flexibility and weak ability to adapt to non-standard tasks. Often, even if the most complete version of a product is purchased, the answer to the question “how to set up monitoring X on Y and to see Z?” Can be a firm “no way” with the prospect of long communication with the vendor in the hope of implementing the necessary feature in future versions of the product.
- Commercial product line platform type . The players in this segment are the largest Western companies - IBM, CA, HP, EMC. In this case, a solution is not one specific product, but a set of products covering various groups of monitoring and management tasks. Unfortunately, these products were often developed by third-party companies that were subsequently absorbed, so the products that are integrated at the level of a single management console are arranged inside, configured and operate in completely different ways. The cost of introducing such a set of products is quite high. Nevertheless, systems of this type cover the maximum number of monitoring tasks out of the box and allow solving a wide range of non-standard tasks.
In general, the IT management systems market is one of the most highly competitive among all software markets. So why did we decide to invest in the development of AggreGate Network Manager - another system of this class?
The answer to this question is not entirely trivial. We have the AggreGate platform - our designer for building monitoring and control systems. Many of our solutions for vertical markets, such as AggreGate SCADA / HMI and AggreGate Fleet Manager , are built by refining several new drivers for data collection and packaging a new solution into a beautiful marketing candy wrapper. Unlike SCADA, the network monitoring system requires both a lot of new data collection mechanisms (WMI, IMPI, SSH, JMX, SIP, NetFlow, Syslog, etc.), as well as a huge number of pre-configured polling patterns, alarms and dashboards. Accordingly, investments initially promised to be considerable.

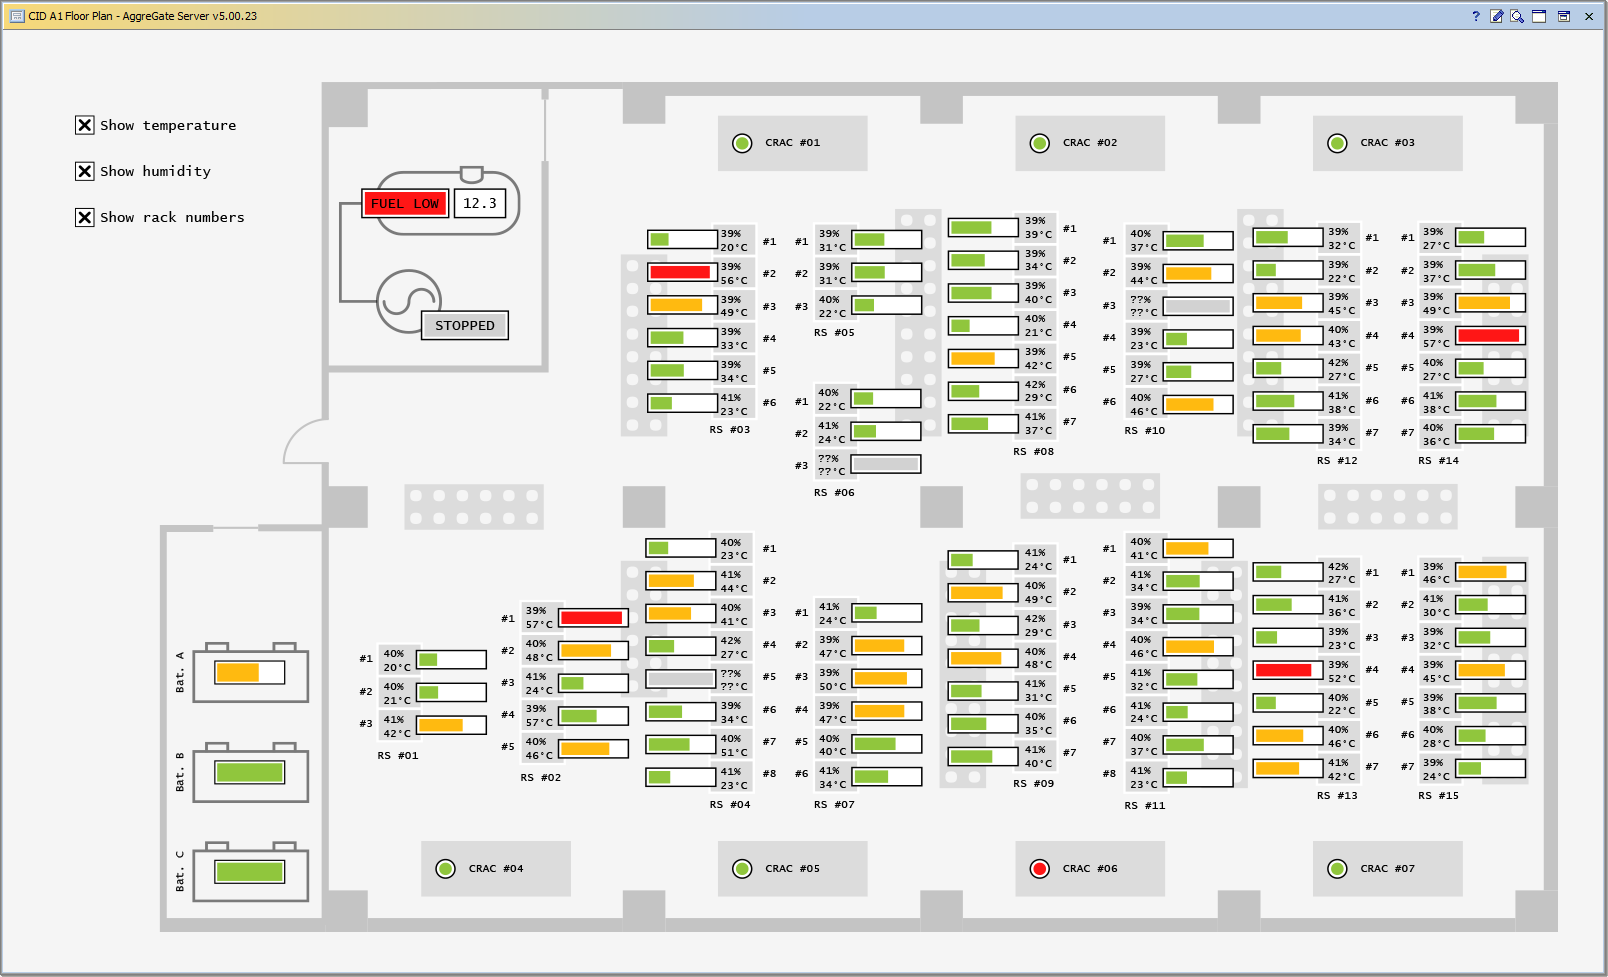
We built this product because we see an opportunity to change the world of IT monitoring and management systems. The flexibility of the basic platform allows you to simulate the behavior and visually develop the interface of the monitoring system for your IT infrastructure. These capabilities go far beyond adding new graphs to the dashboards and setting the alarm threshold — this is about business process modeling and automated KPI calculation, creating dynamic plans for corporate data centers, and visual design from scratch of your own operator interface the first line for the video wall in the NCC, and much more.
Specialists working in the field of automation of production processes have become accustomed to the fact that each production is considered a priori unique and the engineering company begins the implementation of an automated process control system with the design and development of specific control algorithms and mnemonic schemes.
All large infrastructures are no less unique than production processes. So why are all IT infrastructures managed “one size fits all”, and most control systems provide very limited possibilities for their customization? The AggreGate Network Manager system , based on the AggreGate platform, gives IT professionals the ability to build a unique infrastructure management process, comparable to the capabilities of an automation engineer using a good process control system.
At the same time, we are well aware that the wide market perceives the product only if it works well out of the box. The system should be deployed within 10 minutes, the same amount goes to scanning the network, then standard toolbars should immediately be available.
Like most universal systems in this market, Network Manager covers managing two main types of IT infrastructures:
- 1. Infrastructure telecommunications companies . Management processes include detection and visualization of the network topology (L2 / L3, MPLS, SDH), monitoring of traffic and interface conditions, monitoring of communication channels via WAN, management of equipment configurations, etc.
- 2. Infrastructures of small / medium companies and corporations . In this case, the most relevant monitoring servers, operating systems and applications. It is also important to monitor the DBMS, virtualized environment and business services.
The presence of an AggreGate SCADA platform based on products allowed us to combine the capabilities of Network Manager and SCADA / HMI products, which are technically sets of modules connected to the core of the platform. The combined product, called AggreGate Data Center Supervisor, covers the monitoring of the third and last type of modern IT infrastructures:
- 3. Data Center Infrastructure . Data center management involves comprehensive monitoring of IT, engineering infrastructure and physical security infrastructure. It is necessary to ensure deep monitoring of the microclimate, control of heating, air conditioning and ventilation systems, monitoring of the UPS and diesel generator sets, close integration with the ACS and the video surveillance / analytics system, as well as an inventory of IT assets.
From the point of view of the standard functionality of monitoring systems, AggreGate Network Manager provides within the framework of a single product all the classic functions:
- Detection of network devices and services, including scheduled
- Data collection and events for dozens of protocols (SNMP, WMI, DHCP, DNS, FTP, SSH, Telnet, ICMP, IMAP, JMS, JMX, LDAP, NetFlow / xFlow, SQL / JDBC / ODBC, POP3, Radius, SIP, SMB / CIFS, SMTP, SOAP, Syslog, CORBA and others)
- Construction of topological, geographical and static maps of the network
- Availability of hundreds of “boxed” dashboards, reports and alarms for analyzing network and application performance, searching and localizing failures
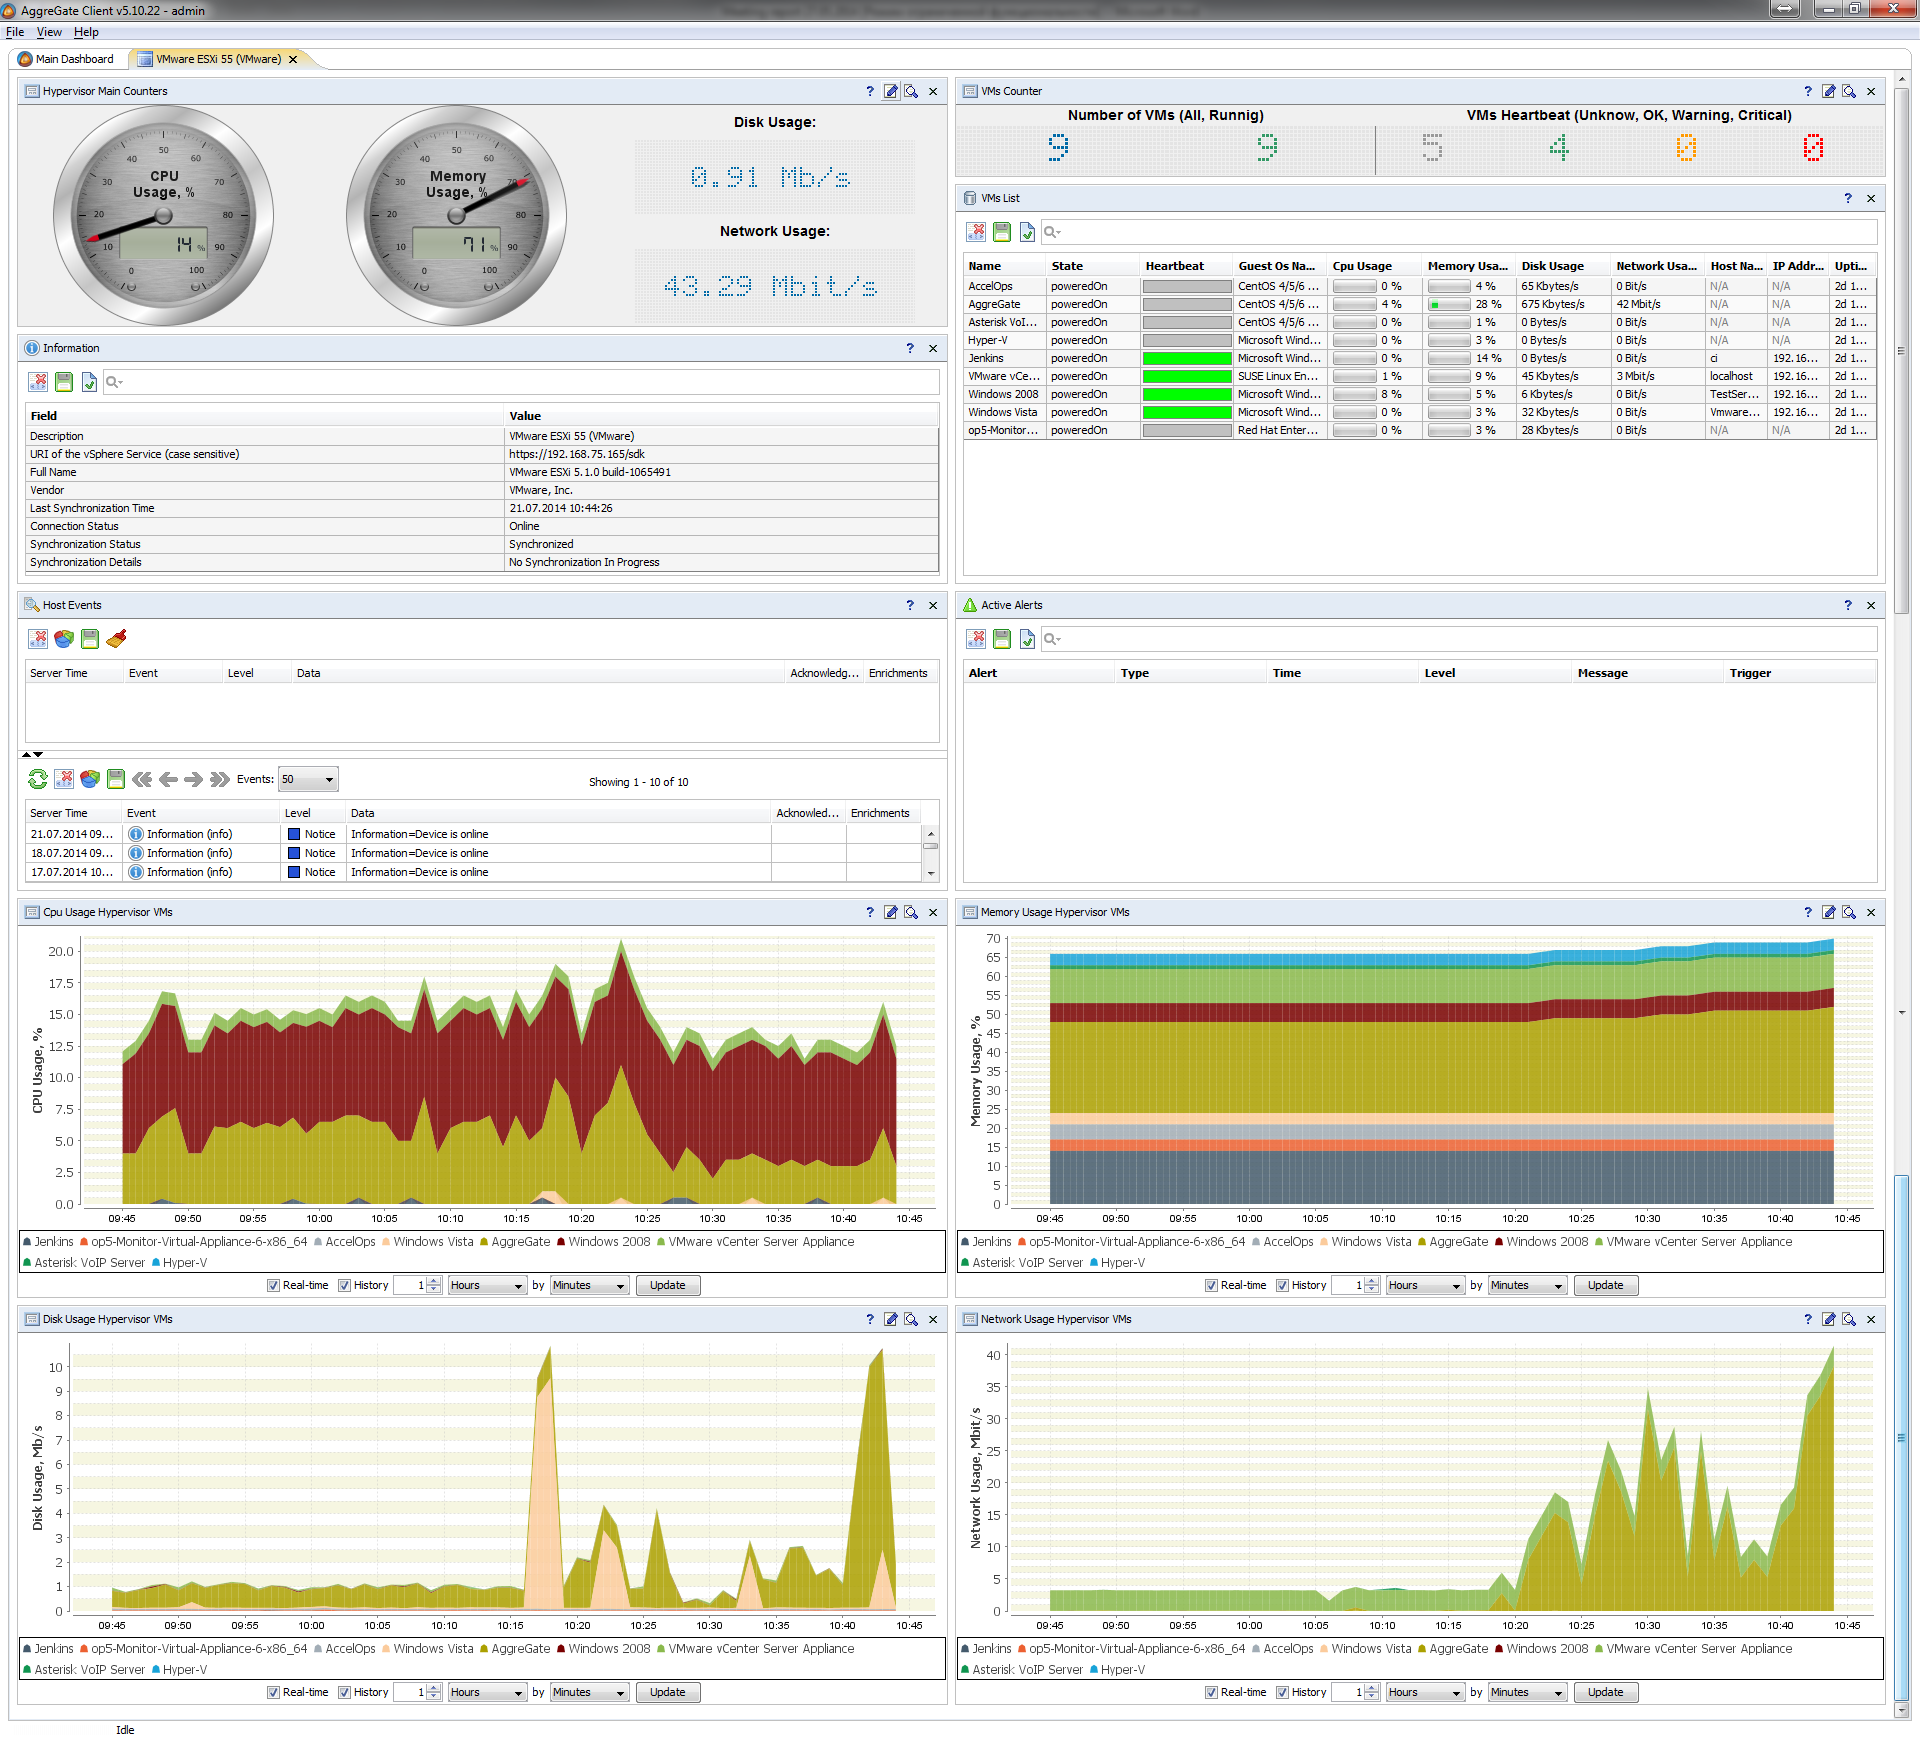
- Monitoring virtual infrastructure, VoIP and wireless networks
- NetFlow / xFlow based traffic decomposition
- Multi-user role-based access to the server, the ability to authenticate via LDAP
- Distributed monitoring with the ability to store historical data on remote secondary monitoring servers
- Inventory of network assets - software, PC components, peripherals, switch modules and routers, etc.
- Consolidation, filtering, deduplication, correlation, and other processing of network messages
- Create alarms with hysteresis, dynamic thresholds, beat detection, escalation, manual closure, e-mail and SMS alerts, as well as automatic and interactive corrective actions
- Creating ticket alerts in the ITSM / Service Desk system
- Backing up and restoring equipment configurations, checking their compliance with corporate policies
However, the above list is covered by all serious IT management solutions. The only question is the quality of its implementation, the ability to configure and adapt, the usability of the product, the cost of ownership, availability and quality of technical support.
Platform for non-standard IT infrastructure management solutions
In terms of capabilities for configuring Network Manager is very different from all other products. The product is fully developed using standard AggreGate data processing and visualization tools. Simply put, the entire IT management system, not counting the data collection modules, was developed by our system and business analysts, as well as the implementation staff. The result of their work is hundreds of report templates, widgets, alarms, each of which can be opened in the system editors and modified "by itself".
This feature concerns not only the simplest setting, such as changing the alarm threshold, but also virtually any changes in product behavior. Let's look at one example: monitoring CPU usage statistics.
The Top 10 toolbar has a table showing 10 devices with maximum CPU usage. The toolbar item settings refer to a request that is available to the administrator as a separate object in the object tree. The request text is:
SELECT info.info$description AS device, info.cpuLoad$cpuLoad AS processor_utilization_percentage FROM users.*.devices.*:cpuLoad:info:genericProperties AS info WHERE (info.cpuLoad$cpuLoad IS NOT NULL) AND (info.genericProperties$suspend = 0) ORDER BY processor_utilization_percentage DESC LIMIT 10 This query retrieves the values of the cpuLoad variable for all devices (corresponding to the users. *. Devices. * ) Mask from a single data model of the AggreGate platform, and thus builds a pivot table by CPU load, sorted in descending order and limited to the first 10 lines. You can easily change the query text, for example, so that it shows only devices of a certain type or from a specific group.
Where does the cpuLoad variable come from ? Maybe it is calculated by the monitoring system core based on SNMP data?
And no. Another resource fully created in visual editors is the CPU Load Model. It is configured in such a way that an individual copy of the model is attached to each network device. This instance adds to the device the very variable cpuLoad referenced by the report. In addition, the model has a set of business rules that allow calculating the CPU load depending on the data available in the device’s snapshot:
- If the device supports HOST-RESOURCES-MIB (Windows, Linux, etc.), the average current load value for all CPU cores is taken.
- If WMI is enabled on the device, the Win32_PerfFormattedData_PerfOS_Processor WMI data is used
- For Cisco, use the calculated average of the device for the last 5 minutes
- For Solaris, add the values of user and system CPU load
- A little more complicated, HP / UX systems provide, instead of a calculated CPU load value, a millisecond counter in which the processor has been busy since power up. For intermediate analysis, another object of the AggreGate platform is used, called the statistical channel. It converts the millisecond counter data into a rate of change and stores statistics in a ring database (RRD). The rule for calculating CPU utilization for HP / UX in turn refers to the average CPU utilization calculated by the channel for the last minute.
- And so on, the delivery of the product includes the rules for calculating the load for many common devices.

If you add a new rule with the help of the rule editor, for example for Huawei, then all the alarms, reports and dashboards on processor utilization included in the standard product will become automatically compatible with Huawei equipment, since they also refer to the CPU Load model.
All other modules of the monitoring system are also created according to the principle of using standard platform components instead of hard-coding logic into the core of the product. For example, to launch a network scan according to a schedule, a custom (and even deleted) task of the system scheduler is used.
The dashboards that implement the setup screens and the main operator screen of the Network Manager product are designed to hide from ordinary users all the difficulties associated with setting up the system and allow them to effectively solve everyday tasks.
The purpose of this article is to describe the ideology of our system, “overboard” even a very superficial listing of the product’s capabilities remains. We do not think that Habr is suitable for this site. Therefore, in subsequent articles we will pay attention to interesting projects in which we had the opportunity to participate, as well as detailed descriptions of how to solve various non-standard tasks.
Special Offer for Habrazhiteli
We will make a free Network Manager Premium license for 25 devices to any person who applies with reference to the HABR. It will allow monitoring a couple of dozen corporate servers, databases, hypervisors, or, for example, NetFlow sources. There are no conditions for obtaining a license, we hope for feedback - both positive and critical.
Source: https://habr.com/ru/post/254387/
All Articles