Tibbo AggreGate Concept - Platform for the Internet of Things
The development of the Internet is rapidly reaching a level when it is "just there." We increasingly do not have to think about how we are now connected to the network, who our communication operator is, and, moreover, how the connection is organized technically. The widespread penetration of wireless networks and the gradual spread of IPv6 allows thousands of simple devices and sensors to continuously communicate with each other and send their data to the cloud. The rapid complication of infrastructure has led to the replacement of the term “Machine-to-machine” (Machine-to-Machine, M2M) with the more current term “Internet of things” (Internet of things, IoT).
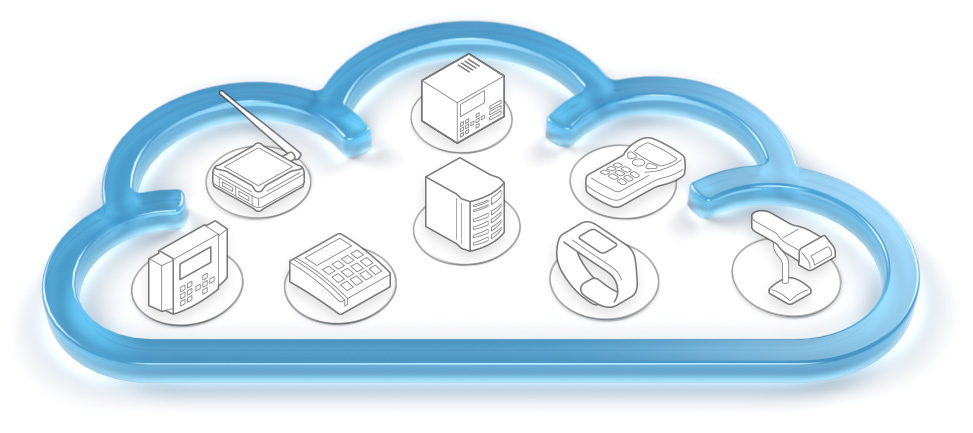
Forming something like distributed intelligence, the Internet of Things devices nevertheless need centralized management, a system or service to configure, store and interpret the collected data. Being the central “brain” of the infrastructure of the cloud of devices, the control system also fills up the machine knowledge bases of the connected devices and updates their software.
')
Operators study data aggregated by groups of devices and time periods, visualizing them in various sections. The same data is transmitted for a more detailed analysis to various systems of the Business Intelligence class. It is curious that even if we are talking about personal devices (for example, fitness trackers), few cloud service operators deny the possibility of an anonymous analysis of statistics on the use and use of the collected data to further improve the devices and services.
The development of devices for the Internet of Things is constantly simplified and becomes cheaper, allowing small companies to enter this market. Aware of the need to create a control system, many companies underestimate the complexity of its development, do not take into account the need to use industrial server technologies (such as clustering for fault tolerance or multi-server distributed architecture). Often the development begins on its own, “in house”. The success of the IoT devices released on the market leads to a rapid increase in the number of users, creating unresolved problems with scaling the service and ensuring its performance.
Fearing further problems and not being able to quickly create a server software development department, IoT operators often outsource the development of the central system, concentrating on the devices themselves. But even this does not solve the problem - third-party developers just start building a system from scratch and do not have enough resources and time to implement serious technologies on its basis.
Our platform AggreGate was born in 2002. In those years, we were actively engaged in the production of Serial-over-IP converters, and we needed a kind of central server transferring data between converters hidden behind firewalls or NAT and not having the ability to communicate directly. The first version of the product was called LinkServer, it was written in C ++ and is only available as a service. LinkServer simply pumped data flows through itself without any processing.
A little later, our converters turned into free-programmable controllers. They began to “understand” the data passing through them and a logical desire arose to teach the central server the same thing. At about the same time, we realized that 90 percent of the work to create a system for monitoring and controlling devices for any industry is a “bicycle invention”, and only a small amount of effort is spent on tasks unique to a particular business.
In 2004, the system was ported to Java from that moment on, developed as a “device management framework”. For several years we were moving almost blindly, not fully understanding what exactly we want to receive as a result. To great happiness, we managed to avoid mono customers, not to go "headlong" into some specific industry and preserve the universality of the system.
Now the platform is used in various areas, such as remote monitoring and maintenance, IT infrastructure management and network monitoring, SCADA and technological process automation, physical access control, building automation, vehicle fleet management, trading and payment machines management, sensor network monitoring, counting visitors and cars, centralized event and incident management, advertising and dashboard management and mobile device management.
Figuratively speaking, AggreGate is a Lego designer for quickly creating interfaces to a cloud of devices. Allowing IoT solutions architects to concentrate more on equipment and “business logic”, it solves infrastructure problems:
Being universal, the platform helps to combine various monitoring and control systems. This avoids unnecessary integration points and reduces the number of integration scenarios. For example, the integrated monitoring system has a single point of integration with the Service Desk / ITSM / Maintenance Management system for the delivery of incidents (alarms), as well as unified integration with the Inventory / Asset Management system to obtain information about the physical assets available and the extent of their impact on business services. .
The organization of role-based access allows in such cases to provide different departments with individual scenarios for the use of the system and the uniqueness of the operator interface.
The main components of the platform are:
The server manages the reading of data from devices and the recording of changes, this process is called two-way synchronization . On the server side, a so-called device snapshot is created containing copies of the latest values of device metrics and changes made by operators and system modules and not recorded in the device due to the lack of communication. Configuration changes are delivered to devices on a first-time basis, allowing group device configuration changes to be made without waiting for them to appear online at the same time.
The server also provides reception and maintenance of incoming connections of devices that do not have static "white" IP addresses. This feature is important for the IoT platform.
Data and device events become part of a single data model . Within this model, each device is represented by a so-called context , which is part of the hierarchical structure of contexts. Each context includes formalized data elements of three types: variables (properties, settings, attributes), functions (methods, operations), and events (notifications). The context also contains metadata describing all available elements. Thus, all the data and metadata of the context are fully concentrated within him. This technology is called device normalization . The normalized presentation of various types of devices is created by device drivers and agents.
You can draw parallels with object-oriented programming, where objects also provide properties, methods, and events. Properties are internal device variables, methods are operations that it can perform, and events are a device's way of notifying the server of changes in internal data or the external environment.
Virtually every device can be described by a set of properties, methods and events. For example, a remotely controlled water tank may have a “water level” property, as well as “open the valve” and “close the valve” methods to control the flow of fluid. An intelligent reservoir can also generate alerts, such as “almost empty”, “almost full”, and “overflow”. We have developed over a hundred drivers of communication protocols in Java and the idea of normalization has proven its worth. Moreover, many modern "universal" protocols (such as OPC UA, JMX or WMI) use very similar data models.
All server contexts are located in a hierarchical structure called the context tree. Although contexts correspond to different objects (devices, users, reports, alarms, etc.), they all have a common interface and can interact within the context tree of the server, providing a high level of flexibility. The same principle allows different servers to interact with each other within a distributed installation.
Each connected device allows operators to perform direct configuration (reading and editing the device configuration), direct control (manual forcing the device to perform various operations) and direct monitoring (viewing incoming events from the device in the log in pseudo-real time mode).
Events and changes to device metrics are stored in server storage. Depending on the task of the system, this may be a storage of various types. For example, in the case of a micro-server running inside Raspberry Pi, the simplest file storage is used, and the central server of a large distributed installation can use a cluster of Apache Cassandra NoSQL databases, ensuring that tens of thousands of events per second are saved from a thinned original stream of several hundred thousand events per second.
However, in most cases, the usual relational database is used as storage. Using the ORM-layer (Hibernate) ensures compatibility with MySQL, Oracle, Microsoft SQL Server, PostgreSQL and other DBMS.
The data and events received from devices affect the life cycle of “active” server objects, allowing it to respond to changes in the external environment. Active objects include:
Active objects can add new types of variables, functions and events to a single data model, ensure that changes to user variables and events are sent to the repository, as well as invoke operations of devices and other objects in an automated mode.
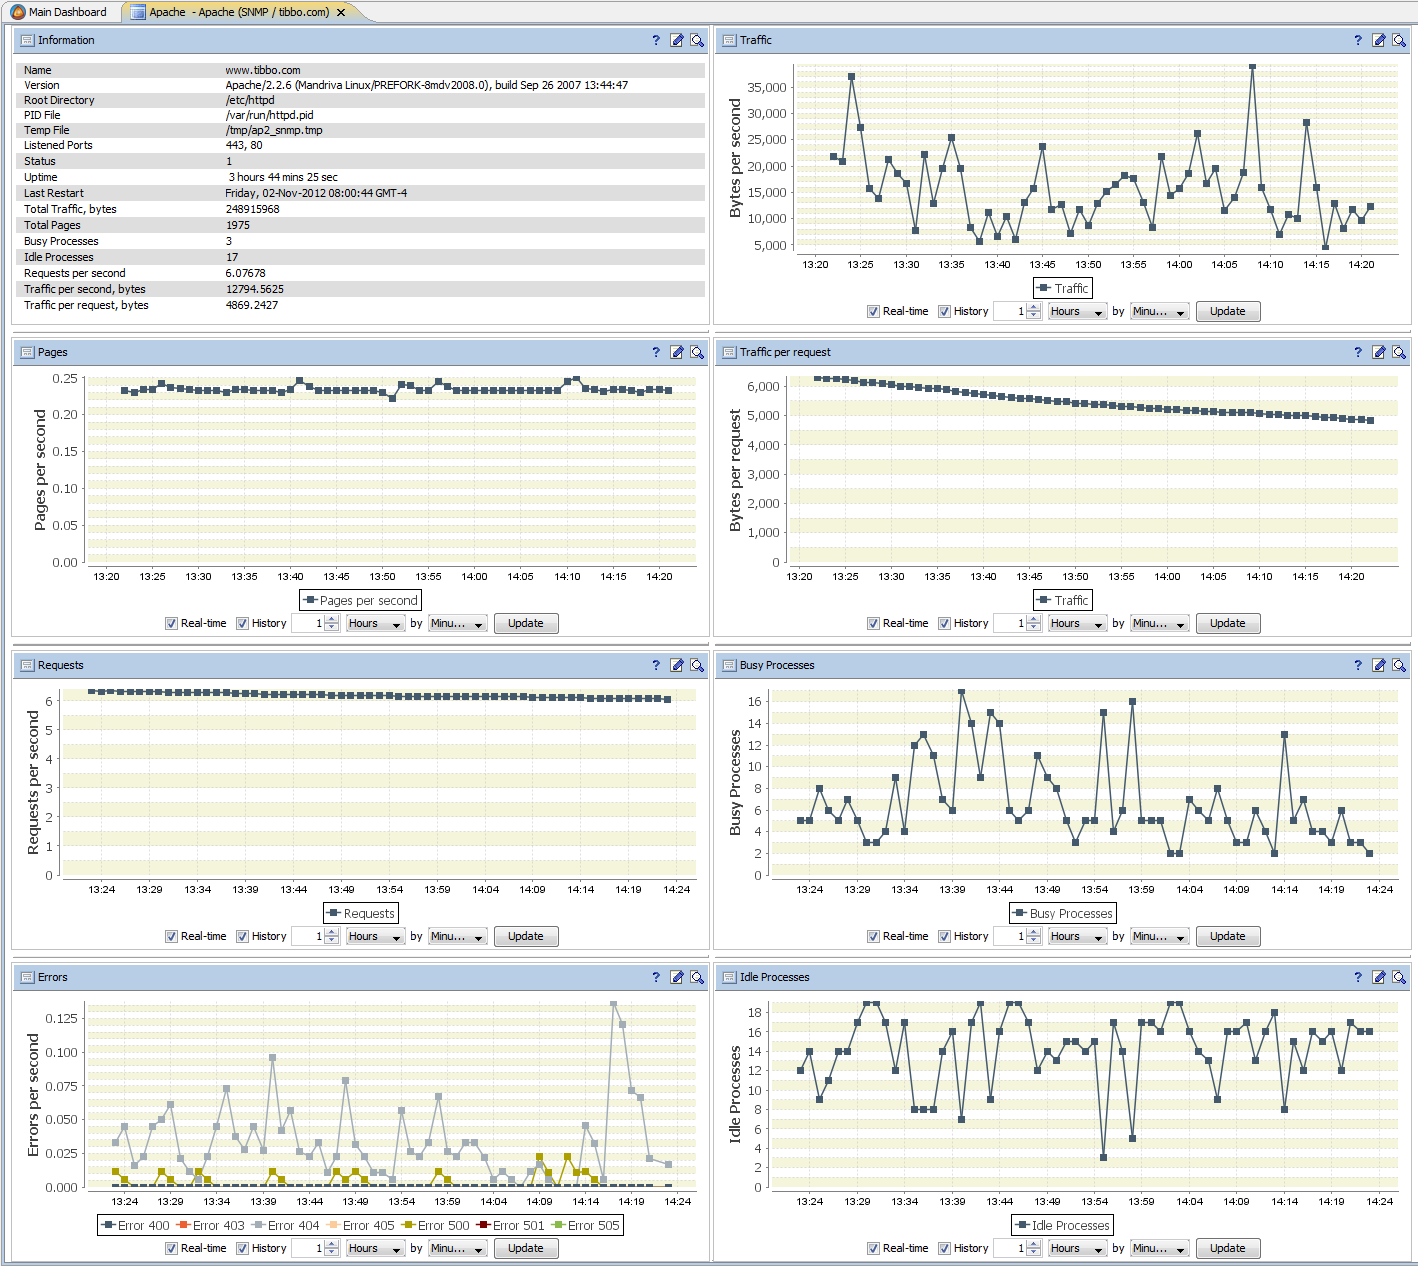
There are widgets for creating data entry forms, tables, dynamic maps, graphs and mnemonic diagrams. They can be combined into dashboards, both global, showing the state of the entire infrastructure and based on aggregated KPIs, and “object”, showing the status of a single device or infrastructure component.
Widgets and report templates are edited in specialized visual editors, which are part of the platform and are closely integrated into its ecosystem. The widget editor allows you to build complex interfaces consisting of a variety of nested container panels with visual components located in them. In addition to the absolute positioning typical for editors used in SCADA systems, you can use a grid layout familiar to anyone who has come across editing tables within HTML pages. The grid layout allows you to create data entry forms and tables that can be accurately scaled to fit any screen size.
As a result, the first or second line operator interface, developed visually using data visualization tools, consists of dashboards with widgets, forms, tables, charts, reports, mnemonic diagrams and navigation between them.
The interface editor allows you to use dozens of ready-made components, such as labels, text fields, buttons, checkboxes, sliders and spinners, lists, date / time selectors, scales, and pointers. There are more complex components, such as trees, video windows, dynamic vector SVG images, geographical maps based on Google Maps / Bing / Yandex / OpenStreetMap. The list of supported chart types includes both classic graph types, as well as various statistical graphs, Gantt charts, and graphs in polar coordinates.
All widgets drawn in the editor work in the web version of the interface, including browsers without Java support, i.e. on mobile devices. Only HTML5 and JavaScript support is required.
The properties of server objects (devices, models, alarms) and user interface components are connected to each other using bindings that determine when and where to get the data, how to process it, and where to put the result. When processing data, bindings use an expression language and query language.
A binding that uses an expression is similar to a formula in Microsoft Excel. The formula takes data from several cells, applies mathematical operations or various data processing functions to them, and puts the result in the current cell. The expression is also a formula that describes where you need to get the data and what transformations you need to apply to it.
Query language is very similar to plain SQL. It also allows you to combine data from different tables into one, applying filtering, sorting, grouping, etc. to them. The difference between the built-in query language and classic SQL is that instead of ordinary tables, data sources are virtual tables that are formed on the fly from various data of a single model. Any query also automatically takes into account the access rights of the operator performing it or the system object, which favorably distinguishes it from a direct SQL query to the server database.
To solve the most complex data processing tasks, you can write a script in Java or even a separate plugin. However, each script written by one of the partners for data processing is an alarming bell for us - why do we need a platform, if we still need classical development, and even outside the usual environment (such as Eclipse or Idea)?
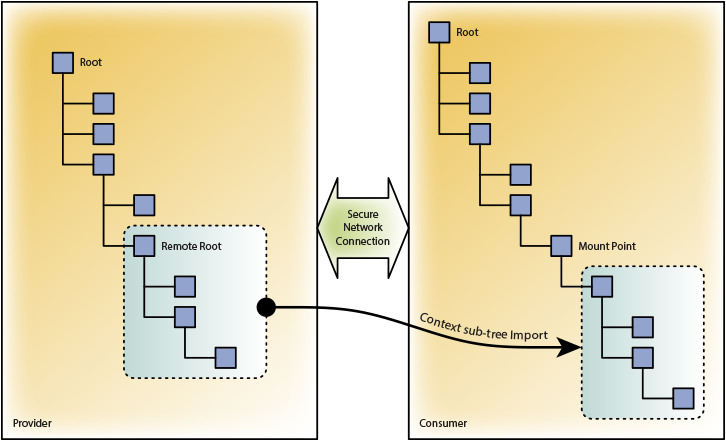
Separately, I want to tell you about the technical device of a distributed architecture. Within the framework of this concept, peer-to-peer relationships between servers are configured in such a way that one server (“supplier”) attaches part of its single data model to another server (“consumer”). This allows the consumer server objects to interact with the provider server objects along with their own. The number of connections of one server is not limited, and it can simultaneously act as a supplier and a consumer in relation to its neighbors.
Distributed architecture allows to solve many problems of large systems:
This post is our debut in Habré. In the next articles, we plan to talk more about the internal structure of the platform, our own solutions based on it, as well as our understanding of how “heavy PC software” will sneak inside embedded systems and IoT devices.
PS If you are developing a server software for the Internet of Things, please answer the question below.
Forming something like distributed intelligence, the Internet of Things devices nevertheless need centralized management, a system or service to configure, store and interpret the collected data. Being the central “brain” of the infrastructure of the cloud of devices, the control system also fills up the machine knowledge bases of the connected devices and updates their software.
')
Operators study data aggregated by groups of devices and time periods, visualizing them in various sections. The same data is transmitted for a more detailed analysis to various systems of the Business Intelligence class. It is curious that even if we are talking about personal devices (for example, fitness trackers), few cloud service operators deny the possibility of an anonymous analysis of statistics on the use and use of the collected data to further improve the devices and services.
The development of devices for the Internet of Things is constantly simplified and becomes cheaper, allowing small companies to enter this market. Aware of the need to create a control system, many companies underestimate the complexity of its development, do not take into account the need to use industrial server technologies (such as clustering for fault tolerance or multi-server distributed architecture). Often the development begins on its own, “in house”. The success of the IoT devices released on the market leads to a rapid increase in the number of users, creating unresolved problems with scaling the service and ensuring its performance.
Fearing further problems and not being able to quickly create a server software development department, IoT operators often outsource the development of the central system, concentrating on the devices themselves. But even this does not solve the problem - third-party developers just start building a system from scratch and do not have enough resources and time to implement serious technologies on its basis.
Our platform AggreGate was born in 2002. In those years, we were actively engaged in the production of Serial-over-IP converters, and we needed a kind of central server transferring data between converters hidden behind firewalls or NAT and not having the ability to communicate directly. The first version of the product was called LinkServer, it was written in C ++ and is only available as a service. LinkServer simply pumped data flows through itself without any processing.
A little later, our converters turned into free-programmable controllers. They began to “understand” the data passing through them and a logical desire arose to teach the central server the same thing. At about the same time, we realized that 90 percent of the work to create a system for monitoring and controlling devices for any industry is a “bicycle invention”, and only a small amount of effort is spent on tasks unique to a particular business.
In 2004, the system was ported to Java from that moment on, developed as a “device management framework”. For several years we were moving almost blindly, not fully understanding what exactly we want to receive as a result. To great happiness, we managed to avoid mono customers, not to go "headlong" into some specific industry and preserve the universality of the system.
Now the platform is used in various areas, such as remote monitoring and maintenance, IT infrastructure management and network monitoring, SCADA and technological process automation, physical access control, building automation, vehicle fleet management, trading and payment machines management, sensor network monitoring, counting visitors and cars, centralized event and incident management, advertising and dashboard management and mobile device management.
The main tasks of the platform
Figuratively speaking, AggreGate is a Lego designer for quickly creating interfaces to a cloud of devices. Allowing IoT solutions architects to concentrate more on equipment and “business logic”, it solves infrastructure problems:
- Maintenance of communication between servers and devices in the case of work through unreliable cellular and satellite communication channels
- Unification of work with these devices, regardless of their physical meaning
- Storage of large volumes of collected events and historical data in a database of various types (relational, ring, NoSQL)
- Visual construction of complex chains of source data analysis and event correlation
- Modeling the process of combining data from multiple devices and calculating the KPI of the entire infrastructure
- Fast construction of interfaces for operators and system engineers from ready-made "cubes", without programming
- Implementing integration scenarios using ready-made universal connectors (SQL, HTTP / HTTPS, SOAP, CORBA, SNMP, etc.)
System integration
Being universal, the platform helps to combine various monitoring and control systems. This avoids unnecessary integration points and reduces the number of integration scenarios. For example, the integrated monitoring system has a single point of integration with the Service Desk / ITSM / Maintenance Management system for the delivery of incidents (alarms), as well as unified integration with the Inventory / Asset Management system to obtain information about the physical assets available and the extent of their impact on business services. .
The organization of role-based access allows in such cases to provide different departments with individual scenarios for the use of the system and the uniqueness of the operator interface.
Platform architecture
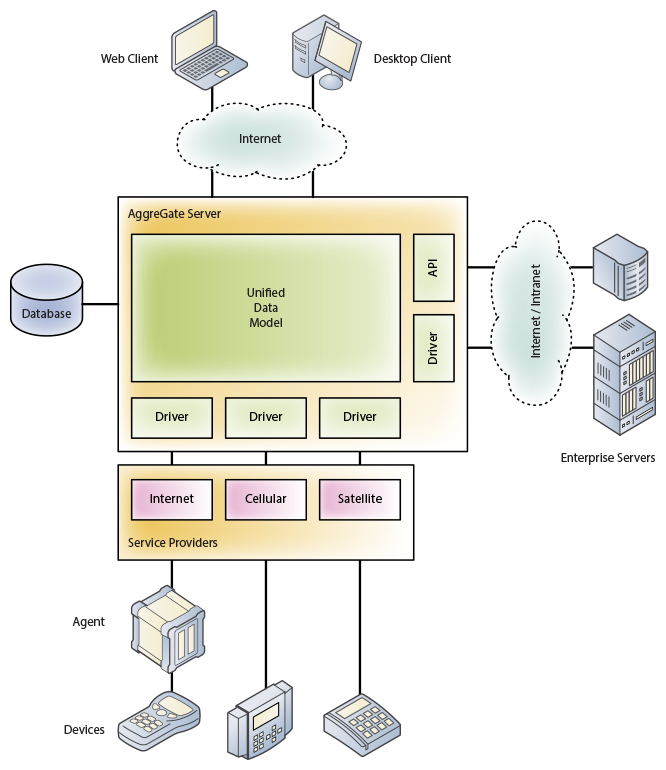
The main components of the platform are:
- Server is a Java application that provides communication with devices, data storage and their automated processing. Servers can cluster together to provide high availability and maintain peering relationships with each other in distributed installations. AggreGate Server manages an embedded web server providing support for web interfaces.
- Single console - cross-platform desktop client software that provides simultaneous work with one or more servers in the administrator, system engineer or operator mode.
- Agent - a library that can be embedded in the device's IoT firmware in order to provide communication with servers, unify device settings, perform operations with it, and send events asynchronously. There are many library implementations (Java, .NET, C / C ++, Android Java, etc.) Agent deployment is not required if communication with the server is carried out using a standard or proprietary protocol, in the latter case a separate device driver is developed for the server. The agent can also be designed as a separate hardware device (gateway).
- Open source API to extend the functionality of all other components and implement complex integration scenarios
The server manages the reading of data from devices and the recording of changes, this process is called two-way synchronization . On the server side, a so-called device snapshot is created containing copies of the latest values of device metrics and changes made by operators and system modules and not recorded in the device due to the lack of communication. Configuration changes are delivered to devices on a first-time basis, allowing group device configuration changes to be made without waiting for them to appear online at the same time.
The server also provides reception and maintenance of incoming connections of devices that do not have static "white" IP addresses. This feature is important for the IoT platform.
Data and device events become part of a single data model . Within this model, each device is represented by a so-called context , which is part of the hierarchical structure of contexts. Each context includes formalized data elements of three types: variables (properties, settings, attributes), functions (methods, operations), and events (notifications). The context also contains metadata describing all available elements. Thus, all the data and metadata of the context are fully concentrated within him. This technology is called device normalization . The normalized presentation of various types of devices is created by device drivers and agents.
You can draw parallels with object-oriented programming, where objects also provide properties, methods, and events. Properties are internal device variables, methods are operations that it can perform, and events are a device's way of notifying the server of changes in internal data or the external environment.
Virtually every device can be described by a set of properties, methods and events. For example, a remotely controlled water tank may have a “water level” property, as well as “open the valve” and “close the valve” methods to control the flow of fluid. An intelligent reservoir can also generate alerts, such as “almost empty”, “almost full”, and “overflow”. We have developed over a hundred drivers of communication protocols in Java and the idea of normalization has proven its worth. Moreover, many modern "universal" protocols (such as OPC UA, JMX or WMI) use very similar data models.
All server contexts are located in a hierarchical structure called the context tree. Although contexts correspond to different objects (devices, users, reports, alarms, etc.), they all have a common interface and can interact within the context tree of the server, providing a high level of flexibility. The same principle allows different servers to interact with each other within a distributed installation.
Each connected device allows operators to perform direct configuration (reading and editing the device configuration), direct control (manual forcing the device to perform various operations) and direct monitoring (viewing incoming events from the device in the log in pseudo-real time mode).
Events and changes to device metrics are stored in server storage. Depending on the task of the system, this may be a storage of various types. For example, in the case of a micro-server running inside Raspberry Pi, the simplest file storage is used, and the central server of a large distributed installation can use a cluster of Apache Cassandra NoSQL databases, ensuring that tens of thousands of events per second are saved from a thinned original stream of several hundred thousand events per second.
However, in most cases, the usual relational database is used as storage. Using the ORM-layer (Hibernate) ensures compatibility with MySQL, Oracle, Microsoft SQL Server, PostgreSQL and other DBMS.
The data and events received from devices affect the life cycle of “active” server objects, allowing it to respond to changes in the external environment. Active objects include:
- Alarms that convert a specific complex state of an object or a certain chain of events into a new type of event - Incident
- Models that use business rules to convert source events and values into user-defined event types and values
- Scheduler that guarantees the execution of scheduled tasks and their execution even in the case of a temporary server shutdown
- Sensors and some other types of objects
Active objects can add new types of variables, functions and events to a single data model, ensure that changes to user variables and events are sent to the repository, as well as invoke operations of devices and other objects in an automated mode.
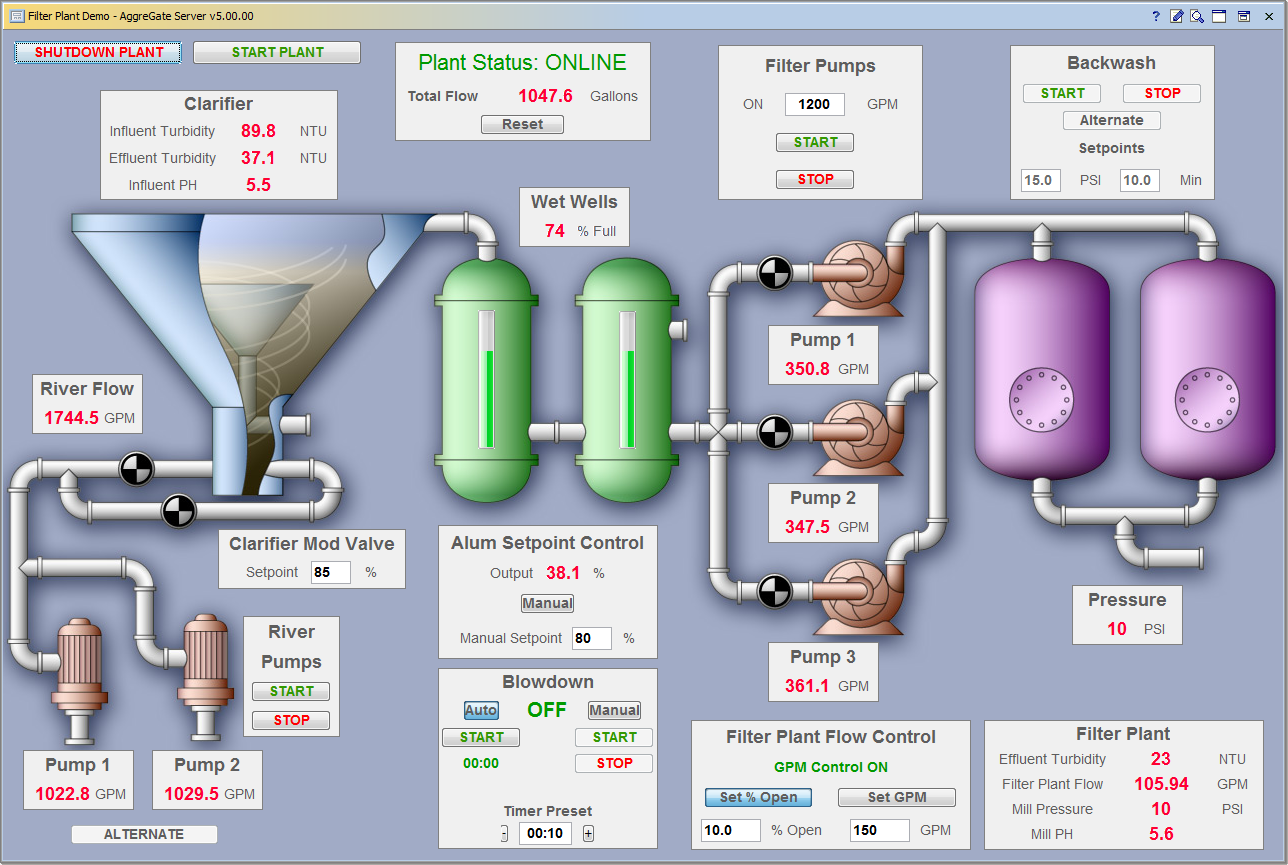
There are widgets for creating data entry forms, tables, dynamic maps, graphs and mnemonic diagrams. They can be combined into dashboards, both global, showing the state of the entire infrastructure and based on aggregated KPIs, and “object”, showing the status of a single device or infrastructure component.
Widgets and report templates are edited in specialized visual editors, which are part of the platform and are closely integrated into its ecosystem. The widget editor allows you to build complex interfaces consisting of a variety of nested container panels with visual components located in them. In addition to the absolute positioning typical for editors used in SCADA systems, you can use a grid layout familiar to anyone who has come across editing tables within HTML pages. The grid layout allows you to create data entry forms and tables that can be accurately scaled to fit any screen size.
As a result, the first or second line operator interface, developed visually using data visualization tools, consists of dashboards with widgets, forms, tables, charts, reports, mnemonic diagrams and navigation between them.
The interface editor allows you to use dozens of ready-made components, such as labels, text fields, buttons, checkboxes, sliders and spinners, lists, date / time selectors, scales, and pointers. There are more complex components, such as trees, video windows, dynamic vector SVG images, geographical maps based on Google Maps / Bing / Yandex / OpenStreetMap. The list of supported chart types includes both classic graph types, as well as various statistical graphs, Gantt charts, and graphs in polar coordinates.
All widgets drawn in the editor work in the web version of the interface, including browsers without Java support, i.e. on mobile devices. Only HTML5 and JavaScript support is required.
The properties of server objects (devices, models, alarms) and user interface components are connected to each other using bindings that determine when and where to get the data, how to process it, and where to put the result. When processing data, bindings use an expression language and query language.
A binding that uses an expression is similar to a formula in Microsoft Excel. The formula takes data from several cells, applies mathematical operations or various data processing functions to them, and puts the result in the current cell. The expression is also a formula that describes where you need to get the data and what transformations you need to apply to it.
Query language is very similar to plain SQL. It also allows you to combine data from different tables into one, applying filtering, sorting, grouping, etc. to them. The difference between the built-in query language and classic SQL is that instead of ordinary tables, data sources are virtual tables that are formed on the fly from various data of a single model. Any query also automatically takes into account the access rights of the operator performing it or the system object, which favorably distinguishes it from a direct SQL query to the server database.
To solve the most complex data processing tasks, you can write a script in Java or even a separate plugin. However, each script written by one of the partners for data processing is an alarming bell for us - why do we need a platform, if we still need classical development, and even outside the usual environment (such as Eclipse or Idea)?
Separately, I want to tell you about the technical device of a distributed architecture. Within the framework of this concept, peer-to-peer relationships between servers are configured in such a way that one server (“supplier”) attaches part of its single data model to another server (“consumer”). This allows the consumer server objects to interact with the provider server objects along with their own. The number of connections of one server is not limited, and it can simultaneously act as a supplier and a consumer in relation to its neighbors.
Distributed architecture allows to solve many problems of large systems:
- Horizontal scaling system
- Distributed monitoring with the installation of local monitoring servers and intermediate data storage at remote sites
- Vertical scaling, distribution of functions between servers at several logical levels
This post is our debut in Habré. In the next articles, we plan to talk more about the internal structure of the platform, our own solutions based on it, as well as our understanding of how “heavy PC software” will sneak inside embedded systems and IoT devices.
PS If you are developing a server software for the Internet of Things, please answer the question below.
Source: https://habr.com/ru/post/254065/
All Articles