Homemade Fourier Spectrometer
 Once I read an article about Fourier spectrometer on Wikipedia, and I wanted to make one myself. This task is not at all simple, but the operating model of the spectrometer is still possible to do. I'll warn you right away that this is not an infrared spectrometer, so they will not take any particularly interesting measurements.
About how the Fourier spectrometer works, and how it can be done at home - then (carefully, a lot of pictures!).
Some theory
Just in case - we will talk about the spectrometers of the optical range.
I will try not to go very deeply into the theory of the work of spectrometers, although this topic is very extensive.
The most common types of spectrometers are spectrometers with a dispersing element that is able to distribute radiation with different wavelengths in space. Examples of such elements are diffraction gratings and prisms.
Simplified diagram of a spectrometer with a translucent diffraction grating:

In the diagram: 1 — entrance slit, 2 — collimating lens, 3 — diffraction grating, 4 — focusing lens, 5 — image plane (photodetector plane).
')
The radiation under study passes through the entrance slit and is converted by the lens 2 into a parallel beam of light that falls on the diffraction grating. The grating produces a spatial separation of this beam — radiation with different wavelengths begins to propagate at different angles. The focusing lens 5 forms from parallel beams an image in the plane 5, which can be registered by a photodetector (for example, a CCD-ruler).
These types of spectrometers are relatively simple, but they have their drawbacks.
One of the parameters affecting the spectral resolution of the spectrometer is the width of the slit - the smaller it is, the better the resolution. However, as the size of the slit decreases, the illumination of the photodetector decreases, which makes it difficult to obtain spectra. Since the light is distributed along the image plane, the illumination of the image decreases.
Prisms, though easy to manufacture and use, are not capable of providing high spectral resolution. Another disadvantage is that they can work only in a certain wavelength range, determined by the material of the prism. Conventional glass is not able to pass radiation with a length of more than 3-4 microns free.
Diffraction gratings are more difficult to manufacture, but provide much better spectral resolution. Reflecting diffraction gratings can be used in a wide range of wavelengths - from ultraviolet radiation to far infrared. One of the drawbacks of diffraction gratings is that they give several different orders of the spectrum that can distort the interferogram. To eliminate them, one has to use light filters that limit the emission spectrum at the input or output of the spectrometer.
To register the spectrum in the image plane of the spectrometer, multi-element photodetectors are installed, which make it possible to read the entire emission spectrum very quickly. The most common silicon CCD and CMOS rulers are suitable only for the visible spectrum and near-infrared radiation. To study radiation with a length of more than 1.2 microns, we need receivers from other materials, such as germanium, gallium-indium arsenide, or even a line of microbolometers. Such multi-element receivers produce only a few companies in the world, they are very expensive and difficult to access.
To register the spectra, you can use cheaper single-element photodetectors (photodiodes, bolometers), but in this case the image must be scanned mechanically - by moving one of the spectrometer nodes. This significantly increases the time of receipt of the spectrogram and can reduce the accuracy of measurement of the absolute values of wavelengths.
In Fourier spectrometers, a completely different principle of operation is used — it is based on the phenomenon of interference .
In Wikipedia, as it seemed to me, the most simple and clear description is given:
The main element of the Fourier spectrometer is the Michelson interferometer .
Suppose we have a coherent radiation source with a specific wavelength. When the path difference between the two rays that arrived at the receiver is λ / 2 (that is, the rays came out of phase), the light intensity recorded by the receiver is close to zero. When moving the right mirror of the Michelson interferometer, the path difference of the rays changes, the light intensity recorded by the receiver also changes. It is obvious that the intensity of light is maximum when the difference in the course of the rays will be a multiple of the wavelength.
When moving the mirror at a constant speed, an sinusoidal electrical signal will be observed at the output of the receiver. Moreover, the period of the sinusoid depends on the wavelength of the source, and the amplitude on the intensity of the source.
Now imagine that the input is incoherent source. Each wavelength in the spectrum of the light source will give its sinusoid at the output of the receiver. Thus, at the receiver output, we get a complex signal. When performing the inverse Fourier transform on the received signal, we obtain the spectrum of the input electrical signal, which is also the emission spectrum of the source (that is, the intensity of the source radiation at different wavelengths).
The radiation interference pattern in the Fourier spectrometer:

In the diagram: 1 — radiation source, 2 — beam-splitting (semitransparent) plate, 3 — fixed mirror, 4 — moving mirror, 5 — photodetector.
The scheme of a real spectrometer is somewhat more complicated:

In the diagram: 1 — radiation source, 2.4 — koltimming optics, 3 — entrance diaphragm, 5 — fixed mirror, 6 — movable mirror, 7 — mirror drive, 8 — beam-splitting plate, 9 — reference channel laser, 10 — reference photodetector channel, 11 - focusing optics, 12 - photodetector signal.
In order to stabilize the speed of movement of the movable mirror, and to provide a “linking” of the spectrometer to the absolute values of wavelengths, a reference channel consisting of a laser and its photodetector (9 and 12 in the diagram) is introduced into the spectrometer. The laser in this case acts as a reference wavelength. In high-quality spectrometers, single-frequency gas lasers are used for these purposes. As a result, the accuracy of measuring wavelengths is very high.
Fourier spectrometers have other advantages as compared with classical spectrometers.
An important feature of Fourier spectrometers is when using even one photodetector, all spectral elements are simultaneously recorded, which gives an energy gain compared to single-element mechanical scanning (the Falgett gain).
Fourier spectrometers do not require the use of optical slits, which detain most of the luminous flux, which gives a big gain in luminosity (Jacquinot win).
In Fourier spectrometers there is no problem of superposition of spectra, as in spectrometers with diffraction gratings, due to which the spectral range of the investigated radiation can be very wide, and is determined by the parameters of the photodetector and the beam-splitting plate.
The resolution of Fourier spectrometers can be much higher than with traditional spectrometers. It is determined by the path difference of the movable mirror Δ. The allowed wave interval is defined by the expression: δλ = λ ^ 2 / Δ
However, there is an important drawback - the large mechanical and optical complexity of the spectrometer. In order for interference to occur, both mirrors of the interferometer must be very precisely perpendicular to each other. In this case, one of the mirrors must perform longitudinal vibrations, but the perpendicularity should be maintained with the same accuracy. In high-quality spectrometers in some cases to compensate for the tilt of the movable mirror in the process of movement with the help of piezoelectric actuators tilt the fixed mirror. To obtain information on the current slope, the parameters of the reference beam from the laser are measured.
Practice
I was absolutely not sure that a Fourier spectrometer can be made at home without having access to the necessary machines (as I already mentioned, mechanics are the most difficult part of the spectrometer). Therefore, the spectrometer was made in stages.
One of the most important parts of the spectrometer is the fixed mirror assembly. It will need to be adjusted (smoothly moved) during the assembly process. It was necessary to provide the ability to tilt the mirror along two axes, and precisely move it in the longitudinal direction (why not), while the mirror should not bend.
The basis of the fixed mirror assembly was a single-axis table with a micrometric screw. I already had these nodes, it was necessary only to connect them together. For a backlash-free connection, I used a simple clamping of the table to the micrometric screw with a spring inside the base of the table.
Longitudinal movement is provided, then it is up to the mirror mount, which can ensure its smooth tilt.
I made it using three adjustment screws removed from a broken theodolite. A metal plate with a glued mirror is pressed with springs to the ends of these screws, and the screws themselves are fixed in a metal corner screwed to
little table.
The design is clear from the photos:

The adjustment screws of the mirror and the micrometer screw are visible.

In front you can see the mirror itself. It is taken from the scanner. An important feature of the mirror is that the mirror coating must be in front of the mirror, and in order for the interference lines not to be curved, the surface of the mirror must be fairly good.
View from above:

One can see the springs pressing the table in the micrometer screw and the mounting of the plate with a mirror to the corner.
As can be seen from the photographs, the fixed mirror assembly is attached to a chipboard board. The wooden base of the interferometer is clearly not the best solution, but it was problematic to make it from metal at home.
Now you can check the ability to get interference at home - that is, to assemble the interferometer. One mirror is already there, so you need to add a second test mirror and a beam splitter. I had a beam-splitting cube, and I used it, although the cube in the interferometer works worse than the beam-splitting plate - its faces give additional reflections of light. It turned out this design:

On one of the faces of the cube, not facing the mirror, you need to send light, and through the other you can observe the interference.
After assembling, the mirrors are located not too perpendicularly, and therefore it is necessary to perform a primary adjustment. I made it using a low-power laser diode connected to a collimating lens of sufficiently large diameter. A very small current must be applied to the laser - such that you can look directly at the crystal. The result is a point source of light.
The laser is installed in front of the interferometer, and its reflections in the mirrors are observed through the cube. For convenience of observation, I put a prism to the cube, directing the radiation coming out of the cube upwards. Now, turning the adjustment screws of the mirror, you need to combine the two visible reflections of the laser into one.
Unfortunately, I don’t have photos of this process, and it doesn’t look very clear - because of the glare in the cube, there are a lot of luminous points. Everything becomes much clearer when you start turning adjustment screws - some of the points begin to move, and some remain in place.
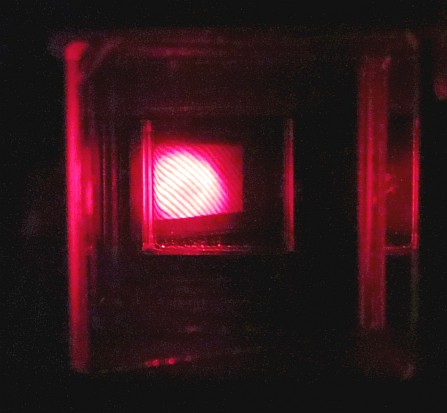
After the mirrors are exposed in the manner described above, it is enough to increase the laser power - and here it is, the interference! It looks almost the same as in the photo at the beginning of the article. However, it is dangerous to observe the laser radiation with your eyes, so in order to see the interference, you need to install a screen after the cube. I used a simple piece of paper through which the interference fringes are visible - there is enough laser power and coherence to create a sufficiently contrast image. By turning the adjustment screws of the mirror, it is possible to change the width of the strips - it is obvious that it is problematic to observe too narrow strips. The better the interferometer is adjusted, the wider the band. However, as I already mentioned, the slightest deviations of the mirrors lead to misalignment, and therefore the lines become too narrow and indistinguishable. The sensitivity of the resulting interferometer to deformations and vibrations is enormous - just press the base plate anywhere, and the lines begin to move. Even steps in the room lead to jitter lines.
However, the interference of coherent laser light is still not what is needed for the operation of a Fourier spectrometer. Such a spectrometer should work with any light source, including white. The coherence length of white light is about 1 micron.
In LEDs, this value may be more - a few tens of micrometers. The interferometer only forms the interference pattern when the path difference of the light rays for between each of the mirrors and the beam splitter is less than the coherence length of the radiation. In a laser, even a semiconductor, it is large - more than a few millimeters, so interference occurs immediately after the adjustment of the mirrors. But even the interference from the LED is much more difficult to obtain - by moving the mirror in the longitudinal direction with a micrometer screw, you need to ensure that the path difference of the rays falls into the desired micron range.
However, as I have already said, when moving, especially large enough (hundreds of microns), due to the insufficiently high-quality mechanics of the table, the mirror may turn slightly, which causes the conditions for observing interference to disappear. Therefore, it is often necessary to reinstall the laser instead of the LED and adjust the adjustment of the mirror with screws.
In the end, after half an hour of attempts, when it already seemed that it was not at all realistic, I managed to get the interference of light from the LED.
As it turned out a little later, instead of observing interference through a piece of paper at the exit of the cube, it is better to install a matte film in front of the cube - this is how an extended light source is obtained. As a result, the interference can be observed directly with the eyes, which noticeably simplifies the observation.
It turned out like this (you can see the reflection of the cube in the prism):

Then it was possible to get and the interference in the white light from the LED lamp (in the photo you can see the matte film - it faces the camera and you can see a dim spot of light from the lamp on it):

If you touch any of the mirrors, the lines begin to move and dim until they disappear completely. The period of the lines depends on the wavelength of the radiation, as shown in the synthesized image found on the Internet:

Now, when the interferometer is made, it is necessary to make a node of the moving mirror instead of the test one. Initially, I planned to simply glue a small mirror to the speaker, and applying current to it, change the position of the mirror. It turned out this design:

After the installation, which required a new alignment of the fixed mirror, it turned out that the mirror swings too much on the speaker cone and warps it a little when current is supplied through the speaker. However, by changing the current through the speaker, it was possible to smoothly move the mirror.
Therefore, I decided to make the construction more solid, using a mechanism that is used in some spectrometers - a spring parallelogram. The design is clear from the photo:

The resulting knot turned out to be much stronger than the previous one, although the rigidity of the metal spring plates came out somewhat high.
Further several nodes were added to the spectrometer:

On the left - hardboard, with aperture-diaphragm. Protects the spectrometer from external illumination.
A collimating lens is glued to the metal frame between the hole and the beam-splitting cube:

On the frame you can see a special plastic holder into which you can insert a matte film (lying in the lower right corner).
The lens is installed for the photodetector. A small mirror on a swivel mount is installed between the lens and the cube. It replaces the prism that was used previously. The photo at the beginning of the article was taken precisely through it. When the mirror is rotated to the observation position, it overlaps the lens, and the registration of the spectrogram becomes impossible. At the same time, it is necessary to stop sending a signal to the speaker of the moving mirror - due to too rapid oscillations of the line with the eye are not visible.
Below in the center one more single-axis table is visible. Initially, a photo sensor was attached to it, but the table did not give any particular advantages, and later I took it off.
Front mounted focusing lens from the camera:

To simplify alignment and testing of the spectrometer, I installed a red photodiode near the diaphragm.

The diode is mounted on a special rotating holder, so that it can be used as a source of test radiation for the spectrometer, the flow of light from the lens is blocked at the same time. The LED is controlled by a switch installed under the holder.
 Now it is worth a little more to tell about the photo sensors. It was originally planned to use only one ordinary silicon photodiode. However, the first attempts to make a high-quality amplifier for a photodiode turned out to be a failure, so I decided to use the OPT101 photosensor, which already contains an amplifier with a conversion factor of 1,000,000 (1 μA -> 1V).
This sensor worked quite well, especially after I removed the above table, and accurately set the sensor in height.
However, a silicon photodiode is capable of receiving radiation only in the wavelength range of 400-1100 nm.
The absorption lines of various substances usually lie further, and another diode is needed to detect them.
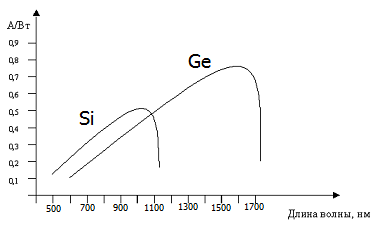
There are several types of photodiodes for operation in the near IR region. Germanium photodiodes that can receive radiation in the range of 600 - 1700 nm are most suitable for a simple homemade device. These diodes were produced under the USSR, so they are relatively cheap and affordable.
Photodiode sensitivity:
I managed to get photodiodes FD-3A, and FD-9E111. I used the second one in the spectrometer - it has a little more sensitivity. For this photodiode, I had to assemble an amplifier. It is made using an operational amplifier TL072. In order for the amplifier to work, it was necessary to provide it with a voltage of negative polarity. To get this voltage, I used a ready-made DC-DC converter with galvanic isolation.
Photo of the photodiode with amplifier:

Both photodiodes should focus the flow of light from the interferometer. In order to separate the flow of light from the lens, it would be possible to use a beam-splitting plate, however this would lead to a weakening of the signals from the diodes. Therefore, after the lens was installed another turning mirror, with which you can direct the light to the desired diode. The result was such a node of photo sensors:

In the center of the photo is the lens, on top of it is fixed the laser of the reference channel. The laser is the same as in the range finder taken from a DVD drive. The laser begins to form high-quality coherent radiation only at a certain current. The radiation power is quite high. Therefore, in order to limit the power of the beam, I had to close the laser lens with a light filter. The sensor is mounted on the right on the OPT101, at the bottom - a germanium photodiode with an amplifier.
In the reference channel for receiving laser radiation, a photodiode FD-263 is used, the signal from which is amplified by an LM358 operational amplifier. In this channel, the signal level is very high, so the gain is 2.
It turned out this design:

In the lower left corner of the spectrometer there is a photodiode of the reference channel, its amplifier and a switch for choosing the used photodiode. At the top left you can see a USB audio card connected to the speaker of a movable mirror. The same sound card is designed to capture the signal from the photodiodes of the main and reference channels.

Under the holder of the test LED there is a small prism, which directs the laser beam towards the photodiode of the reference channel.

Spectrometer scheme:

An example of an oscillogram obtained from a spectrometer (the source of radiation is a white LED):

The yellow line is the signal supplied to the speaker of the moving mirror, the blue line is the signal from OPT101, the red line is the result of the Fourier transform performed by the oscilloscope.
Software part
Without software processing, the Fourier spectrometer is impossible - it is on the computer that the inverse Fourier transform is used, which converts the interferogram received from the spectrometer to the spectrum of the original signal.
In my case, the special difficulty is created by the fact that I control the mirror with a sinusoidal signal. Because of this, the mirror also moves in a sinusoidal law, and this means that its speed is constantly changing. It turns out that the signal from the output of the interferometer is modulated in frequency. Thus, the program must also correct the frequency of the signal being processed.
The whole program is written in C #. Work with sound is made using the NAudio library.The program not only processes the signal from the spectrometer, but also generates a sinusoidal signal with a frequency of 20 Hz to control the moving mirror. Higher frequencies are worse transmitted by the mechanics of the moving mirror.
The signal processing process can be divided into several stages, and the signal processing results in the program can be viewed on separate tabs.
First, the program receives an array of data from the audio card. This array contains data from the main and reference channels: At the top, the reference signal, at the bottom, the signal from one of the photodiodes at the output of the interferometer. In this case, a green LED is used as a signal source.

The processing of the reference signal was quite difficult. We have to look for local minima and signal maxima (marked with colored dots on the graph), calculate the speed of the mirror (orange curve), look for minimum speed points (marked with black dots). For these points, the symmetry of the reference signal is important, so that they do not always exactly coincide with the real minimum speed.
One of the found speed minima is taken as the reference point of the interferogram (marked with a red vertical line). Next, one period of oscillation of the mirror stands out:

The number of periods of oscillations of the reference signal in one pass of the mirror (between the two black dots in the screenshot above) is indicated on the right: “REF PERIODS: 68”. As I already mentioned, the obtained interferogram is modulated in frequency, and it needs to be corrected. For correction, I used data on the current period of the signal oscillations in the reference channel. Correction is performed by interpolating the signal using the cubic spline method. The result is visible below (only half of the interferogram is displayed): The interferogram is obtained, now you can perform the inverse Fourier transform. It is produced using the FFTW library. The result of the conversion:


As a result of this conversion, the spectrum of the original signal is obtained in the frequency domain. In the screenshot, it is converted to inverse centimeters (CM ^ -1), which are often used in spectroscopy. But I am still more accustomed to the scale in wavelengths, so the spectrum has to be recalculated: It can be seen that the resolution of the spectrometer decreases with increasing wavelength. The shape of the spectrum can be slightly improved by adding zeros to the end of the interferogram, which is equivalent to performing an interpolation after performing the conversion.

Examples of spectra obtained
Laser emission: On the left - the rated current is applied to the laser, on the right - a much smaller current. As can be seen, as the current decreases, the coherence of the laser radiation decreases, and the width of the spectrum increases. Various LEDs: The following sources were used: “ultraviolet” diode, blue, yellow, white diodes, and two IR diodes with different wavelengths. Transmission spectra of some light filters:


The emission spectra are shown after interference filters taken from a densitometer. In the lower right corner - the radiation spectrum after the IR filter, taken from the camera. It is worth noting that these are not the transmittances of these filters — to measure the transmittance curve of a light filter, it is necessary to take into account the shape of the spectrum of the light source — in my case it is an incandescent lamp. With such a lamp, the spectrometer had certain problems - as it turned out, the spectra of wide-band light sources are somehow clumsy. I could not figure out what it is connected with. Perhaps the problem is connected with the nonlinear motion of the mirror, perhaps with the dispersion of radiation in the cube, or a poor correction of the non-uniform spectral sensitivity of the photodiode.
And here is the resulting radiation spectrum of the lamp:

The teeth on the spectrum on the right is a feature of the algorithm that compensates for the non-uniform spectral sensitivity of the photodiode.
Ideally, the spectrum should look like this: Testing a spectrometer, one cannot help but look at the spectrum of a fluorescent lamp - it has a characteristic “striped” shape. However, when registering the spectrum with a Fourier spectrometer of the spectrum of an ordinary 220V lamp, a problem arises - the lamp is flickering. However, the Fourier transform allows us to isolate higher-frequency oscillations (units of kHz), given by the interference, from low frequencies (100 Hz) given by the network: Fluorescent lamp spectrum obtained by an industrial spectrometer: All spectra above were obtained using a silicon photodiode. Now I will give the spectra obtained with a germanium photodiode:


The first is the incandescent lamp spectrum. As you can see, it is not very similar to the spectrum of a real lamp (already mentioned earlier).
Right - the transmission spectrum of the solution of copper sulfate. Interestingly, it does not transmit infrared radiation. A small peak at 650 nm is associated with the re-reflection of laser radiation from the reference channel in the base.
This is how the spectrum was filmed:

Below is the water transmission spectrum, to the right of it is a graph of the real water transmission spectrum.
Next come the transmission spectra of acetone, a solution of ferric chloride, isopropyl alcohol.
Finally, I will give the spectra of solar radiation obtained by silicon and germanium photodiodes:

The irregular shape of the spectrum is associated with the absorption of solar radiation by substances contained in the atmosphere. Right - the real form of the spectrum. The shape of the spectrum obtained by a germanium photodiode differs markedly from the real spectrum, although the absorption lines are in place.
Thus, despite all the problems, I still managed to get the interference of white light at home and make a Fourier spectrometer. As you can see, it is not without flaws - the spectra produce several curves, the resolution turned out to be even worse than that of some self-made spectrometers with a diffraction grating (first of all, this is due to the small motion of the moving mirror). But nevertheless - it works!
Interferogram processing program
Source: https://habr.com/ru/post/253947/
All Articles