Create your own weather station, integrated with the Wolfram Cloud
Recently, Stephen Wolfram announced Wolfram Data Drop , which is an excellent tool for downloading any type of data from any device. I will show you how to use Wolfram Data Drop with a homemade weather station, to create which we need only simple hardware and a few lines of code. This meteorological station will take temperature measurements every second, and every minute will unload the average values for that minute into Wolfram Data Drop. Thus, you will get 60 points on the graph of temperature - time every hour, 1440 points per day. Using this data and the Wolfram Programming Cloud , you can study temperature changes over time. For example, you can find out how many times a day the temperature reached certain minimum and maximum values when the temperature changed most quickly. With this data, you can even make predictions. Maybe someone will even be able to make more accurate predictions than the local weather station!
For this experiment you will need:
1) Arduino Yún (or equivalent, but always with Wi-Fi);
')
2) temperature sensor TMP36 ;
3) breadboard and wires.
Here is an assembly diagram. Connect 5V to the left TMP36 lead, ground to the right TMP36 lead, and A0 to the middle TMP36 lead.
Once everything is connected and turned on, the sensor begins to transmit voltage to the A0 pin. If the temperature rises, so does the voltage, and if the temperature drops, so does the voltage, respectively. Thus, we can take the voltage readings and interpret them as temperature. Fortunately, in this experiment we need only three small wires, which allows us to avoid the situation as in the picture below with this unfortunate one:

Now we are ready to write the code for Arduino, which will upload the recorded temperature data to the Wolfram Cloud. Make sure your Arduino Yun is configured to connect to the Internet . Then, using the Arduino application, load the following code on the Arduino after replacing the text “YOUR_BIN_ID” with “Short ID”, which is displayed as a result of the CreateDatabin [] function.


A little explanation about what the code does: the p variable is used to invoke a tool called curl, which allows you to create HTTP requests with an Arduino.
In our case, we set a specific URL for Wolfram Data Drop, which allows you to download temperature data . In the loop loop () , which can be seen in the code, you can observe how the variable val is read from the analog input (A0), and how val is then converted from the initial values to the temperature value temperature .
This temperature is then added to the average value of average exactly 60 times, but on the 60th time the program will calculate the second block with If [].
This code block initializes the data load code, which sends an average value of 60 measurements.
It also resets all counters, so everything will start again.
This is followed by a 1000-millisecond delay, which will arrange the data recorded in a second:
To make sure everything works, you can open the built-in monitor Arduino; in case everything goes as it should, you will see messages like the one below, which will appear every minute (or so):
Now it's time to put our device in something tight (in my case - Hefty bag), and put in a place that is in the shade all day (let's say, on the veranda):
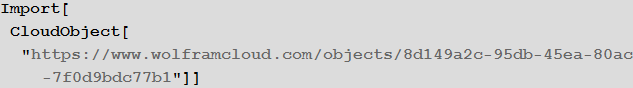
Now we are ready to do some interesting things with the obtained temperature data. It would be best to collect data at least one day before starting the analysis, but the code allows you to work with less data. First we need to get data from databin, which we used to load temperature data.
The program on the Arduino transmits the temperature as a parameter URL, which we use in our program. In my example, databin collected data in 20 days (for the experiment, you need to replace “YOUR_BIN_ID” with the bin ID that was obtained as a result of running CreateDatabin earlier:
Now we need to convert the temperature event series with a few more steps.
First, through TimeSeriesShift, you need to enter data in a time zone.
Next, you should calibrate the sensor, based on data from the nearest major weather stations. Personally, I calibrated my two-dollar TMP36, based on data from one of the meteorological stations of the National Oceanic and Atmospheric Administration (NOAA KCMI), where incomparably more expensive and accurate equipment is located. Calibration is a very important step; as a result of calibration, I had to edit my data by about 5 degrees to match the official ones. There is another good way to calibrate: put the sensor in ice water with a temperature of 0 degrees, and then into a glass of boiling water (100 degrees), and correct the data.
Next, you need to select the time interval of interest. In my case, the starting point is January 22, 9 am. Accordingly, you should replace this date with the one that corresponds to the beginning of your measurements.
Finally, you should repartition data at intervals of 15 minutes, that is, for the construction we will use 15 times fewer points. The fact is that these data will be quite enough to work with intervals, which are measured in days.
Here you can make a quick check whether the data on temperature looks correct:

Data processing does not end there, and we can do very interesting and useful things using them. You can write a function that will collect the minimum / maximum temperature values for each specific day, or any other remarkable values:

The function below creates a new series of events ( EventSeries ) from a given one and collects those points that satisfy a specific function for a given day.


Now you can do the same for daily highs:


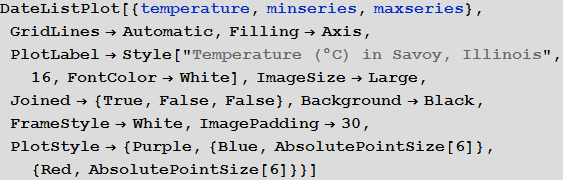
Now we can display temperature data (purple) on a chart with daily highs (red points) and minimums (blue points):
Now we have our own weather station and incoming data that can be easily analyzed. By changing the presented code, you can visualize daily, weekly or monthly average values of temperature. You can also try to predict the temperature for tomorrow, based on previously observed dependencies and, possibly, combining temperature data with some additional ones: humidity, pressure, and the like.
Translation of the post Arnoud Buzing, " Build Your Own Weather Station in a Snap with the Wolfram Cloud!" ".
Download the translation in the form of a Mathematica document, which contains all the code used in the article here .
I express my deep gratitude to Kirill Guzenko for his help in translating.
How to build your own weather station
For this experiment you will need:
1) Arduino Yún (or equivalent, but always with Wi-Fi);
')
2) temperature sensor TMP36 ;
3) breadboard and wires.
Here is an assembly diagram. Connect 5V to the left TMP36 lead, ground to the right TMP36 lead, and A0 to the middle TMP36 lead.
Once everything is connected and turned on, the sensor begins to transmit voltage to the A0 pin. If the temperature rises, so does the voltage, and if the temperature drops, so does the voltage, respectively. Thus, we can take the voltage readings and interpret them as temperature. Fortunately, in this experiment we need only three small wires, which allows us to avoid the situation as in the picture below with this unfortunate one:
Arduino Programming
Now we are ready to write the code for Arduino, which will upload the recorded temperature data to the Wolfram Cloud. Make sure your Arduino Yun is configured to connect to the Internet . Then, using the Arduino application, load the following code on the Arduino after replacing the text “YOUR_BIN_ID” with “Short ID”, which is displayed as a result of the CreateDatabin [] function.
A little explanation about what the code does: the p variable is used to invoke a tool called curl, which allows you to create HTTP requests with an Arduino.
In our case, we set a specific URL for Wolfram Data Drop, which allows you to download temperature data . In the loop loop () , which can be seen in the code, you can observe how the variable val is read from the analog input (A0), and how val is then converted from the initial values to the temperature value temperature .
This temperature is then added to the average value of average exactly 60 times, but on the 60th time the program will calculate the second block with If [].
This code block initializes the data load code, which sends an average value of 60 measurements.
It also resets all counters, so everything will start again.
This is followed by a 1000-millisecond delay, which will arrange the data recorded in a second:
#include < Bridge.h > Process p; int val, count; float voltage, temperature, average; void setup () { count = 0; average = 0; Bridge.begin (); Serial.begin (9600); } void loop () { val = analogRead (0); voltage = val * 5.0; voltage = voltage/1024.0; temperature = (voltage - 0.5)*100; average += temperature; count++; if ( count > 59 ) { p.begin ("/usr/bin/curl"); p.addParameter ("--insecure"); p.addParameter ("--location"); p.addParameter ("https://datadrop.wolframcloud.com/api/v1.0/Add?bin=YOUR_BIN_ID&temperature=" + String (average/60)); p.run (); while (p.available () > 0) { char c = p.read (); Serial.print (c); } Serial.println (); Serial.flush (); count = 0; average = 0; } delay (1000); } To make sure everything works, you can open the built-in monitor Arduino; in case everything goes as it should, you will see messages like the one below, which will appear every minute (or so):
<|"Message" -> "The data was successfully added.", "Bin" -> "DD7051e03ace9-a194-44c1-9864-8fcef8ea9af3", "Data" -> <|"temperature" -> "34"|>, "Timestamp" -> {2015, 2, 9, 16, 18, 39.99526`8.354583502904967}, "Information" -> {"EntryCount" -> 1, "LatestTimestamp" -> 3632487520, "Size" -> 288}|> Now it's time to put our device in something tight (in my case - Hefty bag), and put in a place that is in the shade all day (let's say, on the veranda):
Temperature data analysis
Now we are ready to do some interesting things with the obtained temperature data. It would be best to collect data at least one day before starting the analysis, but the code allows you to work with less data. First we need to get data from databin, which we used to load temperature data.
The program on the Arduino transmits the temperature as a parameter URL, which we use in our program. In my example, databin collected data in 20 days (for the experiment, you need to replace “YOUR_BIN_ID” with the bin ID that was obtained as a result of running CreateDatabin earlier:
Now we need to convert the temperature event series with a few more steps.
First, through TimeSeriesShift, you need to enter data in a time zone.
Next, you should calibrate the sensor, based on data from the nearest major weather stations. Personally, I calibrated my two-dollar TMP36, based on data from one of the meteorological stations of the National Oceanic and Atmospheric Administration (NOAA KCMI), where incomparably more expensive and accurate equipment is located. Calibration is a very important step; as a result of calibration, I had to edit my data by about 5 degrees to match the official ones. There is another good way to calibrate: put the sensor in ice water with a temperature of 0 degrees, and then into a glass of boiling water (100 degrees), and correct the data.
Next, you need to select the time interval of interest. In my case, the starting point is January 22, 9 am. Accordingly, you should replace this date with the one that corresponds to the beginning of your measurements.
Finally, you should repartition data at intervals of 15 minutes, that is, for the construction we will use 15 times fewer points. The fact is that these data will be quite enough to work with intervals, which are measured in days.
Here you can make a quick check whether the data on temperature looks correct:
Data processing does not end there, and we can do very interesting and useful things using them. You can write a function that will collect the minimum / maximum temperature values for each specific day, or any other remarkable values:
The function below creates a new series of events ( EventSeries ) from a given one and collects those points that satisfy a specific function for a given day.
Now you can do the same for daily highs:
Now we can display temperature data (purple) on a chart with daily highs (red points) and minimums (blue points):
Conclusion
Now we have our own weather station and incoming data that can be easily analyzed. By changing the presented code, you can visualize daily, weekly or monthly average values of temperature. You can also try to predict the temperature for tomorrow, based on previously observed dependencies and, possibly, combining temperature data with some additional ones: humidity, pressure, and the like.
Translation of the post Arnoud Buzing, " Build Your Own Weather Station in a Snap with the Wolfram Cloud!" ".
Download the translation in the form of a Mathematica document, which contains all the code used in the article here .
I express my deep gratitude to Kirill Guzenko for his help in translating.
Source: https://habr.com/ru/post/253925/
All Articles