Solution Management at SEBoK
Continuing the translation of SEBoK for the System Analysis course for undergraduates, made the translation of another section of SEBoK - Decision Management (in the original - Decision Management). This chapter includes more practical examples and is more close to reality than the description of methods and principles of systems analysis.
The chapter describes decision-making based on multivariate analysis and promotes goal-oriented thinking (Value-Focused Thinking).
Systems engineering (systems engineering) includes many complex solutions, including many stakeholders, challenging competing goals, a large amount of uncertainty, and significant consequences.
In such a situation, good decision making requires a formalized decision management process. The goal of the decision management process (ISO / IEC 15288: 2008):
Situations that require decisions (opportunities) usually occur throughout the entire life cycle of the system. The decision management method is most often used by system engineers in evaluating alternatives. The research of alternatives is aimed at defining, measuring and evaluating the requirements of interested parties in order to make it easier for the decision maker to find the option that represents the best balance between competing goals.
Using the technique of decomposing the considered solutions into logical parts and the subsequent synthesis of these parts back into a single whole, the decision management process allows the decision maker to work at a level that is understandable for humans, while avoiding unnecessary simplification of the problem.
In addition, by decomposing a common problem, experts may be able to evaluate alternatives within their subject area.
The decision analysis process is depicted in Figure 1 below. The Solution Management process is based on several “best practices”, including:
')
The center of the diagram shows five areas (clockwise): productivity, growth potential (scalability), schedule, development and delivery costs, and maintenance costs. The ten blue arrows represent the tasks of the decision-making process, and the white text on a green background represents the elements of the System Engineering process. The interaction is shown by small dotted green or blue arrows.
The process of analyzing decisions is repetitive. To demonstrate each of the stages, the following sections describe the problem of creating a UAV .
To ensure that the team fully understands the context of the decision, the analyst should describe the basic indicators, boundaries and interfaces of the system. The solution context includes: system description, life cycle stage, decision stages, list of decision makers and stakeholders, available resources. It is best to determine the formulation of the decision problem from the point of view of the life cycle of the system.
Determine how difficult it is to make important decisions. Ralph Keeney (2002, MIT Professor):
First, it is necessary to define requirements and indicators, using, for example, interviews and focus groups with subject matter experts (“expert”) and stakeholders. When evaluating alternatives in systems engineering, stakeholder values often include competing requirements in terms of performance, development schedule, cost, support cost, and development prospects. In corporations, the requirements of each shareholder should also be included in this list.
In terms of performance, a functional decomposition will help get a detailed set of potential targets. This list of main goals needs to be verified that each goal is really important and controllable (controllable), and that the entire set is complete, not redundant, concise, concrete and understandable (Edwards et al. 2007). Figure 2 shows an example of a target hierarchy.

Figure 2. Hierarchy of basic requirements (INCOSE DAWG 2013).
For each requirement, indicators must be defined to determine the value of each option in terms of this requirement. The indicator (property, evaluation criterion and metric) must be unambiguous, exhaustive, permanent, valid and understandable (Keeney & Gregory 2005).
The defining feature of multi-factor (multi-purpose) decision analysis is the transition from the space of indicators to the space of values. The transition is performed using the evaluation function (value function, comment. Translation : in our literature, the term "function of desirability" ), which combines the measurement scale with the range of assessment.
When creating the evaluation function “point of failure” (walk-away point) on the indicator scale (x axis) should be set to 0 on the rating scale (y axis). The “point of failure” is a measurement result at which, regardless of other results, the decision maker will refuse this decision. An assessment of the measurements is also determined to the point where the alternatives no longer add value, which is marked as “attainable goal” (stretch goal, ideal). After that, the segment is marked up to 100 points (or 1, 10) on the rating scale (y-axis).
Figure 3 shows the most common curves. The justification of the form of the evaluation function should be documented for tracking and protection.
Mathematics of multi-criteria decision analysis requires that weights depend on the importance of the metric and its range (from the “point of failure” to the ideal value). A useful tool for determining the priority of weights is the swing weight matrix. For each indicator, its importance is taken into account by determining whether it corresponds to the stated, critical or possible functions, taking into account
the gap between the current implementation and the required one; as a result, the name of the measure is set in the corresponding cell of the matrix (Figure 4).
The top priority metrics are located in the upper left corner and have an irregular weight of 100. The unnormalized weight decreases towards the lower right corner of the matrix. Weight fluctuation is evaluated by comparing it with the most important measurement value or other measure. Weight is normalized to a total of one for the entire model used in the following sections.
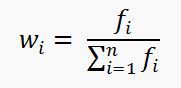
Normalization is performed according to the formula:
Where:
To help create a creative and comprehensive set of alternatives covering the whole solution space, consider developing an alternative creation table (also known as a “morphological box”). This is the best method for establishing the semantic structure of the product for the system and for use in the presentation of the solution (Figure 5).
When objectives and metrics are established and alternatives are identified, the problem solving team should hire subject experts with real data, test results, models, and expert knowledge. It is better to record the estimates in the evaluation sheets for each combination of alternative-metric, which describes the source of the assessment and the main reason (explanation). Figure 6 shows a set of estimates.
In addition to the alternatives found, the pricing matrix includes a row for the perfect solution. The ideal is a tool for goal-oriented thinking, which will be discussed later.
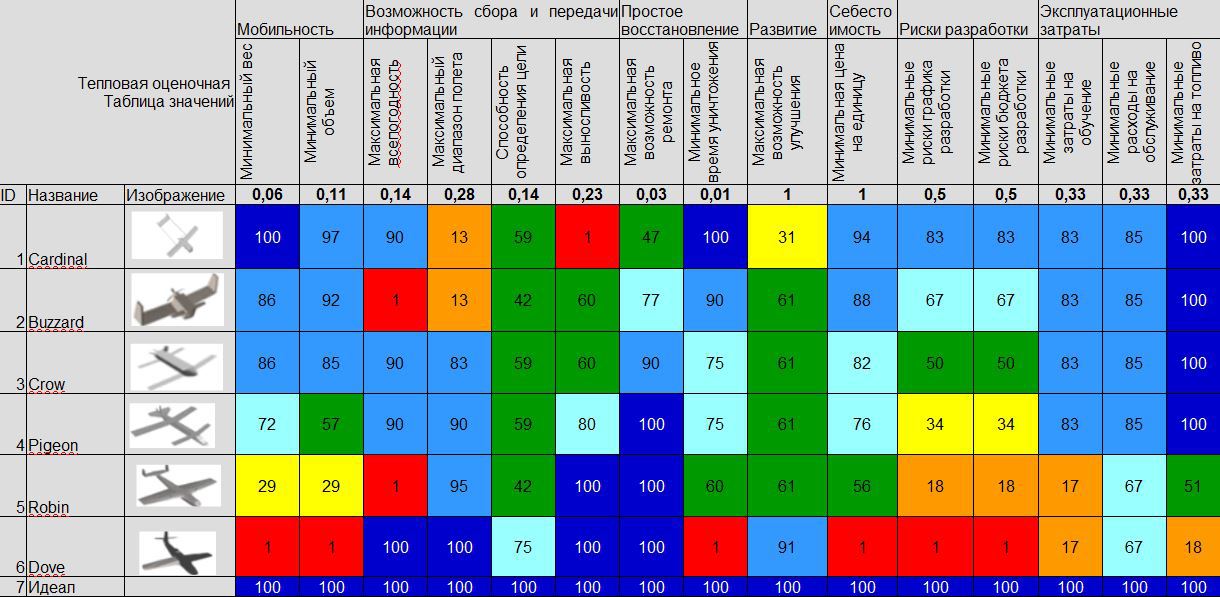
You can then turn the measurements into a rating table using the evaluation function developed earlier. The color scheme can be useful for visualizing tradeoffs between different options and determining when the options need to be developed (Figure 7).
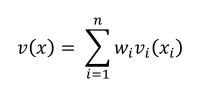
The final score of each alternative is calculated using the following formula:
Where:
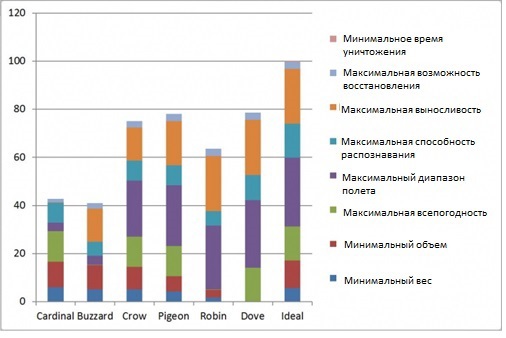
The diagram of values by component (Figure 8) shows the overall assessment and the contribution of each weighted assessment to it for each option.
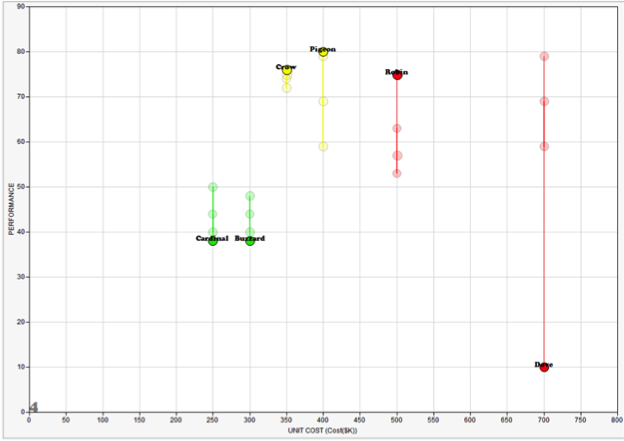
In the center of the process of managing systems engineering solutions, the analysis of alternatives is the possibility of evaluating all queries (values) of stakeholders. The variation chart for stakeholder values in Figure 9 demonstrates 5 measurements for each alternative:
Each alternative system is represented by a marker on the scatter diagram (Figure 9):
As part of the assessment, experts should discuss the possible uncertainty of the independent variables. Independent variables are variables that affect one or more assessment points; such estimates are called independent. Often, experts can evaluate high, acceptable, and low boundaries assuming low, medium, or high functionality. The Monte Carlo method, using this data, summarizes the effects of uncertainty and helps to determine the random variables that most affect the solution.
Determining the effect of random variables - risk analysis and sensitivity
Decision analysis uses many forms of sensitivity analysis, including linear, “tornado”, “waterfall” ( note translation: the name “bridge” is often used ) and several methods for analyzing uncertainty, including the Monte Carlo Method, decision tree, influence diagrams .
Line charts are used to demonstrate sensitivity to changes in weights. Figure 10 shows the results of applying the Monte Carlo Method to analyze functional ratings.
The obtained data for the analysis of alternatives will most likely open up possibilities for modifying some solutions, state previously unknown values, and / or reduce the risk. The use of initial conclusions to create new alternatives begins the process of transition of decision-making from “Variant-oriented thinking” to “Goal-oriented thinking”.
This is the point of the process where the decision analysis team identifies the key results of the tradeoffs and the most important uncertainties and risks.
It is often useful to describe the recommendations in the form of a clearly formulated, concrete list of tasks in order to increase the likelihood of a solution being implemented. Reports are important for tracking history and decision making in the future.
Take the time and effort to create a comprehensive, high-quality report with a detailed description of the research results and their rationale. Consider the possibility of expanding static pages of a paper report with dynamic links in electronic form.
The chapter describes decision-making based on multivariate analysis and promotes goal-oriented thinking (Value-Focused Thinking).
Systems engineering (systems engineering) includes many complex solutions, including many stakeholders, challenging competing goals, a large amount of uncertainty, and significant consequences.
In such a situation, good decision making requires a formalized decision management process. The goal of the decision management process (ISO / IEC 15288: 2008):
"... provide a structured, analytical basis for identifying, describing and evaluating a set of alternative solutions at any point in the life cycle and choosing the most profitable line of business."
Situations that require decisions (opportunities) usually occur throughout the entire life cycle of the system. The decision management method is most often used by system engineers in evaluating alternatives. The research of alternatives is aimed at defining, measuring and evaluating the requirements of interested parties in order to make it easier for the decision maker to find the option that represents the best balance between competing goals.
Using the technique of decomposing the considered solutions into logical parts and the subsequent synthesis of these parts back into a single whole, the decision management process allows the decision maker to work at a level that is understandable for humans, while avoiding unnecessary simplification of the problem.
In addition, by decomposing a common problem, experts may be able to evaluate alternatives within their subject area.
Solution Management Process
The decision analysis process is depicted in Figure 1 below. The Solution Management process is based on several “best practices”, including:
- The use of mathematical methods of decision analysis for the study of alternatives. Parnell (2009).
- Development of one main solution model (master model), followed by its refinement, updating and use as required to evaluate alternatives throughout the life cycle.
- Use Targeted Thinking (Value-Focused Thinking, VFT) to get the best alternatives.
- Identification of uncertainties and risk assessment for each decision.
Figure 1. Solution Management Process (INCOSE DAWG 2013)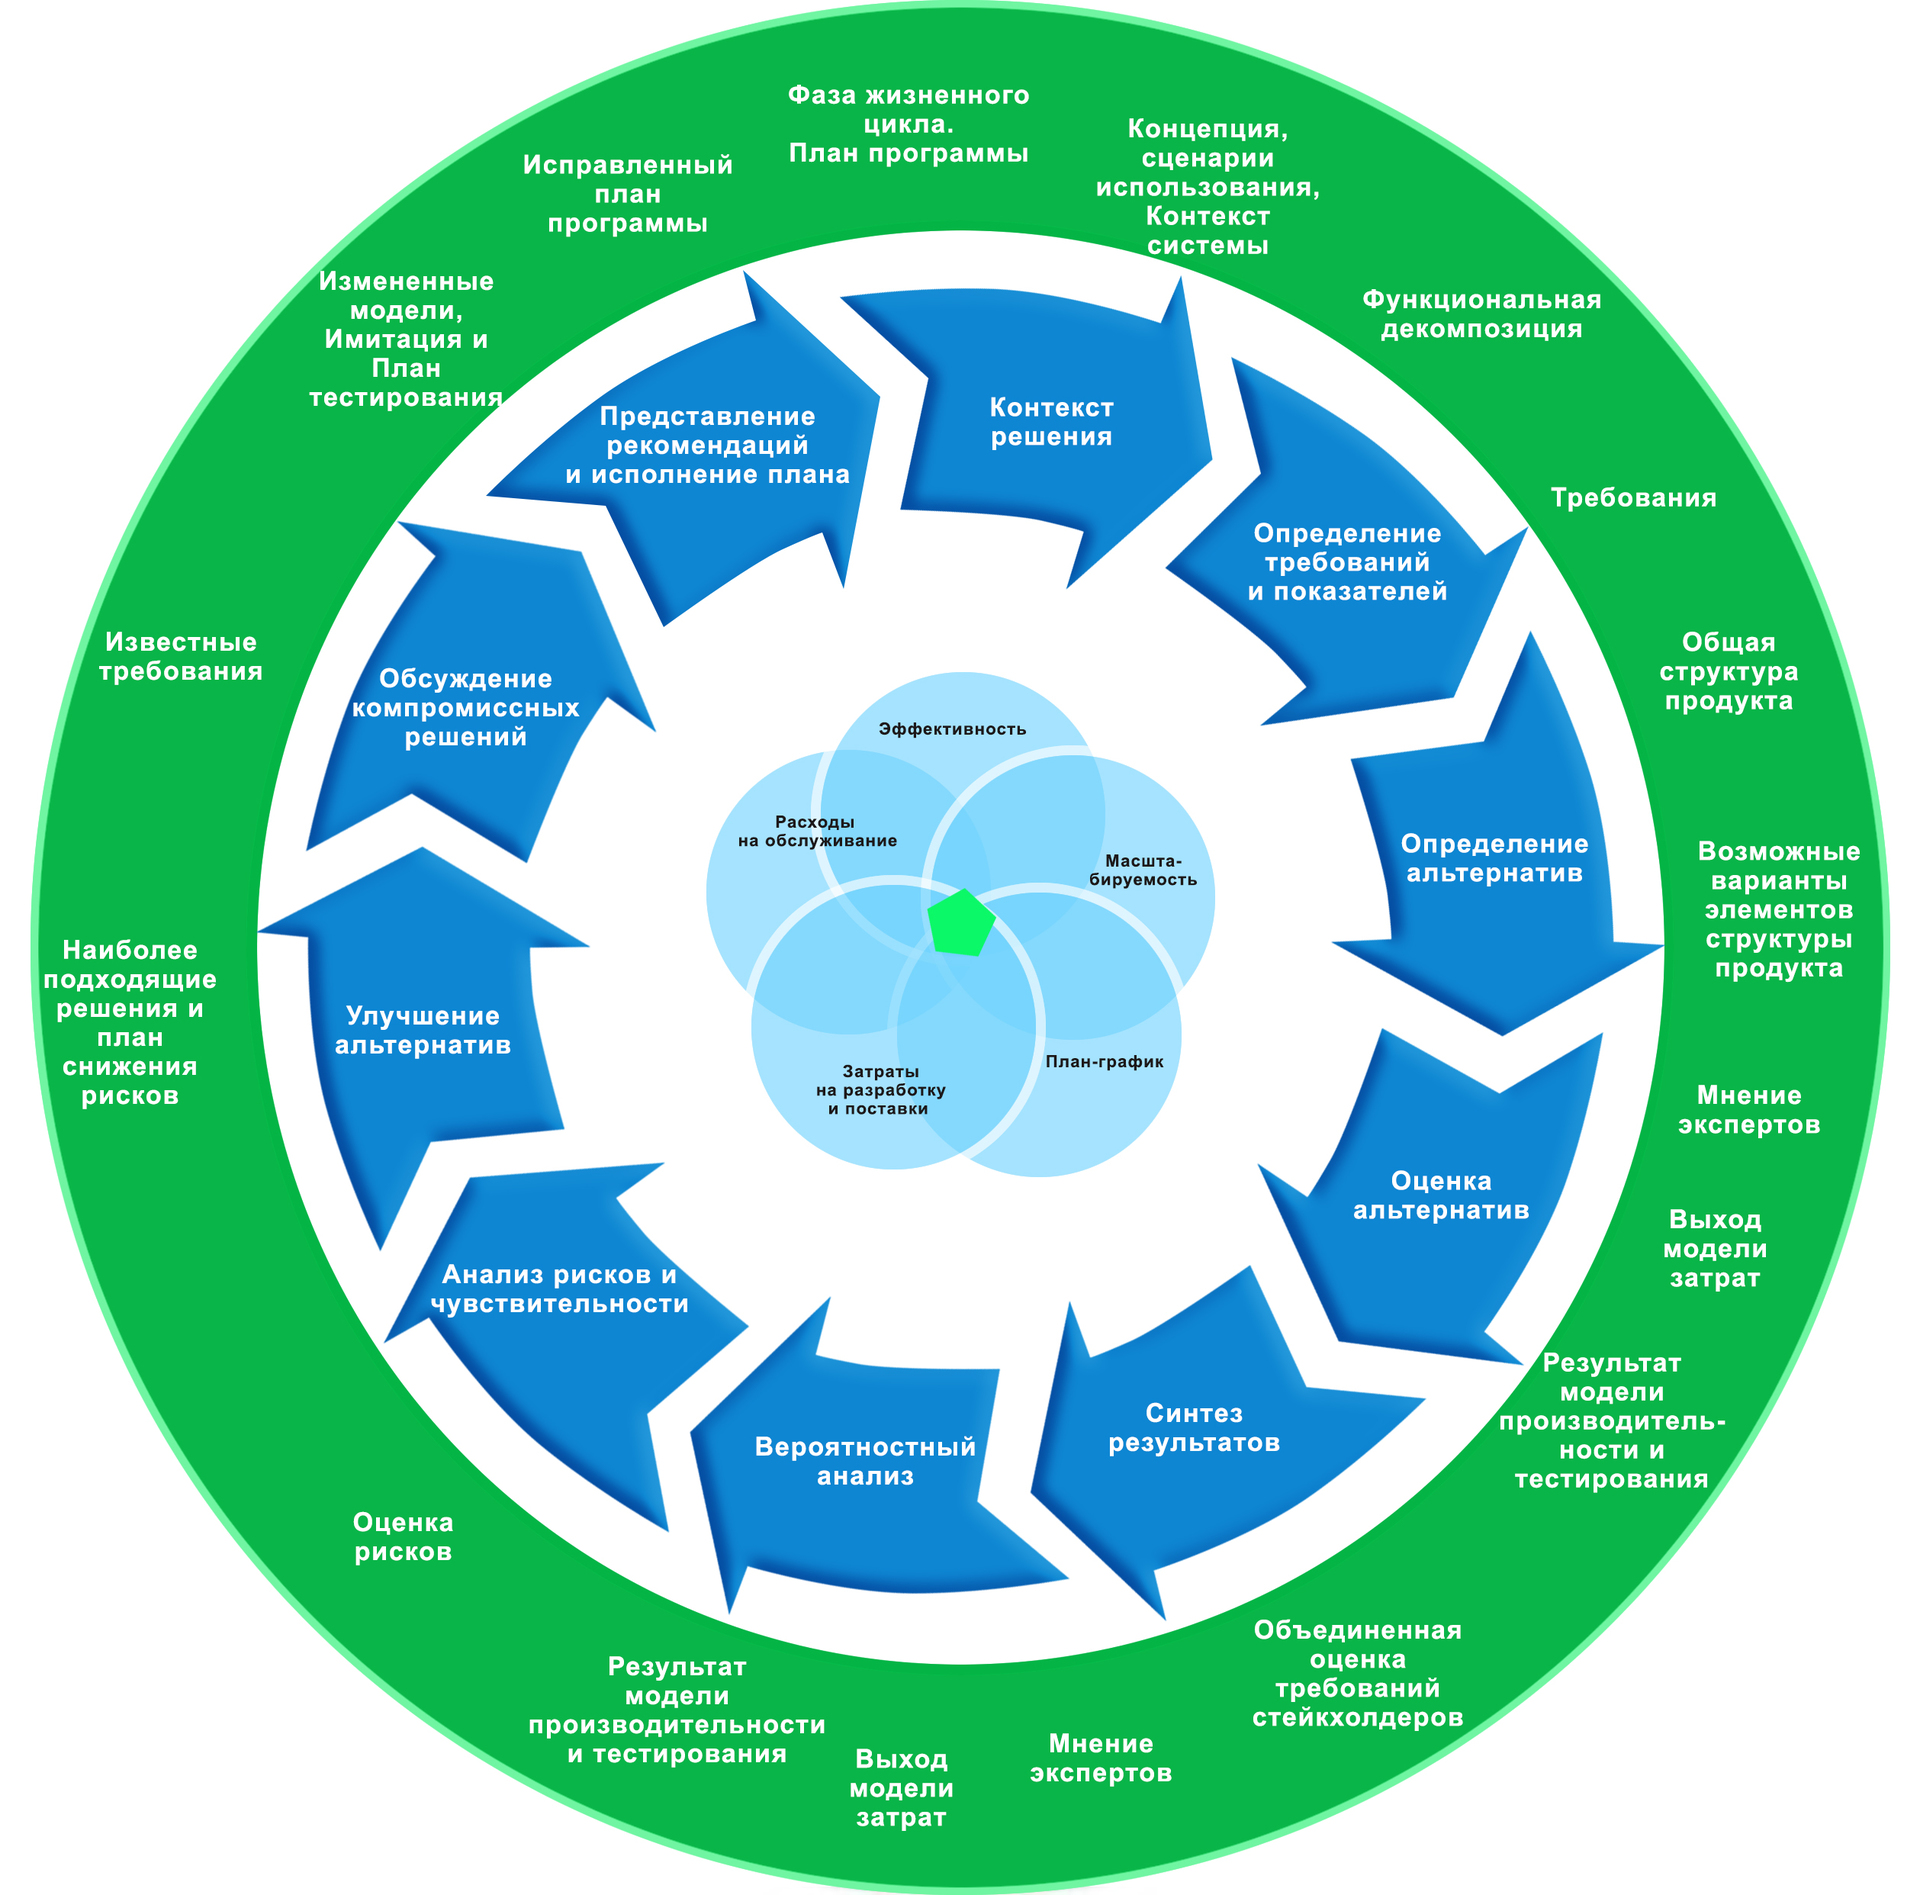
')
The center of the diagram shows five areas (clockwise): productivity, growth potential (scalability), schedule, development and delivery costs, and maintenance costs. The ten blue arrows represent the tasks of the decision-making process, and the white text on a green background represents the elements of the System Engineering process. The interaction is shown by small dotted green or blue arrows.
The process of analyzing decisions is repetitive. To demonstrate each of the stages, the following sections describe the problem of creating a UAV .
Limiting and adapting solutions (decision context)
To ensure that the team fully understands the context of the decision, the analyst should describe the basic indicators, boundaries and interfaces of the system. The solution context includes: system description, life cycle stage, decision stages, list of decision makers and stakeholders, available resources. It is best to determine the formulation of the decision problem from the point of view of the life cycle of the system.
Development of requirements and indicators
Determine how difficult it is to make important decisions. Ralph Keeney (2002, MIT Professor):
“The most important decisions have multiple goals, and usually with multi-purpose solutions you cannot achieve them all. You will be forced to accept less compliance with some requirements in order to more fulfill others. But how much less will you agree to achieve how much more? ”
First, it is necessary to define requirements and indicators, using, for example, interviews and focus groups with subject matter experts (“expert”) and stakeholders. When evaluating alternatives in systems engineering, stakeholder values often include competing requirements in terms of performance, development schedule, cost, support cost, and development prospects. In corporations, the requirements of each shareholder should also be included in this list.
In terms of performance, a functional decomposition will help get a detailed set of potential targets. This list of main goals needs to be verified that each goal is really important and controllable (controllable), and that the entire set is complete, not redundant, concise, concrete and understandable (Edwards et al. 2007). Figure 2 shows an example of a target hierarchy.
Figure 2. Hierarchy of basic requirements (INCOSE DAWG 2013).
For each requirement, indicators must be defined to determine the value of each option in terms of this requirement. The indicator (property, evaluation criterion and metric) must be unambiguous, exhaustive, permanent, valid and understandable (Keeney & Gregory 2005).
The defining feature of multi-factor (multi-purpose) decision analysis is the transition from the space of indicators to the space of values. The transition is performed using the evaluation function (value function, comment. Translation : in our literature, the term "function of desirability" ), which combines the measurement scale with the range of assessment.
When creating the evaluation function “point of failure” (walk-away point) on the indicator scale (x axis) should be set to 0 on the rating scale (y axis). The “point of failure” is a measurement result at which, regardless of other results, the decision maker will refuse this decision. An assessment of the measurements is also determined to the point where the alternatives no longer add value, which is marked as “attainable goal” (stretch goal, ideal). After that, the segment is marked up to 100 points (or 1, 10) on the rating scale (y-axis).
Figure 3 shows the most common curves. The justification of the form of the evaluation function should be documented for tracking and protection.
Figure 3. Examples of evaluation function (INCOSE DAWG 2013)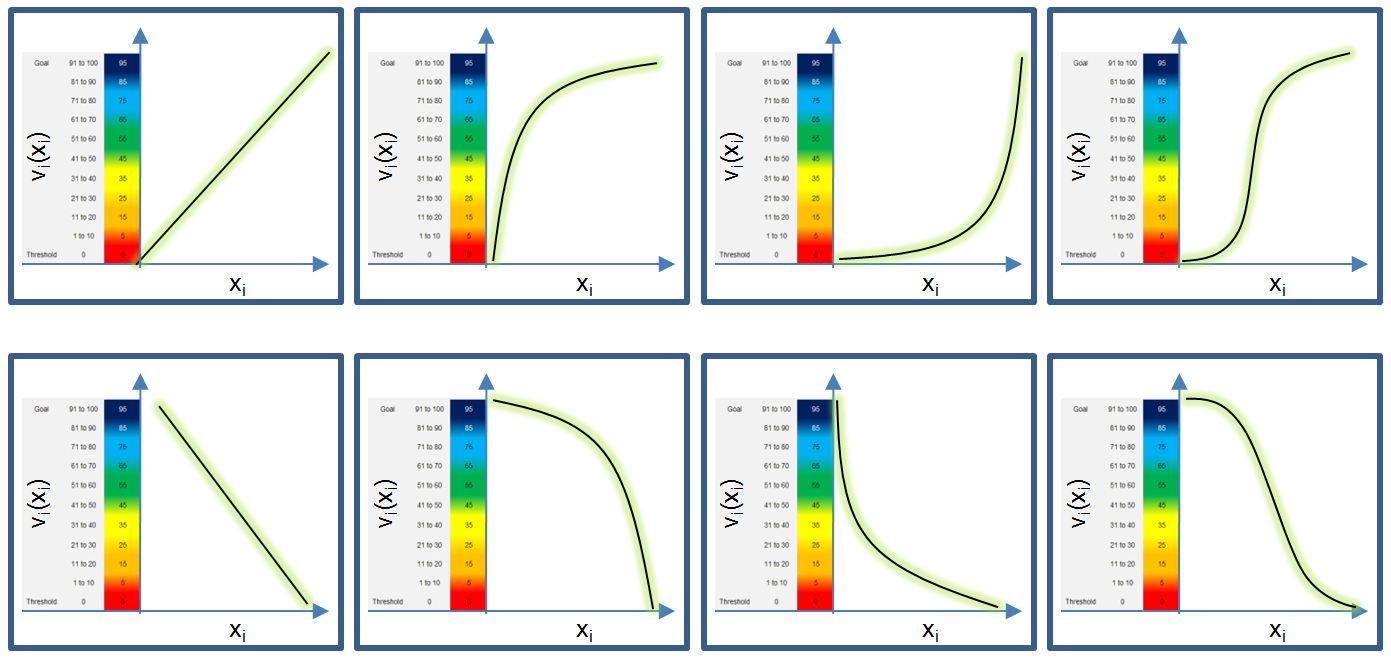
Figure 3. Examples of evaluation function (INCOSE DAWG 2013).
Figure 3. Examples of evaluation function (INCOSE DAWG 2013).
Mathematics of multi-criteria decision analysis requires that weights depend on the importance of the metric and its range (from the “point of failure” to the ideal value). A useful tool for determining the priority of weights is the swing weight matrix. For each indicator, its importance is taken into account by determining whether it corresponds to the stated, critical or possible functions, taking into account
the gap between the current implementation and the required one; as a result, the name of the measure is set in the corresponding cell of the matrix (Figure 4).
The top priority metrics are located in the upper left corner and have an irregular weight of 100. The unnormalized weight decreases towards the lower right corner of the matrix. Weight fluctuation is evaluated by comparing it with the most important measurement value or other measure. Weight is normalized to a total of one for the entire model used in the following sections.
Normalization is performed according to the formula:
Where:
- w_i - indicator weight (normalized);
- f_i - unnormalized weight of the indicator.
Figure 4. Weights oscillation matrix (INCOSE DAWG 2013)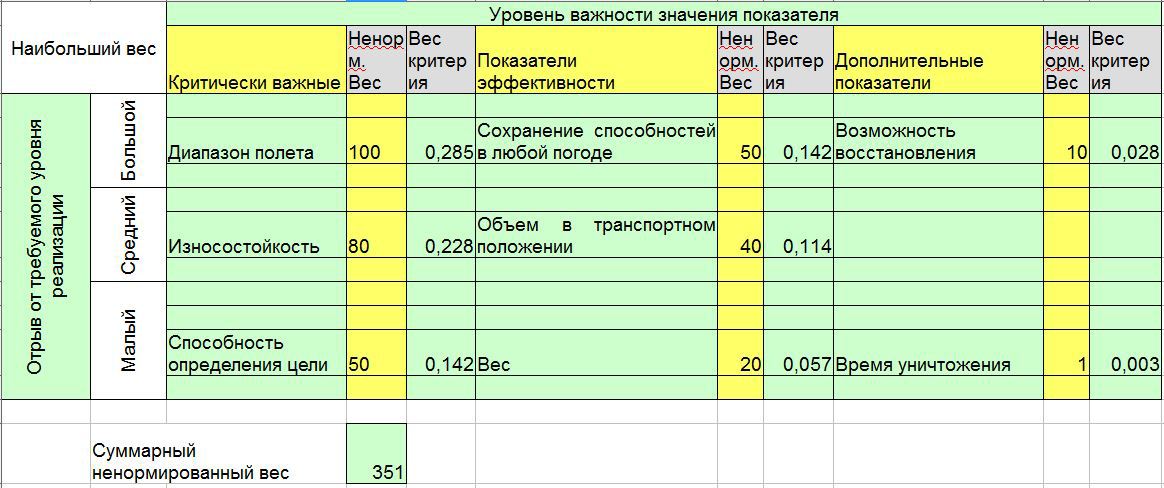
Creating alternatives
To help create a creative and comprehensive set of alternatives covering the whole solution space, consider developing an alternative creation table (also known as a “morphological box”). This is the best method for establishing the semantic structure of the product for the system and for use in the presentation of the solution (Figure 5).
Figure 5. Description of alternatives (INCOSE DAWG 2013).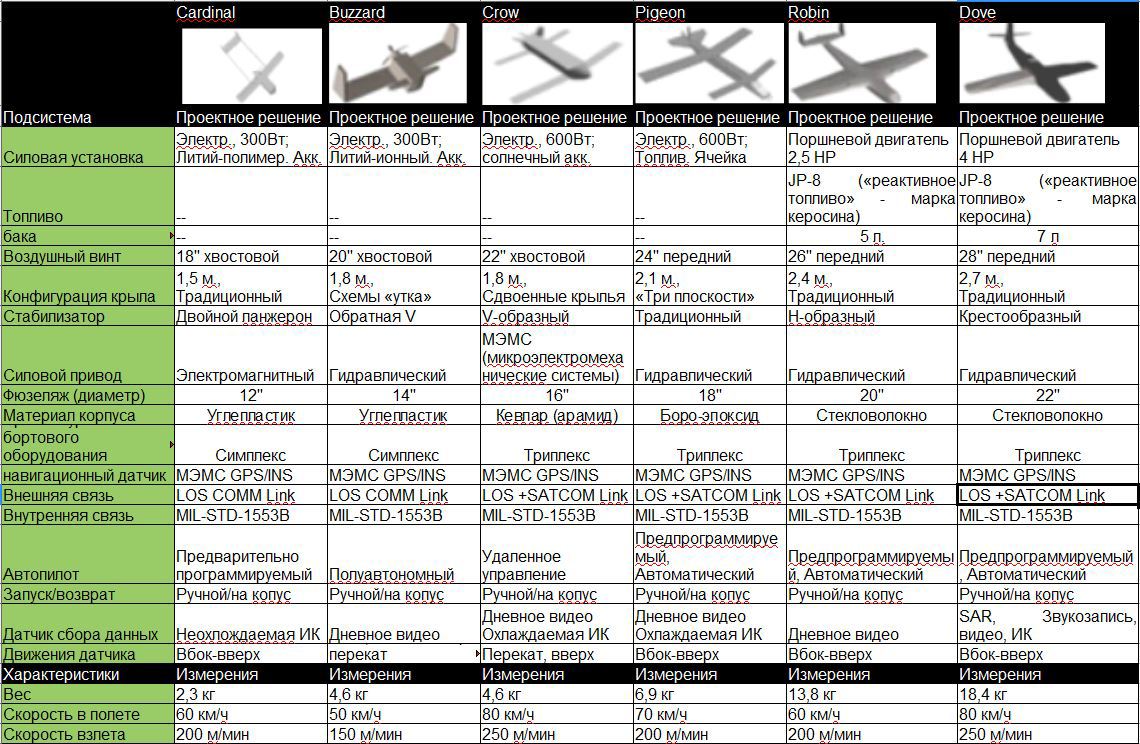
Evaluation of alternatives using deterministic (factor) analysis
When objectives and metrics are established and alternatives are identified, the problem solving team should hire subject experts with real data, test results, models, and expert knowledge. It is better to record the estimates in the evaluation sheets for each combination of alternative-metric, which describes the source of the assessment and the main reason (explanation). Figure 6 shows a set of estimates.
Figure 6. Measuring Alternatives (INCOSE DAWG 2013)
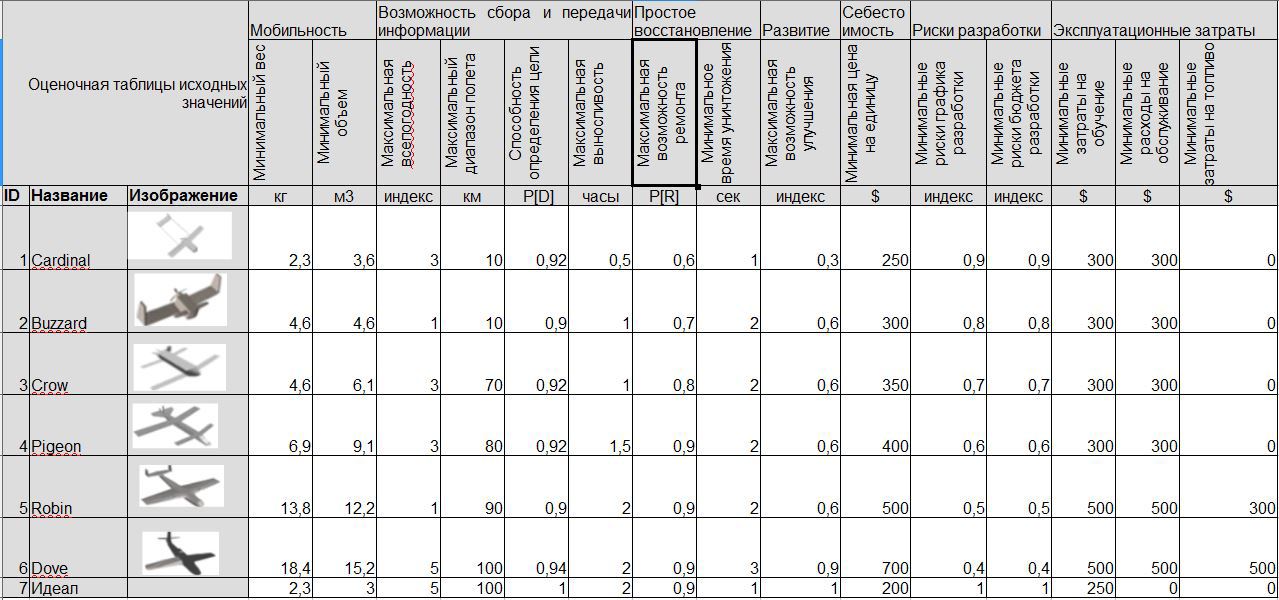
In addition to the alternatives found, the pricing matrix includes a row for the perfect solution. The ideal is a tool for goal-oriented thinking, which will be discussed later.
Synthesis of results
You can then turn the measurements into a rating table using the evaluation function developed earlier. The color scheme can be useful for visualizing tradeoffs between different options and determining when the options need to be developed (Figure 7).
Figure 7. Indicator values from a color map (INCOSE DAWG 2013)
The final score of each alternative is calculated using the following formula:
Where:
- V (x) is the estimate of the alternative;
- i = 1 to n is the number of metrics (criteria);
- xi is the value of the alternative by the ith criterion;
- vi (xi) is the value of the estimate xi (one-dimensional estimate).
- wi is the weight of the i¬th criterion.
- The sum of all wi is 1:
 .
.
The diagram of values by component (Figure 8) shows the overall assessment and the contribution of each weighted assessment to it for each option.
Figure 8. Chart of values by component (INCOSE DAWG 2013)
In the center of the process of managing systems engineering solutions, the analysis of alternatives is the possibility of evaluating all queries (values) of stakeholders. The variation chart for stakeholder values in Figure 9 demonstrates 5 measurements for each alternative:
- Cost price;
- Functionality;
- Implementation risk;
- Development prospects;
- Operating costs and maintenance costs.
Figure 9. An example of a stakeholder scatter plot (INCOSE DAWG 2013).

Each alternative system is represented by a marker on the scatter diagram (Figure 9):
- Cost price and functionality are plotted along the X and Y axes.
- Implementation risk is indicated by the marker color (green = low, yellow = medium, red = high).
- Development prospects are displayed as the number of “hats” above the corresponding marker (1 “hat” = low, 2 = medium, 3 = high).
Identify uncertainty and conduct probabilistic analysis
As part of the assessment, experts should discuss the possible uncertainty of the independent variables. Independent variables are variables that affect one or more assessment points; such estimates are called independent. Often, experts can evaluate high, acceptable, and low boundaries assuming low, medium, or high functionality. The Monte Carlo method, using this data, summarizes the effects of uncertainty and helps to determine the random variables that most affect the solution.
Determining the effect of random variables - risk analysis and sensitivity
Decision analysis uses many forms of sensitivity analysis, including linear, “tornado”, “waterfall” ( note translation: the name “bridge” is often used ) and several methods for analyzing uncertainty, including the Monte Carlo Method, decision tree, influence diagrams .
Line charts are used to demonstrate sensitivity to changes in weights. Figure 10 shows the results of applying the Monte Carlo Method to analyze functional ratings.
Figure 10. Uncertainty on functionality based on the Monte Carlo method (INCOSE DAWG 2013).
The development of alternatives
The obtained data for the analysis of alternatives will most likely open up possibilities for modifying some solutions, state previously unknown values, and / or reduce the risk. The use of initial conclusions to create new alternatives begins the process of transition of decision-making from “Variant-oriented thinking” to “Goal-oriented thinking”.
Talk compromises
This is the point of the process where the decision analysis team identifies the key results of the tradeoffs and the most important uncertainties and risks.
Submission of recommendations and implementation of the action plan
It is often useful to describe the recommendations in the form of a clearly formulated, concrete list of tasks in order to increase the likelihood of a solution being implemented. Reports are important for tracking history and decision making in the future.
Take the time and effort to create a comprehensive, high-quality report with a detailed description of the research results and their rationale. Consider the possibility of expanding static pages of a paper report with dynamic links in electronic form.
Source: https://habr.com/ru/post/253679/
All Articles