Visualization of equipment performance statistics with R - Shiny
"Illiterate in the 21st century will not be those
who can't read and write,
and those who cannot learn,
unlearn and relearn "
Alvin toffler
IT professionals may have tasks related to analyzing equipment performance or analyzing the results of various load generators (ioMeter, Vdbench, etc.). In most cases, Excel is used for these purposes with the construction of time series, with finding the main descriptive statistics and trying to somehow analyze it all. There is an alternative means of quicker and more convenient analysis of descriptive statistics with various diagrams and the possibility of creating a web application for general access. I will not touch on these statistics with various data analysis methods, only basic descriptive statistics (without testing tests and even p-values will not) and different charts.
In this article I will describe one of the options for analyzing such information, presenting it in the form of diagrams ( traffic! ), And all this in the form of a web application. As the name of the article suggests, this is implemented on R, with a package (framework) for web applications to R - Shiny .
In the case when nominal variables (LUN, RAID groups, load profiles, etc.) are few - units, then using Excel is not difficult. But when their number increases and it is necessary to compare different quantitative characteristics within one variable or, especially, between different variables, then using Excel and, especially, only time series is irrational - the probability of making false prerequisites, finding something that is not there or overlooking the obvious is great. Not to mention the time spent, the effort, the abundance of sheets, dozens - hundreds of graphs on these sheets, about the sources of data that you forget the next day. Many (very illustrative) types of charts in Excel cannot be built at all; others require the use of add-ons or writing volumetric code in VBA, or with a dozen manual steps to set up charts. But even in the simple case, analysis, identification of dependencies by classical time series is not a good idea, since they primarily serve other purposes — assessing the evolution of a variable over time, decomposing the time series into components, and predicting the series. But not at all in order to place several graphs on one diagram, and even with two different axes and try to find dependencies between variables. In particular, the creator of the ggplot2 package Hadley Wickham (statistician) wrote the following in 2008 about this: “ I’m reading this and I’m not serious .”
')
Previously, I carried out data analysis (for personal projects) using Excel (including writing VBA code), and from time to time I heard about R, but I was skeptical, thinking that Excel is quite enough for me. When interest overwhelmed skepticism, I was pleasantly surprised at how quickly and simply it was possible to manipulate data, evaluate different models and build various diagrams with many independent variables, literally into several teams. Most operations are vectorized; therefore, operations are performed promptly and there is no need for cycles in most cases. It is also worth noting the wider world community on R, which opens up great opportunities to resolve some issues.
The information is loaded using the basic read.table () function with the necessary parameters (column separator, fractional separator, row header).
Sometimes it is necessary to organize data, and depending on the goals, different types of data presentation (narrow - variables of one dimension are indicated in one column, but with nominal parameters in other columns, or wide - each variable in different columns) may be more convenient than another. For example, a narrow format is more convenient for building diagrams of the ggplot2 package, but there are no difficulties with a wide format. Tidyr and dplyr packages are convenient tools for converting tables to different formats and manipulating data.
The main parameters are the minimum (Min) and maximum (Max) value of the variable, its median (Median), its arithmetic mean (Mean), first (1st Qu.) And third (3rd Qu.) Quartile. All these parameters can be calculated by the summary () function, and using it together with the tapply () function, it is possible to obtain results separately for any observable variable with certain conditions, or for greater flexibility, you can use the function describe () ( describeBy () ) which displays more statistical information, but allows you to conveniently group the source data.
"... there is no more powerful statistical method,
than a well-chosen schedule "
J. Chambers
One of the main advantages of R is the variety of types of diagrams that he can build. Charts are an integral part of the exploratory data analysis, allow to identify patterns and trends in complex data sets. In this section, I will give nine basic conceptually different diagrams, a brief description and an example of their use. Of course, every study suggests its own assumption about variables, in which the use of specific diagrams is more revealing and it is not always necessary to use all of them, but in some cases this set will not be enough (more than 1,000 diagrams in R in different packages in general) . Many diagrams have very flexible parameters that allow you to customize the result of the diagram in the desired form, as well as in the design (axes, axis labels, name, colors).
All the usual time series, is a series of data in which measurements of indicators are repeated at certain intervals of time. As mentioned above, these graphs are good for visual assessment of one of the studied variables and its development over time. But in the general case, in addition to visual analysis, such diagrams are intended for decomposition of a series into components, and possible further forecasting of the development of a trend. If there is no time reference, when comparing different variables, it is better to use the diagrams below, thereby eliminating one of the dimensions — time (in the case of using time, use time as a nominal variable — color it or use panel diagrams).

These diagrams are graphs in which points are used to display the values of some quantitative variables, which can additionally be divided into groups according to the levels of some nominal (or quantitative) variables (these groups are defined by color and / or size). In this example, delays (ms) and performance (IOps) are shown for all measurements of different profiles, divided into groups (cache size is encrypted at the point size, and RAID type is encrypted with colors). Thus, in this diagram 4 different variables are displayed at once:

The analyzed data is divided into separate categories and for each of them a separate diagram (panel) of a certain type is built. All these diagrams are then combined in one figure (vertically, horizontally, by a grid), which greatly facilitates the identification of statistical patterns and structures in the data. In this diagram, example 2 is used, it is clear that the data layer by RAID groups was transferred to two separate panels (left and right), but now the cache size is used as a grouping parameter (it is painted in color). And now it is additionally possible to add one group (additional variable) - the size of a point, thereby increasing the number of independent variables to five, on a single diagram, without losing visibility.

The histogram (density - smoothing histogram curve (line of bars)) allows you to visualize the distribution of the values of the analyzed variable, also combining variables in one diagram that can be further divided into groups according to the levels of some nominal (or quantitative) variables, allows you to compare the frequency of occurrence . In this example, for example, a single density distribution of performance (IOps) is shown depending on the type of RAID created.

This diagram is suitable for reflecting the basic robust (stable) characteristics of the sample; this function also allows you to display several boxplots simultaneously, which allows you to quickly and efficiently evaluate descriptive statistics for different factor variables. In this example, for example, statistics of performance distribution (MB / s) for different load profiles are shown (in fact, this is analogous to the summary ( ) function conclusions, but in graphical form, and with added emissions, which is more significant):
This graph is a family of point diagrams (p.2), reflecting in pairs the dependence of the values of each variable on each other variable. In this example, pairwise dependencies of all 5 variables are shown, it is also possible to add another 6 variables, by coloring one of the factors in color.

This graph allows you to compare a significant number of independent variables for each nominal value, and show the pairwise relationship between them, and color in color one of the nominal variables. Despite the unusual appearance, in many cases, these diagrams can help to quickly classify a set of multidimensional data. So, in this example, the diagram shows that one load profile (orange) with high input-output operations does not entail an increase in load, and some (blue) vice versa; some of the profiles (green) stably show a high delay, it is also clear that some profiles fall into the same place on each sign, you can see where (small or large values) many signs are shifted, etc.

This chart displays the value of a particular variable in its own color, this chart will be useful for displaying any characteristics in relation to the actual physical placement of equipment components. For example, display more “hot” (in performance, in time, in access frequency, etc.) disks in the shelves (as in this example: horizontal - slot numbers, vertical - shelf numbers), or display more hot RAID groups or pools associated with their physical disks in the array.
Also, different pictograms (stars, Chernov faces) can be used for analyzing aggregated multidimensional data.
The idea of such diagrams is that people clearly distinguish objects, in this case, faces (and not a set of tens of values from 10–20 digits). In the above example, each person corresponds to one load profile, which in the aggregated (median) form reflects the characteristics of feature values (performance (two types), delays (three types)). A quick glance at this chart will allow you to quickly determine whether the profile characteristics differ significantly (coincide), with a detailed overview (features) it will be clear in which signs (each facial feature is a separate feature of the original dataset) the similarity and what the difference is.

All the code for loading data, converting data and displaying diagrams is written in R-Studio , a convenient graphical shell to R, which is quite enough for getting quick results and writing reports. But a situation may arise in a flexible, dynamic means of setting up results (selection of axes, diagrams, scaling, saving results into graphic files and much more), and / or in the case of demonstration of results to a wide range of colleagues, customer, partners. In this case, it is quite convenient to bind the existing code (or immediately write a new one) to the I / O elements of the web application using the Shiny package. Shiny is a package (framework) for rapid development of web applications. I stumbled upon it completely by accident, and my surprise at using R was also transferred to it: several types of basic I / O elements, convenient binding of the computation code to I / O elements, dynamic change of input elements, reactive variables and functions — everything turned out much easier than i thought. A great solution for hiding the code and showing only the "twirling twigs" and pictures.
Both in the case of using Shiny , and without it, the entire code R is in text files with the extension R. The only difference in the case of Shiny is two such files - ui.R (description of the input-output elements) and server.R (all calculations ) (although you can do Shiny applications in one file, but for me it’s more convenient to leave two). Therefore, the distribution of results is as follows:
For R users:
1. Direct distribution of R files (separately or in archive)
2. Placing R files using Github. To get the files, in R it is enough to execute one command and the files will be loaded locally, and it becomes possible to start them.
For everyone (in these cases, there is no need to have an installed R, Shiny is launched from the browser):
1) placing Shiny applications on your local Shiny server (there are two options - free and paid (with authentication and SSL));
2) placing Shiny applications in cloud hosting (on R-Studio servers), at the moment there are four tariff plans: from free (with restrictions on the number of applications and running time of the application per month) to paid (with removed restrictions, authentication capabilities (SSL)).
1. First, the file selected by the user is opened;
2. Based on the existing load profiles, unique values are generated, the drop-down list is updated;
3. When you select a profile from the drop-down list, a new set is created and on the basis of it the charts, descriptive statistics and initial data are changed (for comparison);
4. Of course, you can make a choice of several profiles (controls allow it), analyze them on different diagrams, colorize nominal parameters with colors, save diagrams in various formats (vector and raster).
Below are some screenshots of my Shiny application for analyzing the performance of Vdbench unloading, with an individual profile selection, dynamic tuning of axes ranges, displaying some types of diagrams (rebuilt in less than a second). This is all implemented exclusively on the basic elements of Shiny , although there are options for customizing and styling the application using directly both HTML, CSS, and JavaScript and jQuery.

1 panel

2 panel

3 panel

4 panel
As a result, I can say that I figured out the basic graphical capabilities of ggplot2 and the design of the diagrams (previously, basically, I only had to build the diagrams themselves, without any special design) - really a convenient way to build different diagrams, and of course I learned Shiny . For initial exploratory analysis of resource productivity data, R is a very suitable tool, at least in terms of ease of use, speed of results, and the graphical results themselves. The additional use of Shiny (as your server or cloud server) will allow you to demonstrate the analysis results in a more convenient form, both to internal employees and Customers.
who can't read and write,
and those who cannot learn,
unlearn and relearn "
Alvin toffler
IT professionals may have tasks related to analyzing equipment performance or analyzing the results of various load generators (ioMeter, Vdbench, etc.). In most cases, Excel is used for these purposes with the construction of time series, with finding the main descriptive statistics and trying to somehow analyze it all. There is an alternative means of quicker and more convenient analysis of descriptive statistics with various diagrams and the possibility of creating a web application for general access. I will not touch on these statistics with various data analysis methods, only basic descriptive statistics (without testing tests and even p-values will not) and different charts.
In this article I will describe one of the options for analyzing such information, presenting it in the form of diagrams ( traffic! ), And all this in the form of a web application. As the name of the article suggests, this is implemented on R, with a package (framework) for web applications to R - Shiny .
Excel Restrictions
In the case when nominal variables (LUN, RAID groups, load profiles, etc.) are few - units, then using Excel is not difficult. But when their number increases and it is necessary to compare different quantitative characteristics within one variable or, especially, between different variables, then using Excel and, especially, only time series is irrational - the probability of making false prerequisites, finding something that is not there or overlooking the obvious is great. Not to mention the time spent, the effort, the abundance of sheets, dozens - hundreds of graphs on these sheets, about the sources of data that you forget the next day. Many (very illustrative) types of charts in Excel cannot be built at all; others require the use of add-ons or writing volumetric code in VBA, or with a dozen manual steps to set up charts. But even in the simple case, analysis, identification of dependencies by classical time series is not a good idea, since they primarily serve other purposes — assessing the evolution of a variable over time, decomposing the time series into components, and predicting the series. But not at all in order to place several graphs on one diagram, and even with two different axes and try to find dependencies between variables. In particular, the creator of the ggplot2 package Hadley Wickham (statistician) wrote the following in 2008 about this: “ I’m reading this and I’m not serious .”
')
Benefits R
Previously, I carried out data analysis (for personal projects) using Excel (including writing VBA code), and from time to time I heard about R, but I was skeptical, thinking that Excel is quite enough for me. When interest overwhelmed skepticism, I was pleasantly surprised at how quickly and simply it was possible to manipulate data, evaluate different models and build various diagrams with many independent variables, literally into several teams. Most operations are vectorized; therefore, operations are performed promptly and there is no need for cycles in most cases. It is also worth noting the wider world community on R, which opens up great opportunities to resolve some issues.
The sequence of performance analysis of performance data:
I. Data loading
The information is loaded using the basic read.table () function with the necessary parameters (column separator, fractional separator, row header).
Ii. Data ordering
Sometimes it is necessary to organize data, and depending on the goals, different types of data presentation (narrow - variables of one dimension are indicated in one column, but with nominal parameters in other columns, or wide - each variable in different columns) may be more convenient than another. For example, a narrow format is more convenient for building diagrams of the ggplot2 package, but there are no difficulties with a wide format. Tidyr and dplyr packages are convenient tools for converting tables to different formats and manipulating data.
Iii. Key parameters of descriptive statistics
The main parameters are the minimum (Min) and maximum (Max) value of the variable, its median (Median), its arithmetic mean (Mean), first (1st Qu.) And third (3rd Qu.) Quartile. All these parameters can be calculated by the summary () function, and using it together with the tapply () function, it is possible to obtain results separately for any observable variable with certain conditions, or for greater flexibility, you can use the function describe () ( describeBy () ) which displays more statistical information, but allows you to conveniently group the source data.
Iv. Charts
"... there is no more powerful statistical method,
than a well-chosen schedule "
J. Chambers
One of the main advantages of R is the variety of types of diagrams that he can build. Charts are an integral part of the exploratory data analysis, allow to identify patterns and trends in complex data sets. In this section, I will give nine basic conceptually different diagrams, a brief description and an example of their use. Of course, every study suggests its own assumption about variables, in which the use of specific diagrams is more revealing and it is not always necessary to use all of them, but in some cases this set will not be enough (more than 1,000 diagrams in R in different packages in general) . Many diagrams have very flexible parameters that allow you to customize the result of the diagram in the desired form, as well as in the design (axes, axis labels, name, colors).
1. Time series
All the usual time series, is a series of data in which measurements of indicators are repeated at certain intervals of time. As mentioned above, these graphs are good for visual assessment of one of the studied variables and its development over time. But in the general case, in addition to visual analysis, such diagrams are intended for decomposition of a series into components, and possible further forecasting of the development of a trend. If there is no time reference, when comparing different variables, it is better to use the diagrams below, thereby eliminating one of the dimensions — time (in the case of using time, use time as a nominal variable — color it or use panel diagrams).
2. Scatter plots (scatterplots)
These diagrams are graphs in which points are used to display the values of some quantitative variables, which can additionally be divided into groups according to the levels of some nominal (or quantitative) variables (these groups are defined by color and / or size). In this example, delays (ms) and performance (IOps) are shown for all measurements of different profiles, divided into groups (cache size is encrypted at the point size, and RAID type is encrypted with colors). Thus, in this diagram 4 different variables are displayed at once:
3. Panel (categorized) graphics
The analyzed data is divided into separate categories and for each of them a separate diagram (panel) of a certain type is built. All these diagrams are then combined in one figure (vertically, horizontally, by a grid), which greatly facilitates the identification of statistical patterns and structures in the data. In this diagram, example 2 is used, it is clear that the data layer by RAID groups was transferred to two separate panels (left and right), but now the cache size is used as a grouping parameter (it is painted in color). And now it is additionally possible to add one group (additional variable) - the size of a point, thereby increasing the number of independent variables to five, on a single diagram, without losing visibility.
4. Histogram (density) distribution
The histogram (density - smoothing histogram curve (line of bars)) allows you to visualize the distribution of the values of the analyzed variable, also combining variables in one diagram that can be further divided into groups according to the levels of some nominal (or quantitative) variables, allows you to compare the frequency of occurrence . In this example, for example, a single density distribution of performance (IOps) is shown depending on the type of RAID created.
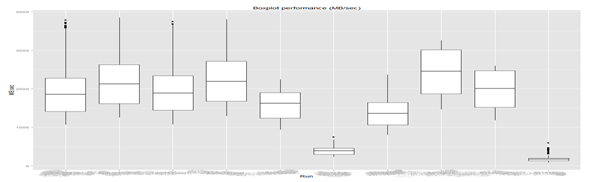
5. Span diagrams (boxsplot, “mustache box”)
This diagram is suitable for reflecting the basic robust (stable) characteristics of the sample; this function also allows you to display several boxplots simultaneously, which allows you to quickly and efficiently evaluate descriptive statistics for different factor variables. In this example, for example, statistics of performance distribution (MB / s) for different load profiles are shown (in fact, this is analogous to the summary ( ) function conclusions, but in graphical form, and with added emissions, which is more significant):
6. Matrix graph (pair scatterplots)
This graph is a family of point diagrams (p.2), reflecting in pairs the dependence of the values of each variable on each other variable. In this example, pairwise dependencies of all 5 variables are shown, it is also possible to add another 6 variables, by coloring one of the factors in color.
7. Graph of parallel coordinates
This graph allows you to compare a significant number of independent variables for each nominal value, and show the pairwise relationship between them, and color in color one of the nominal variables. Despite the unusual appearance, in many cases, these diagrams can help to quickly classify a set of multidimensional data. So, in this example, the diagram shows that one load profile (orange) with high input-output operations does not entail an increase in load, and some (blue) vice versa; some of the profiles (green) stably show a high delay, it is also clear that some profiles fall into the same place on each sign, you can see where (small or large values) many signs are shifted, etc.
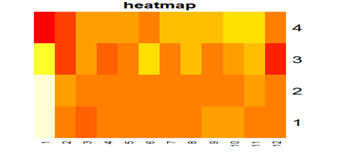
8. Heatmap
This chart displays the value of a particular variable in its own color, this chart will be useful for displaying any characteristics in relation to the actual physical placement of equipment components. For example, display more “hot” (in performance, in time, in access frequency, etc.) disks in the shelves (as in this example: horizontal - slot numbers, vertical - shelf numbers), or display more hot RAID groups or pools associated with their physical disks in the array.
9. Pictograms (stars, Chernov faces)
Also, different pictograms (stars, Chernov faces) can be used for analyzing aggregated multidimensional data.
The idea of such diagrams is that people clearly distinguish objects, in this case, faces (and not a set of tens of values from 10–20 digits). In the above example, each person corresponds to one load profile, which in the aggregated (median) form reflects the characteristics of feature values (performance (two types), delays (three types)). A quick glance at this chart will allow you to quickly determine whether the profile characteristics differ significantly (coincide), with a detailed overview (features) it will be clear in which signs (each facial feature is a separate feature of the original dataset) the similarity and what the difference is.
V. Dynamic Management (Shiny)
All the code for loading data, converting data and displaying diagrams is written in R-Studio , a convenient graphical shell to R, which is quite enough for getting quick results and writing reports. But a situation may arise in a flexible, dynamic means of setting up results (selection of axes, diagrams, scaling, saving results into graphic files and much more), and / or in the case of demonstration of results to a wide range of colleagues, customer, partners. In this case, it is quite convenient to bind the existing code (or immediately write a new one) to the I / O elements of the web application using the Shiny package. Shiny is a package (framework) for rapid development of web applications. I stumbled upon it completely by accident, and my surprise at using R was also transferred to it: several types of basic I / O elements, convenient binding of the computation code to I / O elements, dynamic change of input elements, reactive variables and functions — everything turned out much easier than i thought. A great solution for hiding the code and showing only the "twirling twigs" and pictures.
Vi. Distribution of results
Both in the case of using Shiny , and without it, the entire code R is in text files with the extension R. The only difference in the case of Shiny is two such files - ui.R (description of the input-output elements) and server.R (all calculations ) (although you can do Shiny applications in one file, but for me it’s more convenient to leave two). Therefore, the distribution of results is as follows:
For R users:
1. Direct distribution of R files (separately or in archive)
2. Placing R files using Github. To get the files, in R it is enough to execute one command and the files will be loaded locally, and it becomes possible to start them.
For everyone (in these cases, there is no need to have an installed R, Shiny is launched from the browser):
1) placing Shiny applications on your local Shiny server (there are two options - free and paid (with authentication and SSL));
2) placing Shiny applications in cloud hosting (on R-Studio servers), at the moment there are four tariff plans: from free (with restrictions on the number of applications and running time of the application per month) to paid (with removed restrictions, authentication capabilities (SSL)).
Briefly about the implementation and results
1. First, the file selected by the user is opened;
2. Based on the existing load profiles, unique values are generated, the drop-down list is updated;
3. When you select a profile from the drop-down list, a new set is created and on the basis of it the charts, descriptive statistics and initial data are changed (for comparison);
4. Of course, you can make a choice of several profiles (controls allow it), analyze them on different diagrams, colorize nominal parameters with colors, save diagrams in various formats (vector and raster).
Below are some screenshots of my Shiny application for analyzing the performance of Vdbench unloading, with an individual profile selection, dynamic tuning of axes ranges, displaying some types of diagrams (rebuilt in less than a second). This is all implemented exclusively on the basic elements of Shiny , although there are options for customizing and styling the application using directly both HTML, CSS, and JavaScript and jQuery.
1 panel
2 panel
3 panel
4 panel
Conclusion
As a result, I can say that I figured out the basic graphical capabilities of ggplot2 and the design of the diagrams (previously, basically, I only had to build the diagrams themselves, without any special design) - really a convenient way to build different diagrams, and of course I learned Shiny . For initial exploratory analysis of resource productivity data, R is a very suitable tool, at least in terms of ease of use, speed of results, and the graphical results themselves. The additional use of Shiny (as your server or cloud server) will allow you to demonstrate the analysis results in a more convenient form, both to internal employees and Customers.
Source: https://habr.com/ru/post/253419/
All Articles