Finding relationships using the Oil Ruble example
One of the basic tasks of data analysis is the search for the relationship of two quantities. Here I want to give an example of finding a connection between the price of oil and the ruble exchange rate.
First of all, it is necessary to determine whether the task makes sense at all. Why oil and ruble should / can be interconnected? In short, the model is as follows: exporters sell oil for dollars, and then sell dollars to get rubles for settlements within the country. The mechanism is extremely simplified, it is necessary to take into account the volume of production and sales, that not only oil is escorted, exporters do not always sell dollars, the Central Bank intervenes in the exchange rate, etc. Nevertheless, we will assume that the model is more or less working, that is, that there are fundamental reasons for the relationship between the price of oil and the ruble exchange rate.
What we need. Data - we take the daily measured oil price (Brent grade) in dollars and the ruble rate against the dollar, data can be freely obtained on the website finam.ru , the sampling period is from the beginning of last year. Toolkit - we need to build a lot of graphs in order to visually evaluate how the model works and a fairly simple apparatus for constructing regressions. All these features are in Gnuplot, looking ahead - the script for drawing graphs and calculating regressions takes no more than 40 lines of code. All working scripts link will be given below.
')
Let's look at the joint time dynamics of the price of oil and the ruble rate:
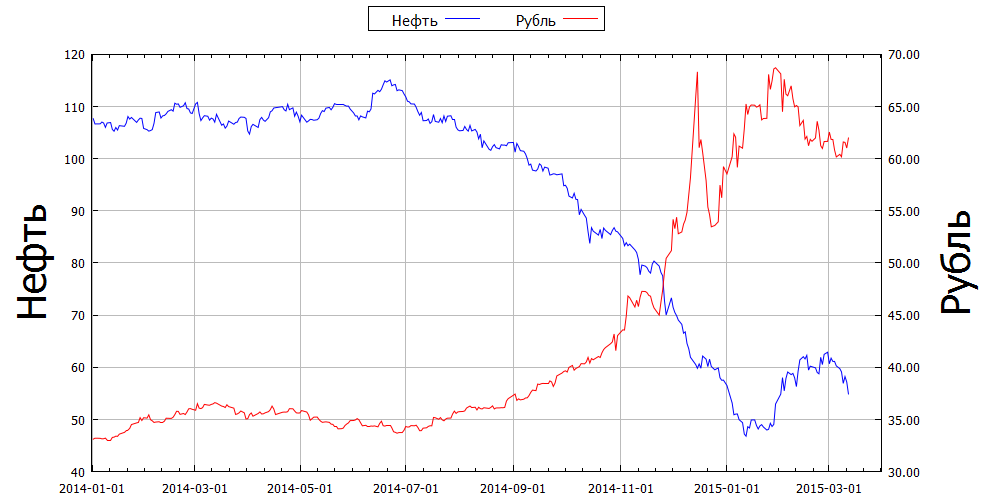
Oil down, the ruble - up. There is some kind of relationship, but the impression is that something is missing ... Aha! We compare the values of "Oil for dollars" and "dollar for rubles," that is, the dimensions do not coincide with a banal dimension. Take the ruble exchange rate in the form of “Ruble / dollar” and redraw the picture:
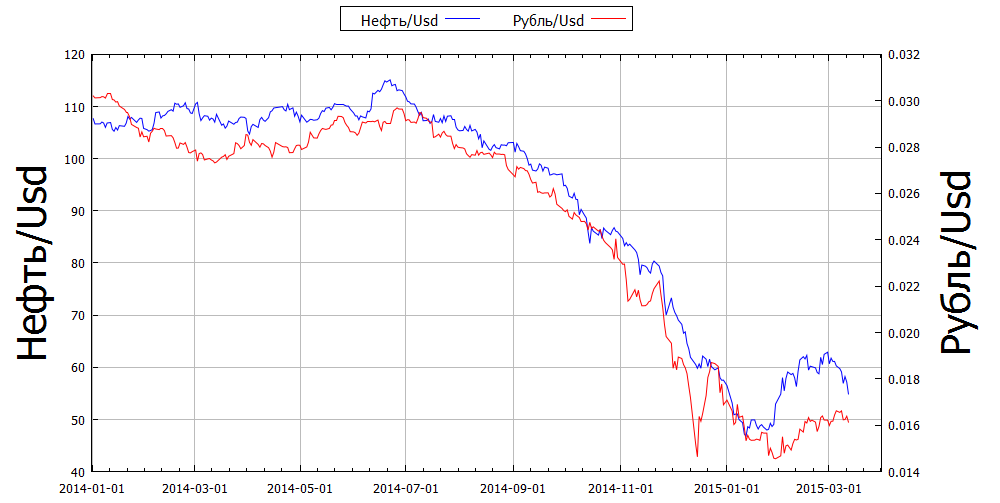
Here the correlation is already obvious. We are on the right track, we continue.
We construct a set of points (Oil / Usd, Ruble / Usd) and draw two regression lines, Y1 - linear, Y2 - quadratic, both lines have a high coefficient of determination, that is, the relationship between the price of oil and the ruble is quite close.
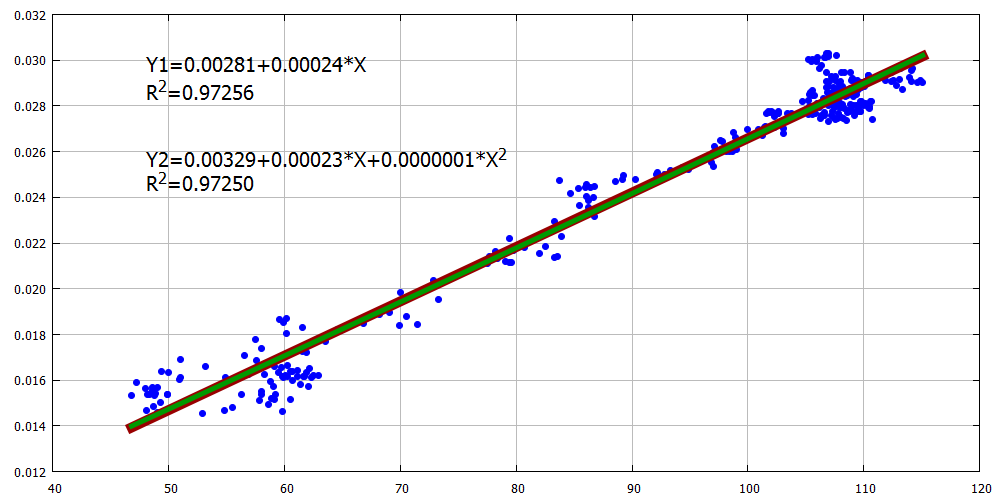
The regression lines are almost the same. We will choose linear, firstly it is simpler and has fewer parameters, which is very important, including from the point of view of the Occam principle, and secondly, it has a slightly larger coefficient R2, that is, it is formally better, a little, but better.
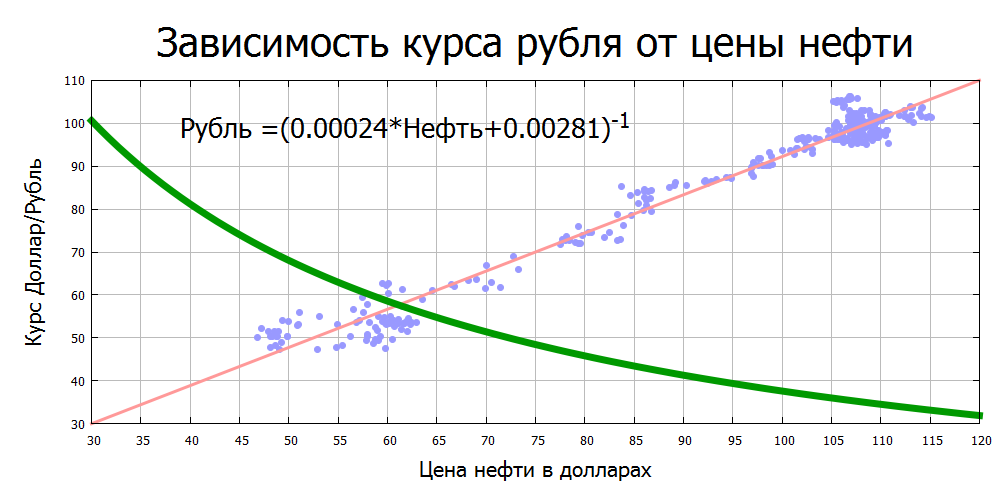
We will reorganize the ruble exchange rate from the price of oil in the usual format, that is, as we see these figures in the news, on websites, on tablets near banks. At the same time, for clarity, we will leave on the chart all our constructions, just make them paler.

Summary. The ruble exchange rate is rather closely related to the price of oil, the dependence is linear (for the Rub / Usd rate), the coefficient of determination is ~ 0.97.
Ps. All data, scripts and files for building images in Gnuplot can be downloaded at the link: drive.google.com/file/d/0BwHQSqFOG-7ldjk0SHZ4M1RxRGc/view?usp=sharing
Pps
Update. The formula corrected a typo (this did not affect the graphics themselves). Thanks to Alexey Kuzmin (@ alexeykuzmin0) for the remark.
First of all, it is necessary to determine whether the task makes sense at all. Why oil and ruble should / can be interconnected? In short, the model is as follows: exporters sell oil for dollars, and then sell dollars to get rubles for settlements within the country. The mechanism is extremely simplified, it is necessary to take into account the volume of production and sales, that not only oil is escorted, exporters do not always sell dollars, the Central Bank intervenes in the exchange rate, etc. Nevertheless, we will assume that the model is more or less working, that is, that there are fundamental reasons for the relationship between the price of oil and the ruble exchange rate.
What we need. Data - we take the daily measured oil price (Brent grade) in dollars and the ruble rate against the dollar, data can be freely obtained on the website finam.ru , the sampling period is from the beginning of last year. Toolkit - we need to build a lot of graphs in order to visually evaluate how the model works and a fairly simple apparatus for constructing regressions. All these features are in Gnuplot, looking ahead - the script for drawing graphs and calculating regressions takes no more than 40 lines of code. All working scripts link will be given below.
')
Let's look at the joint time dynamics of the price of oil and the ruble rate:
Oil down, the ruble - up. There is some kind of relationship, but the impression is that something is missing ... Aha! We compare the values of "Oil for dollars" and "dollar for rubles," that is, the dimensions do not coincide with a banal dimension. Take the ruble exchange rate in the form of “Ruble / dollar” and redraw the picture:
Here the correlation is already obvious. We are on the right track, we continue.
We construct a set of points (Oil / Usd, Ruble / Usd) and draw two regression lines, Y1 - linear, Y2 - quadratic, both lines have a high coefficient of determination, that is, the relationship between the price of oil and the ruble is quite close.
The regression lines are almost the same. We will choose linear, firstly it is simpler and has fewer parameters, which is very important, including from the point of view of the Occam principle, and secondly, it has a slightly larger coefficient R2, that is, it is formally better, a little, but better.
We will reorganize the ruble exchange rate from the price of oil in the usual format, that is, as we see these figures in the news, on websites, on tablets near banks. At the same time, for clarity, we will leave on the chart all our constructions, just make them paler.
Summary. The ruble exchange rate is rather closely related to the price of oil, the dependence is linear (for the Rub / Usd rate), the coefficient of determination is ~ 0.97.
Ps. All data, scripts and files for building images in Gnuplot can be downloaded at the link: drive.google.com/file/d/0BwHQSqFOG-7ldjk0SHZ4M1RxRGc/view?usp=sharing
Pps
Update. The formula corrected a typo (this did not affect the graphics themselves). Thanks to Alexey Kuzmin (@ alexeykuzmin0) for the remark.
Source: https://habr.com/ru/post/253285/
All Articles