Convenient monitoring of Syslog messages from network glands in Zabbix
An integral part of network monitoring is the collection of logs from monitored servers and other hardware. After all, no matter how much we create individual data elements and triggers for them, at some point a situation will arise that we have lost sight of something important and are not in control. Bottom line: “Nothing works for us,” and the monitoring system says that everything is fine.
Therefore, the first thing I wanted to do was to collect all the logs in the zabbiks, grouping them by the network node so that you can always run through the eyes, without wasting time accessing the equipment.
The second is to pay attention to those events that you are not aware of.
How to do this on servers or computers where a zabbiks-agent is installed, many people know - there are built-in data elements log [], logrt [] .
')
But what to do when you need to collect logs from network equipment, which you can’t put Zabbix-agent to? In general, you can, of course, configure a syslog server on the same PC that has a zabbiks agent, and then use log [] to transfer these data to zabbiks. Only data elements and triggers on it will be attached to a network node with a zabbiks agent, which is intuitively obscure . Is it possible to attach this data directly to a network device? Can.
To do this, we need zabbix_sender , Zabbix API and rsyslog on a machine with a zabbix server or a zabbix proxy. As a bonus, we also get a quick context switch to the syslog message log from the network map.
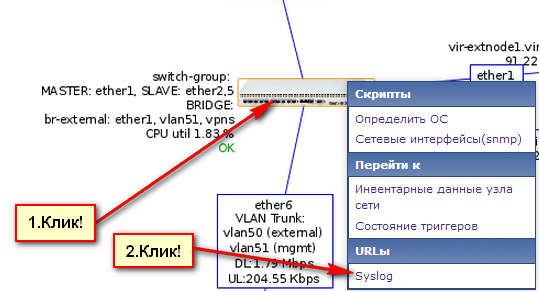
What will the result look like? Well, something like this:
Context call:
In large strokes, the solution architecture looks like this:

1. All logs from network devices fall on the server with Zabbix server or proxy, on which rsyslog is located in combination.
2. rsyslog run a script that determines (3) from which host in Zabbiks a message has come
4. The message goes to zabbix through the utility zabbix_sender
Well, let's start to “cut through” the path to the message from the network piece of iron to zabbiks
It's simple. Specify a machine with a Zabbix server or Zabbix-proxy as a destination for syslog messages. Configure the equipment to send messages of any severity and facility.
On some D-Link, it might look something like this:
And let's say on a Cisco router like this:
Customized? Go ahead.
Let's start with the simplest and most understandable. In Zabbix we will create a Template_Syslog template and add one single data item in it:

Fill in the fields as follows:
Next, we attach this template to all hosts from which we will collect syslog messages. It is important to specify in the interfaces those IP-addresses from which logs will come to Zabbiks. Otherwise, it is simply not possible to identify the source of the message.

Set up a syslog server on a host with a Zabbix server. In our case, this is a common rsyslog, which comes in many Linux distributions. If you have syslog-ng, then everything can be done in almost the same way.
In the simplest case, the syslog server decomposes received messages on files depending on the facility and severity of messages. However, there are other possibilities. For example, in rsyslog it is possible to run an arbitrary script for each message. We will use this function.
The second question that needs to be addressed is the identification of the equipment in order to determine which node in the log the message should be added to Zabbiks. We will solve it by adding the source ip-address in square brackets to the line with the message itself.
For all this, create the /etc/rsyslog.d/zabbix_rsyslog.conf config file.
We have just created a setting for rsyslog, which will format all messages not received from the local host and run our /usr/local/bin/zabbix_syslog_lkp_host.pl script with an syslog message as an argument.
At the same time, in the #exclude unwanted messages section, we can discard messages that litter login, if they are known in advance. A couple of messages are left here as an example.
At the end of the rsyslog configuration, don't forget to uncomment the following lines in the /etc/rsyslog.conf file to receive syslog messages over the network via UDP:
And yet, what does the /usr/local/bin/zabbix_syslog_lkp_host.pl script do that we have specified to run rsyslog? In short, it simply sends this message via zabbix_sender to Zabbix_server or to Zabbix_proxy, well, something like this:
EDITED : But in fact, it is not necessary to run the standard zabbix_sender utility. Its functionality can be implemented inside the script itself, so as not to jerk every time / usr / bin / zabbix_sender and optimize the process. Thanks for the important addition mcleod095 !
But how does the script know what the * NAME OF THE * (i.e. to which node the message should be attached), because only the IP address from which the message came is known?
For this we will use Zabbix API, it is through him that we will be able to find * NAME * by IP address.
Copy the script to the server on the path /usr/local/bin/zabbix_syslog_lkp_host.pl, also create a configuration file
/usr/local/etc/zabbix_syslog.cfg with parameters for connecting to Zabbiks via API. The config will look something like this:
The script uses several Perl modules from CPAN. To install them, run the following commands:
We also set up the rights to these our new files:
Everything is ready to send messages to Zabbiks, it remains only to restart rsyslog:
From this point on, we can already see messages in zabbiks separately for each node of the network, opening the Latest data -> the desired network node -> Syslog

The ability to read logs in the system without going through the interfaces of the equipment is good (not to mention the fact that, as a rule, the logs on the equipment are in memory and do not survive the reboot), but let's not forget about the triggers. As in the case of other protocols, they will help us not to oversleep any fateful message on our network.
Each equipment and each equipment manufacturer has its own messages, so how to search for an important message without knowing what it looks like? But as follows:
All syslog messages are classified using the severity attribute, which according to RFC5424 can have the following values:
severity has not only numerical, but also a text abbreviation, which is present in the final message, which is transmitted to Zabbix via zabbix_sender.
Thus, we can search for those messages that the piece of hardware itself (that is, its manufacturer) assigned a sufficiently high importance, and notify about them. To do this, add triggers to our Template_Syslog template to notify about all events with severity = warning and above:

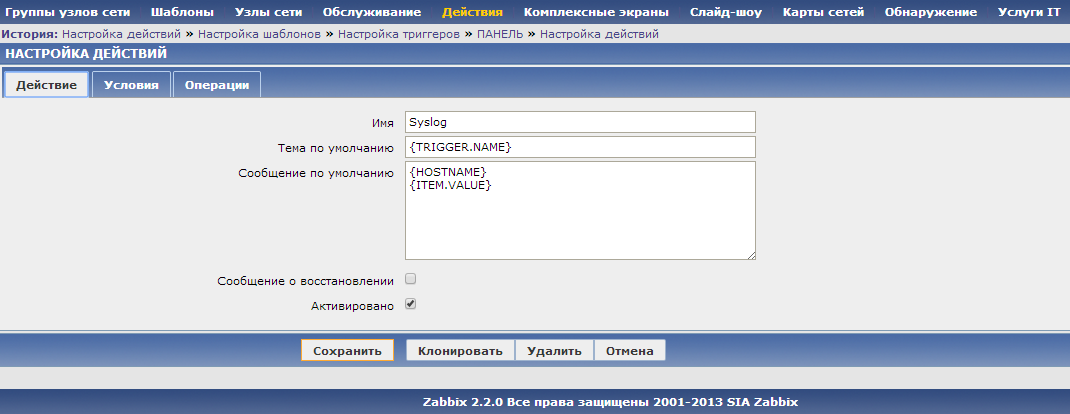
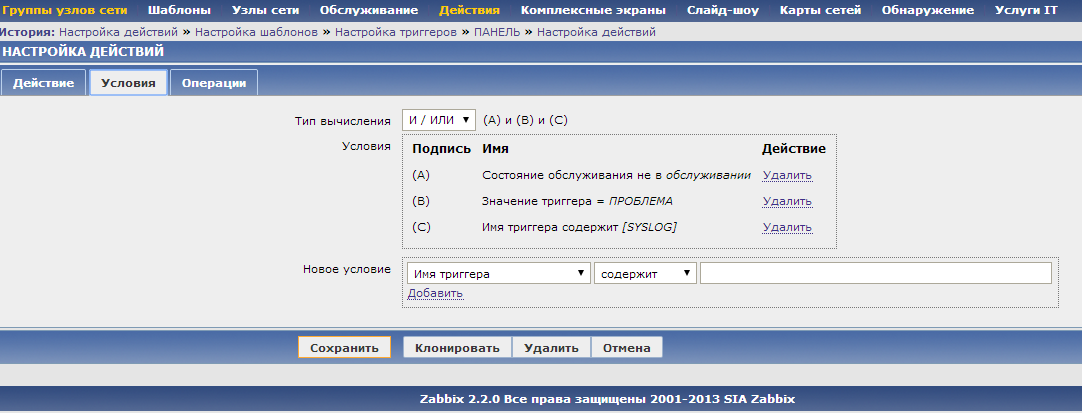
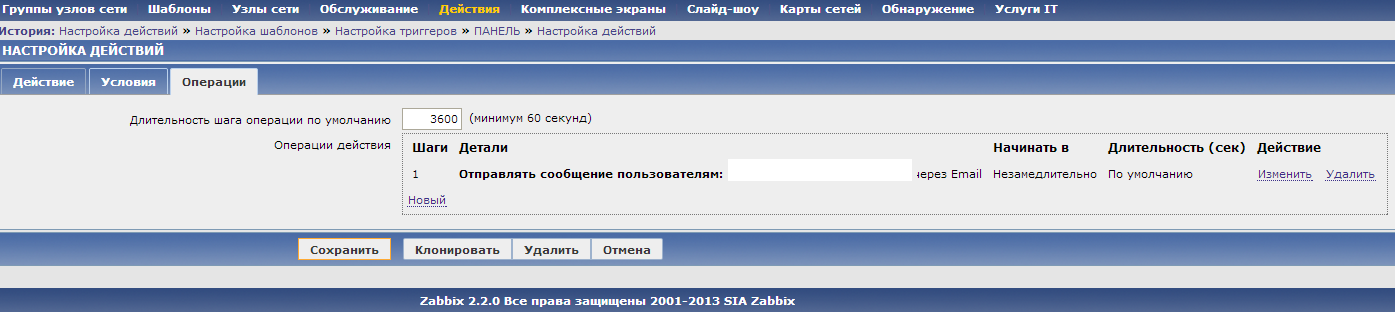
The last thing left to do is set up an alert (action) about these new syslog messages. Under the conditions, we indicate that the trigger name contains [SYSLOG], and that the message must be sent via email.
As a result, every time a message of high importance drops in syslog, we will receive a message of the form:

And by the way, our pattern with crash triggers is already ready:
Of course, it is not necessary to catch all messages warning, error, critical and so on. This is just a generic version that helps not to miss something abnormal. Using the trigger functions iregxp (), regxp (), str () , you can always record more specific events in the logs.
Let's touch on another important point that simplifies working with syslog messages - contextual transition from the network map.

You can spend a day or two and suffer the addition of URL links for each host to its syslog item with your hands:

But rather the hands wither by clicking on the mouse, or the mind will touch. It is better to turn again to Zabbix API for help in automating this routine work:
To do this, we assign a script that will be
1) Take all the elements of the network map
2) For all elements of the node type, check whether it has a data element with key = syslog
3) If so, add a link to the list of existing URLs to view this data item (if there is already a URL to Syslog, then do nothing)
When the script is ready, we will deploy it only on Zabbix-server:
And we will immediately add the script to cron (best of all under the zabbix user) on the machine with Zabbix Server, once a day it may be enough.
Also do not forget to make the file executable:
Done!
Zabbiks knows a lot out of the box. However, if there is not what you need - to despair early. Zabbix API, as well as zabbix_sender, plug-ins , UserParameter - all these tools to your services to expand the capabilities of the system.
Therefore, the first thing I wanted to do was to collect all the logs in the zabbiks, grouping them by the network node so that you can always run through the eyes, without wasting time accessing the equipment.
The second is to pay attention to those events that you are not aware of.
How to do this on servers or computers where a zabbiks-agent is installed, many people know - there are built-in data elements log [], logrt [] .
')
But what to do when you need to collect logs from network equipment, which you can’t put Zabbix-agent to? In general, you can, of course, configure a syslog server on the same PC that has a zabbiks agent, and then use log [] to transfer these data to zabbiks. Only data elements and triggers on it will be attached to a network node with a zabbiks agent, which is intuitively obscure . Is it possible to attach this data directly to a network device? Can.
To do this, we need zabbix_sender , Zabbix API and rsyslog on a machine with a zabbix server or a zabbix proxy. As a bonus, we also get a quick context switch to the syslog message log from the network map.
What will the result look like? Well, something like this:
Context call:
How to
In large strokes, the solution architecture looks like this:
1. All logs from network devices fall on the server with Zabbix server or proxy, on which rsyslog is located in combination.
2. rsyslog run a script that determines (3) from which host in Zabbiks a message has come
4. The message goes to zabbix through the utility zabbix_sender
Well, let's start to “cut through” the path to the message from the network piece of iron to zabbiks
On network equipment
It's simple. Specify a machine with a Zabbix server or Zabbix-proxy as a destination for syslog messages. Configure the equipment to send messages of any severity and facility.
On some D-Link, it might look something like this:
enable syslog create syslog host 1 ipaddress 10.2.0.21 severity debug state enable And let's say on a Cisco router like this:
cisco1# cisco1#config terminal Enter configuration commands, one per line. End with CNTL/Z. cisco1(config)#logging 10.2.0.21 cisco1(config)#service timestamps debug datetime localtime show-timezone msec cisco1(config)#service timestamps log datetime localtime show-timezone msec cisco1(config)#logging facility local3 cisco1(config)#logging trap informational cisco1(config)#end Customized? Go ahead.
In the web interface of Zabbiks
Let's start with the simplest and most understandable. In Zabbix we will create a Template_Syslog template and add one single data item in it:
Fill in the fields as follows:
| Field | Value | Note |
|---|---|---|
| Name | Syslog | |
| Type of | Zabbix trapper | |
| Key | syslog | It is important that there is such a name (for further correct operation of the Zabbix API) |
| Type of Information | Log (log) | |
| The format of the time in the log (log) | yyyyxMMxddxhhxmmxssxxxxxx | Mask to correctly determine the date by format in RFC5424 |
Next, we attach this template to all hosts from which we will collect syslog messages. It is important to specify in the interfaces those IP-addresses from which logs will come to Zabbiks. Otherwise, it is simply not possible to identify the source of the message.
Syslog server
Set up a syslog server on a host with a Zabbix server. In our case, this is a common rsyslog, which comes in many Linux distributions. If you have syslog-ng, then everything can be done in almost the same way.
In the simplest case, the syslog server decomposes received messages on files depending on the facility and severity of messages. However, there are other possibilities. For example, in rsyslog it is possible to run an arbitrary script for each message. We will use this function.
The second question that needs to be addressed is the identification of the equipment in order to determine which node in the log the message should be added to Zabbiks. We will solve it by adding the source ip-address in square brackets to the line with the message itself.
For all this, create the /etc/rsyslog.d/zabbix_rsyslog.conf config file.
#add template for network devices $template network-fmt,"%TIMESTAMP:::date-rfc3339% [%fromhost-ip%] %pri-text% %syslogtag%%msg%\n" #exclude unwanted messages: :msg, contains, "Child connection from ::ffff:10.2.0.21" ~ :msg, contains, "exit after auth (ubnt): Disconnect received" ~ :msg, contains, "password auth succeeded for 'ubnt' from ::ffff:10.2.0.21" ~ :msg, contains, "exit before auth: Exited normally" ~ #action for every message: if $fromhost-ip != '127.0.0.1' then ^/usr/local/bin/zabbix_syslog_lkp_host.pl;network-fmt & ~ We have just created a setting for rsyslog, which will format all messages not received from the local host and run our /usr/local/bin/zabbix_syslog_lkp_host.pl script with an syslog message as an argument.
At the same time, in the #exclude unwanted messages section, we can discard messages that litter login, if they are known in advance. A couple of messages are left here as an example.
At the end of the rsyslog configuration, don't forget to uncomment the following lines in the /etc/rsyslog.conf file to receive syslog messages over the network via UDP:
$ModLoad imudp $UDPServerRun 514 And yet, what does the /usr/local/bin/zabbix_syslog_lkp_host.pl script do that we have specified to run rsyslog? In short, it simply sends this message via zabbix_sender to Zabbix_server or to Zabbix_proxy, well, something like this:
/usr/bin/zabbix_sender -z ** -k syslog -o *SYSLOG-* -s ** EDITED : But in fact, it is not necessary to run the standard zabbix_sender utility. Its functionality can be implemented inside the script itself, so as not to jerk every time / usr / bin / zabbix_sender and optimize the process. Thanks for the important addition mcleod095 !
But how does the script know what the * NAME OF THE * (i.e. to which node the message should be attached), because only the IP address from which the message came is known?
For this we will use Zabbix API, it is through him that we will be able to find * NAME * by IP address.
/usr/local/bin/zabbix_syslog_lkp_host.pl
#!/usr/bin/perl use 5.010; use strict; use warnings; use JSON::RPC::Legacy::Client; use Data::Dumper; use Config::General; use CHI; use List::MoreUtils qw (any); use English '-no_match_vars'; use Readonly; use MIME::Base64 qw(encode_base64); use IO::Socket::INET; our $VERSION = 2.0; Readonly my $CACHE_TIMEOUT => 600; Readonly my $CACHE_DIR => '/tmp/zabbix_syslog_cache'; my $conf = Config::General->new('/usr/local/etc/zabbix_syslog.cfg'); my %Config = $conf->getall; #Authenticate yourself my $client = JSON::RPC::Legacy::Client->new(); my $url = $Config{'url'} || die "URL is missing in zabbix_syslog.cfg\n"; my $user = $Config{'user'} || die "API user is missing in zabbix_syslog.cfg\n"; my $password = $Config{'password'} || die "API user password is missing in zabbix_syslog.cfg\n"; my $server = $Config{'server'} || die "server hostname is missing in zabbix_syslog.cfg\n"; my $debug = $Config{'debug'}; my ( $authID, $response, $json ); my $id = 0; my $message = shift @ARGV || die "Syslog message required as an argument\n"; #Grab syslog message from rsyslog #get ip from message my $ip; #IP regex patter part my $ipv4_octet = q/(?:25[0-5]|2[0-4][0-9]|[01]?[0-9][0-9]?)/; if ( $message =~ / \[ ((?:$ipv4_octet[.]){3}${ipv4_octet}) \]/msx ) { $ip = $1; } else { die "No IP in square brackets found in '$message', cannot continue\n"; } my $cache = CHI->new( driver => 'File', root_dir => $CACHE_DIR, ); my $hostname = $cache->get($ip); if ( !defined $hostname ) { $authID = login(); my @hosts_found; my $hostid; foreach my $host ( hostinterface_get() ) { $hostid = $host->{'hostid'}; if ( any { /$hostid/msx } @hosts_found ) { next; } #check if $hostid already is in array then skip(next) else { push @hosts_found, $hostid; } ###########now get hostname if ( get_zbx_trapper_syslogid_by_hostid($hostid) ) { my $result = host_get($hostid); #return hostname if possible if ( $result->{'host'} ) { if ( $result->{'proxy_hostid'} == 0 ) #check if host monitored directly or via proxy { #lease $server as is } else { #assume that rsyslogd and zabbix_proxy are on the same server $server = 'localhost'; } $hostname = $result->{'host'}; } } } logout(); $cache->set( $ip, $hostname, $CACHE_TIMEOUT ); } zabbix_send( $server, $hostname, 'syslog', $message ); #______SUBS sub login { $json = { jsonrpc => '2.0', method => 'user.login', params => { user => $user, password => $password }, id => $id++, }; $response = $client->call( $url, $json ); # Check if response was successful die "Authentication failed\n" unless $response->content->{'result'}; if ( $debug > 0 ) { print Dumper $response->content->{'result'}; } return $response->content->{'result'}; } sub logout { $json = { jsonrpc => '2.0', method => 'user.logout', params => {}, id => $id++, auth => $authID, }; $response = $client->call( $url, $json ); # Check if response was successful warn "Logout failed\n" unless $response->content->{'result'}; return; } sub hostinterface_get { $json = { jsonrpc => '2.0', method => 'hostinterface.get', params => { output => [ 'ip', 'hostid' ], filter => { ip => $ip, }, # limit => 1, }, id => $id++, auth => $authID, }; $response = $client->call( $url, $json ); if ( $debug > 0 ) { print Dumper $response; } # Check if response was successful (not empty array in result) if ( !@{ $response->content->{'result'} } ) { logout(); die "hostinterface.get failed\n"; } return @{ $response->content->{'result'} } } sub get_zbx_trapper_syslogid_by_hostid { my $hostids = shift; $json = { jsonrpc => '2.0', method => 'item.get', params => { output => ['itemid'], hostids => $hostids, search => { 'key_' => 'syslog', type => 2, #type => 2 is zabbix_trapper status => 0, }, limit => 1, }, id => $id++, auth => $authID, }; $response = $client->call( $url, $json ); if ( $debug > 0 ) { print Dumper $response; } # Check if response was successful if ( !@{ $response->content->{'result'} } ) { logout(); die "item.get failed\n"; } #return itemid of syslog key (trapper type) return ${ $response->content->{'result'} }[0]->{itemid}; } sub host_get { my $hostids = shift; $json = { jsonrpc => '2.0', method => 'host.get', params => { hostids => [$hostids], output => [ 'host', 'proxy_hostid', 'status' ], filter => { status => 0, }, # only use hosts enabled limit => 1, }, id => $id++, auth => $authID, }; $response = $client->call( $url, $json ); if ( $debug > 0 ) { print Dumper $response; } # Check if response was successful if ( !$response->content->{'result'} ) { logout(); die "host.get failed\n"; } return ${ $response->content->{'result'} }[0]; #return result } sub zabbix_send { my $zabbixserver = shift; my $hostname = shift; my $item = shift; my $data = shift; Readonly my $SOCK_TIMEOUT => 10; Readonly my $SOCK_RECV_LENGTH => 1024; my $result; my $request = sprintf "<req>\n<host>%s</host>\n<key>%s</key>\n<data>%s</data>\n</req>\n", encode_base64($hostname), encode_base64($item), encode_base64($data); my $sock = IO::Socket::INET->new( PeerAddr => $zabbixserver, PeerPort => '10051', Proto => 'tcp', Timeout => $SOCK_TIMEOUT ); die "Could not create socket: $ERRNO\n" unless $sock; $sock->send($request); my @handles = IO::Select->new($sock)->can_read($SOCK_TIMEOUT); if ( $debug > 0 ) { print "item - $item, data - $data\n"; } if ( scalar(@handles) > 0 ) { $sock->recv( $result, $SOCK_RECV_LENGTH ); if ( $debug > 0 ) { print "answer from zabbix server $zabbixserver: $result\n"; } } else { if ( $debug > 0 ) { print "no answer from zabbix server\n"; } } $sock->close(); return; } Copy the script to the server on the path /usr/local/bin/zabbix_syslog_lkp_host.pl, also create a configuration file
/usr/local/etc/zabbix_syslog.cfg with parameters for connecting to Zabbiks via API. The config will look something like this:
url = http://zabbix.local/zabbix/api_jsonrpc.php user = api_user password = password server = zabbix.local debug=0 The script uses several Perl modules from CPAN. To install them, run the following commands:
PERL_MM_USE_DEFAULT=1 perl -MCPAN -e 'install Readonly' PERL_MM_USE_DEFAULT=1 perl -MCPAN -e 'install CHI' PERL_MM_USE_DEFAULT=1 perl -MCPAN -e 'install JSON::RPC::Legacy::Client' PERL_MM_USE_DEFAULT=1 perl -MCPAN -e 'install Config::General' We also set up the rights to these our new files:
chmod +x /usr/local/bin/zabbix_syslog_lkp_host.pl chown zabbix:zabbix /usr/local/etc/zabbix_syslog.cfg chmod 700 /usr/local/etc/zabbix_syslog.cfg Everything is ready to send messages to Zabbiks, it remains only to restart rsyslog:
service rsyslog restart From this point on, we can already see messages in zabbiks separately for each node of the network, opening the Latest data -> the desired network node -> Syslog
Triggers
The ability to read logs in the system without going through the interfaces of the equipment is good (not to mention the fact that, as a rule, the logs on the equipment are in memory and do not survive the reboot), but let's not forget about the triggers. As in the case of other protocols, they will help us not to oversleep any fateful message on our network.
Each equipment and each equipment manufacturer has its own messages, so how to search for an important message without knowing what it looks like? But as follows:
All syslog messages are classified using the severity attribute, which according to RFC5424 can have the following values:
| 0 Emergency: system is unusable 1 Alert: action must be taken immediately 2 Critical: critical conditions 3 Error: error conditions 4 Warning: warning conditions 5 Notice: normal but significant condition 6 Informational: informational messages 7 Debug: debug-level messages |
severity has not only numerical, but also a text abbreviation, which is present in the final message, which is transmitted to Zabbix via zabbix_sender.
Thus, we can search for those messages that the piece of hardware itself (that is, its manufacturer) assigned a sufficiently high importance, and notify about them. To do this, add triggers to our Template_Syslog template to notify about all events with severity = warning and above:
The last thing left to do is set up an alert (action) about these new syslog messages. Under the conditions, we indicate that the trigger name contains [SYSLOG], and that the message must be sent via email.
As a result, every time a message of high importance drops in syslog, we will receive a message of the form:
And by the way, our pattern with crash triggers is already ready:
Template_Syslog
<?xml version="1.0" encoding="UTF-8"?> <zabbix_export> <version>2.0</version> <date>2015-03-13T14:27:56Z</date> <groups> <group> <name>Templates</name> </group> </groups> <templates> <template> <template>Template_Syslog</template> <name>Template_Syslog</name> <description/> <groups> <group> <name>Templates</name> </group> </groups> <applications> <application> <name>Log</name> </application> </applications> <items> <item> <name>Syslog</name> <type>2</type> <snmp_community/> <multiplier>0</multiplier> <snmp_oid/> <key>syslog</key> <delay>0</delay> <history>3</history> <trends>365</trends> <status>0</status> <value_type>2</value_type> <allowed_hosts/> <units/> <delta>0</delta> <snmpv3_contextname/> <snmpv3_securityname/> <snmpv3_securitylevel>0</snmpv3_securitylevel> <snmpv3_authprotocol>0</snmpv3_authprotocol> <snmpv3_authpassphrase/> <snmpv3_privprotocol>0</snmpv3_privprotocol> <snmpv3_privpassphrase/> <formula>1</formula> <delay_flex/> <params/> <ipmi_sensor/> <data_type>0</data_type> <authtype>0</authtype> <username/> <password/> <publickey/> <privatekey/> <port/> <description/> <inventory_link>0</inventory_link> <applications> <application> <name>Log</name> </application> </applications> <valuemap/> <logtimefmt>yyyyxMMxddxhhxmmxssxxxxxx</logtimefmt> </item> </items> <discovery_rules/> <macros/> <templates/> <screens/> </template> </templates> <triggers> <trigger> <expression>({Template_Syslog:syslog.str(.alert)}=1)and({Template_Syslog:syslog.nodata(900)}=0)</expression> <name>[SYSLOG] Alert message received</name> <url/> <status>0</status> <priority>4</priority> <description/> <type>0</type> <dependencies/> </trigger> <trigger> <expression>({Template_Syslog:syslog.str(.crit)}=1)and({Template_Syslog:syslog.nodata(900)}=0)</expression> <name>[SYSLOG] Critical message received</name> <url/> <status>0</status> <priority>3</priority> <description/> <type>0</type> <dependencies/> </trigger> <trigger> <expression>({Template_Syslog:syslog.str(.emerg)}=1)and({Template_Syslog:syslog.nodata(900)}=0)</expression> <name>[SYSLOG] Emergency message received</name> <url/> <status>0</status> <priority>5</priority> <description/> <type>0</type> <dependencies/> </trigger> <trigger> <expression>({Template_Syslog:syslog.str(.err)}=1)and({Template_Syslog:syslog.nodata(900)}=0)</expression> <name>[SYSLOG] Error received</name> <url/> <status>0</status> <priority>2</priority> <description/> <type>0</type> <dependencies/> </trigger> <trigger> <expression>({Template_Syslog:syslog.str(.warning)}=1)and({Template_Syslog:syslog.nodata(900)}=0)</expression> <name>[SYSLOG] Warning received</name> <url/> <status>0</status> <priority>1</priority> <description/> <type>0</type> <dependencies/> </trigger> </triggers> </zabbix_export> Of course, it is not necessary to catch all messages warning, error, critical and so on. This is just a generic version that helps not to miss something abnormal. Using the trigger functions iregxp (), regxp (), str () , you can always record more specific events in the logs.
Automatic attachment to the card
Let's touch on another important point that simplifies working with syslog messages - contextual transition from the network map.
You can spend a day or two and suffer the addition of URL links for each host to its syslog item with your hands:
But rather the hands wither by clicking on the mouse, or the mind will touch. It is better to turn again to Zabbix API for help in automating this routine work:
To do this, we assign a script that will be
1) Take all the elements of the network map
2) For all elements of the node type, check whether it has a data element with key = syslog
3) If so, add a link to the list of existing URLs to view this data item (if there is already a URL to Syslog, then do nothing)
When the script is ready, we will deploy it only on Zabbix-server:
/usr/local/bin/zabbix_syslog_create_urls.pl
#!/usr/bin/perl #fixed URL for ZBX 2.4 use 5.010; use strict; use warnings; use JSON::RPC::Legacy::Client; use Data::Dumper; use Config::General; our $VERSION = 1.1; my $conf = Config::General->new('/usr/local/etc/zabbix_syslog.cfg'); my %Config = $conf->getall; #Authenticate yourself my $client = JSON::RPC::Legacy::Client->new(); my $url = $Config{'url'} || die "URL is missing in zabbix_syslog.cfg\n"; my $user = $Config{'user'} || die "API user is missing in zabbix_syslog.cfg\n"; my $password = $Config{'password'} || die "API user password is missing in zabbix_syslog.cfg\n"; my $server = $Config{'server'} || die "server hostname is missing in zabbix_syslog.cfg\n"; my $debug = $Config{'debug'}; my ( $authID, $response, $json ); my $id = 0; $authID = login(); my $syslog_url_base = 'history.php?action=showvalues'; my @selements; foreach my $map ( @{ map_get_extended() } ) { my $mapid=$map->{sysmapid}; #next unless ($mapid == 120 or $mapid == 116); #debug #put all mapelements into array @selements (so you can update map later!) @selements = @{ $map->{selements} }; foreach my $selement (@selements) { my $syslog_button_exists = 0; if ( $debug > 0 ) { print 'Object ID: ' . $selement->{selementid} . ' Type: ' . $selement->{elementtype} . ' Elementid ' . $selement->{elementid} . " \n"; } # elementtype=0 hosts if ( $selement->{elementtype} == 0 ) { my $hostid = $selement->{elementid}; my $itemid = get_syslogid_by_hostid($hostid); if ($itemid) { #and add urls: my $syslog_exists = 0; foreach my $syslog_url ( @{ $selement->{urls} } ) { $syslog_exists = 0; if ( $syslog_url->{name} =~ 'Syslog' ) { $syslog_exists = 1; $syslog_url->{'name'} = 'Syslog'; $syslog_url->{'url'} = $syslog_url_base . '&itemids[' . $itemid . ']=' . $itemid; } } if ( $syslog_exists == 0 ) { #syslog item doesn't exist... add it push @{ $selement->{urls} }, { 'name' => 'Syslog', 'url' => $syslog_url_base . '&itemids[' . $itemid . ']=' . $itemid }; } } } } map_update($mapid,\@selements); } logout(); #______SUBS sub get_syslogid_by_hostid { my $hostids = shift; $json = { jsonrpc => '2.0', method => 'item.get', params => { output => ['itemid'], hostids => $hostids, search => { 'key_' => 'syslog' }, limit => 1, }, id => $id++, auth => $authID, }; $response = $client->call( $url, $json ); # Check if response was successful if ( !$response->content->{'result'} ) { logout(); die "item.get failed\n"; } #return itemid of syslog key (trapper type) return ${ $response->content->{'result'} }[0]->{itemid}; } sub login { $json = { jsonrpc => '2.0', method => 'user.login', params => { user => $user, password => $password }, id => $id++, }; $response = $client->call( $url, $json ); # Check if response was successful die "Authentication failed\n" unless $response->content->{'result'}; if ( $debug > 0 ) { print Dumper $response->content->{'result'}; } return $response->content->{'result'}; } sub map_get { #retrieve all maps $json = { jsonrpc => '2.0', method => 'map.get', params => { output => ['sysmapid'] }, id => $id++, auth => "$authID", }; $response = $client->call( $url, $json ); # Check if response was successful if ( !$response->content->{'result'} ) { logout(); die "map.get failed\n"; } if ( $debug > 1 ) { print Dumper $response->content->{result}; } return $response->content->{result}; } sub logout { $json = { jsonrpc => '2.0', method => 'user.logout', params => {}, id => $id++, auth => $authID, }; $response = $client->call( $url, $json ); # Check if response was successful warn "Logout failed\n" unless $response->content->{'result'}; return; } sub map_get_extended { $json = { jsonrpc => '2.0', method => 'map.get', params => { selectSelements => 'extend', #sysmapids => $map, }, id => $id++, auth => $authID, }; $response = $client->call( $url, $json ); # Check if response was successful if ( !$response->content->{'result'} ) { logout(); die "map.get failed\n"; } if ( $debug > 1 ) { print Dumper $response->content->{'result'}; } return $response->content->{'result'}; } sub map_update { my $mapid = shift; my $selements_ref = shift; $json = { jsonrpc => '2.0', method => 'map.update', params => { selements => [@{$selements_ref}], sysmapid => $mapid, }, id => $id++, auth => $authID, }; if ( $debug > 0 ) { print "About to map.update this\n:"; print Dumper $json; } $response = $client->call( $url, $json ); if ( $debug > 0 ) { print Dumper $response; } # Check if response was successful if ( !$response->content->{'result'} ) { logout(); die "map.update failed\n"; } return; } And we will immediately add the script to cron (best of all under the zabbix user) on the machine with Zabbix Server, once a day it may be enough.
* 1 * * * /usr/local/bin/zabbix_syslog_create_urls.pl Also do not forget to make the file executable:
chmod +x /usr/local/bin/zabbix_syslog_create_urls.pl Done!
Total
Zabbiks knows a lot out of the box. However, if there is not what you need - to despair early. Zabbix API, as well as zabbix_sender, plug-ins , UserParameter - all these tools to your services to expand the capabilities of the system.
Source: https://habr.com/ru/post/252915/
All Articles